| Param | Original file | Final file |
|---|---|---|
| Filename | modeM0/AS1A09_016T03_9000003740_25664cztM0_level2.evt | modeM0/AS1A09_016T03_9000003740_25664cztM0_level2_quad_clean.evt |
| Size (bytes) | 103,760,640 | 22,999,680 |
| Size | 99.0 MB | 21.9 MB |
| Events in quadrant A | 701,379 | 156,316 |
| Events in quadrant B | 692,094 | 160,325 |
| Events in quadrant C | 687,975 | 148,761 |
| Events in quadrant D | 977,683 | 140,964 |
| Mode M0 | |||
|---|---|---|---|
| Quadrant | BADHDUFLAG | Total packets | Discarded packets |
| A | 0 | 2810 | 0 |
| B | 0 | 2753 | 0 |
| C | 0 | 2750 | 0 |
| D | 0 | 3776 | 0 |
| Mode M9 | |||
|---|---|---|---|
| Quadrant | BADHDUFLAG | Total packets | Discarded packets |
| A | 0 | 1 | 0 |
| B | 0 | 1 | 0 |
| C | 0 | 1 | 0 |
| D | 0 | 1 | 0 |
| Quadrant | Total seconds | Saturated seconds | Saturation percentage |
|---|---|---|---|
| A | 1190 | 1 | 0.084034% |
| B | 1189 | 5 | 0.420521% |
| C | 1189 | 13 | 1.093356% |
| D | 1189 | 13 | 1.093356% |
Noise dominated data is calculated using 1-second bins in cleaned event files. If a bin has >2000 counts, and if more than 50% of those come from <1% of pixels, then it is considered to be noise-dominated and hence unusable.
| Quadrant | # 1 sec bins | Bins with >0 counts | Bins with >2000 counts | High rate bins dominated by noise | Noise dominated (total time) | Noise dominated (detector-on time) | Marked lightcurve |
|---|---|---|---|---|---|---|---|
| A | 1190 | 1190 | 0 | 0 | 0.00% | 0.00% | 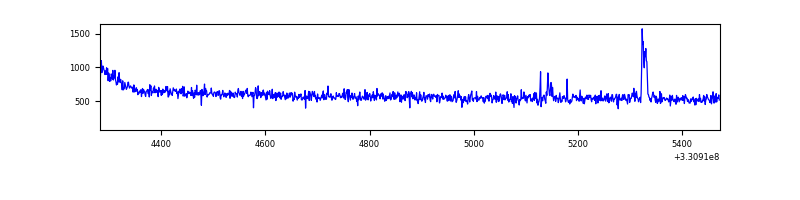 |
| B | 1189 | 1189 | 0 | 0 | 0.00% | 0.00% | 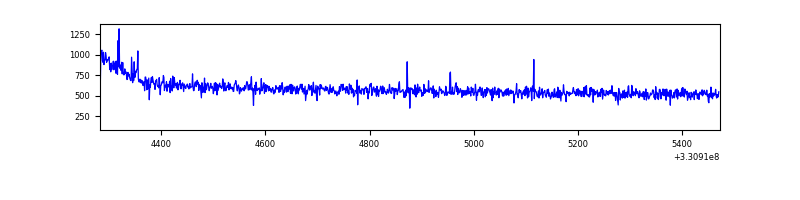 |
| C | 1189 | 1189 | 0 | 0 | 0.00% | 0.00% | 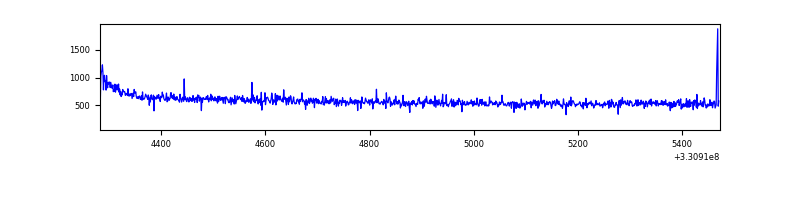 |
| D | 1189 | 1189 | 7 | 7 | 0.59% | 0.59% | 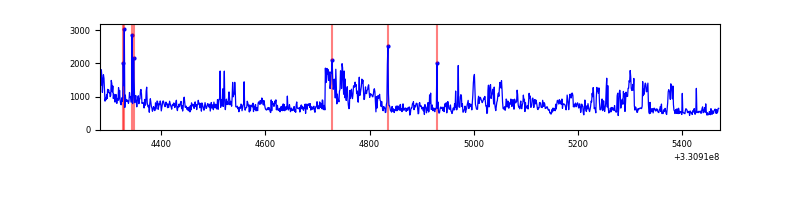 |
Top three noisy pixels from each quadrant. If the there are fewer than three noisy pixels in the level2.evt file, extra rows are filled as -1
| Pixel properties | Quadrant properties | ||||||
|---|---|---|---|---|---|---|---|
| Quadrant | DetID | PixID | Counts | Sigma | Mean | Median | Sigma |
| A | 8 | 192 | 20929 | 569.93 | 173 | 171 | 36.4 |
| A | 12 | 96 | 11962 | 323.73 | 173 | 171 | 36.4 |
| A | 13 | 254 | 1877 | 46.84 | 173 | 171 | 36.4 |
| B | 0 | 245 | 5211 | 146.06 | 175 | 172 | 34.5 |
| B | 12 | 111 | 3633 | 100.32 | 175 | 172 | 34.5 |
| B | 11 | 111 | 3285 | 90.23 | 175 | 172 | 34.5 |
| C | 14 | 238 | 27659 | 682.23 | 166 | 168 | 40.3 |
| C | 5 | 112 | 5762 | 138.82 | 166 | 168 | 40.3 |
| C | 3 | 233 | 2235 | 51.3 | 166 | 168 | 40.3 |
| D | 1 | 52 | 304877 | 7463.86 | 163 | 159 | 40.8 |
| D | 8 | 195 | 52666 | 1286.12 | 163 | 159 | 40.8 |
| D | 2 | 234 | 4623 | 109.34 | 163 | 159 | 40.8 |
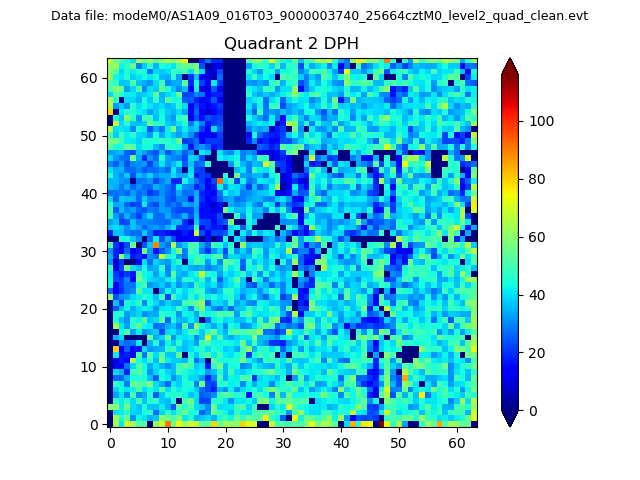
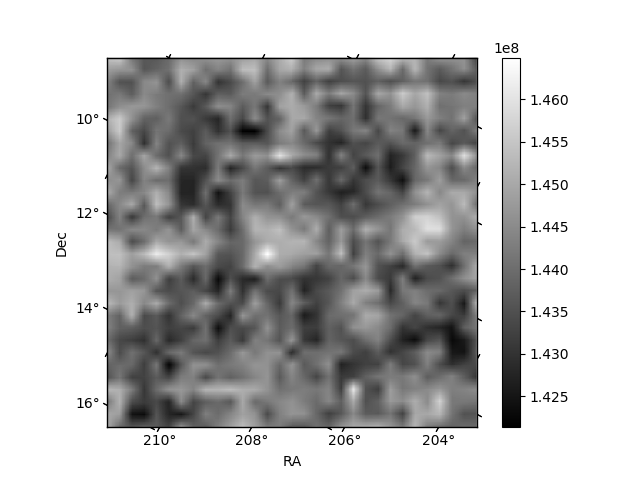
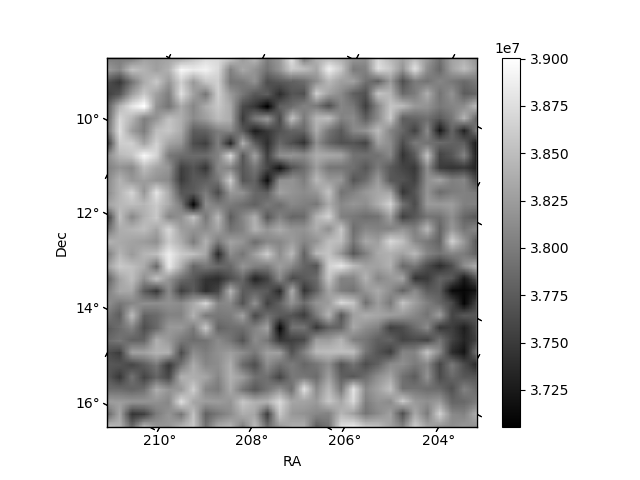
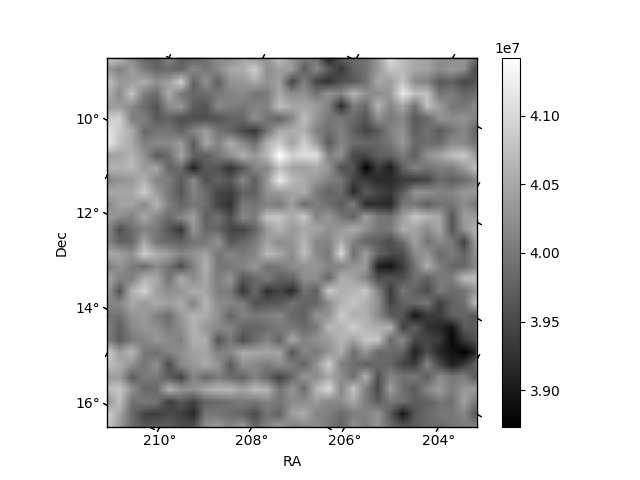
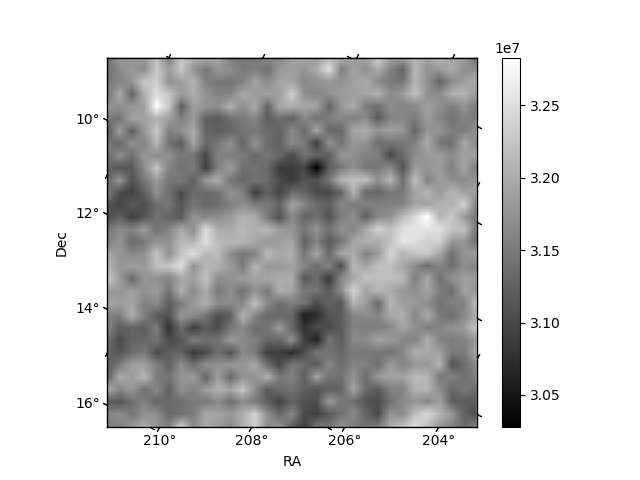
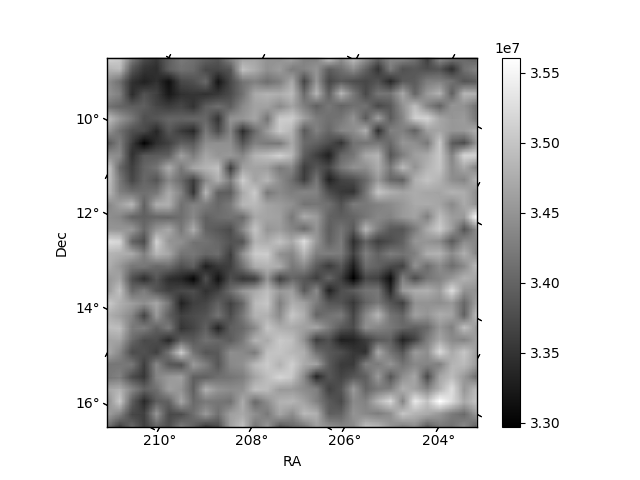
Histogram calculated using DETX and DETY for each event in the final _common_clean file
| Quadrant A | 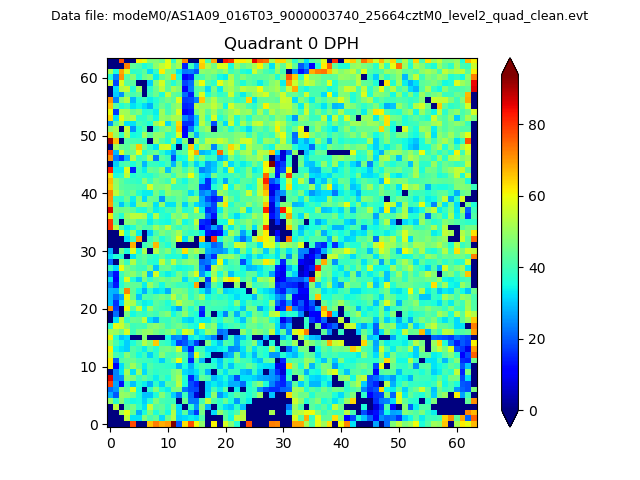 |
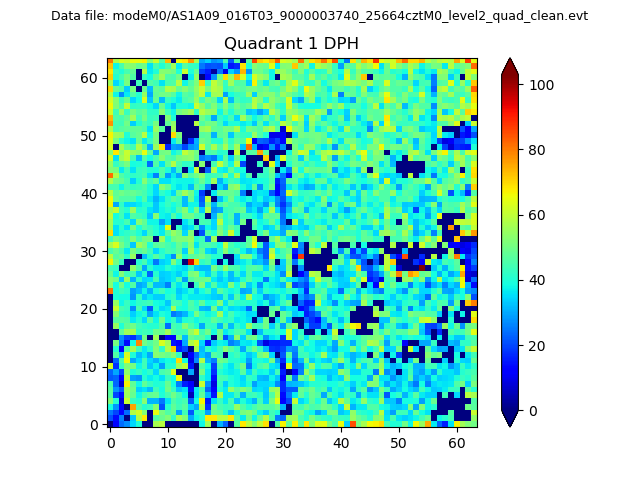 |
Quadrant B |
|---|---|---|---|
| Quadrant D | 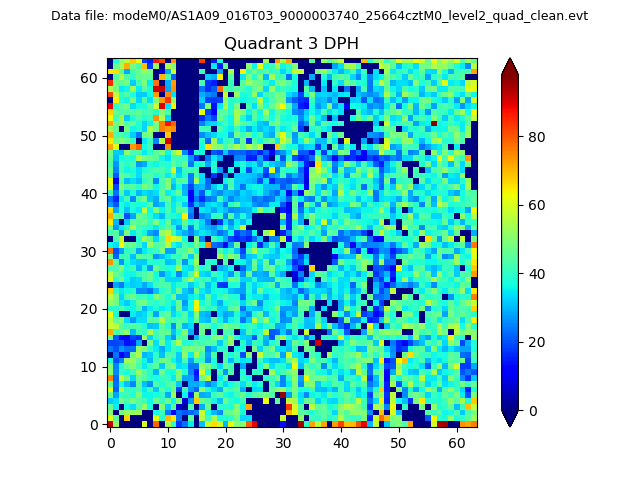 |
 |
Quadrant C |
| Plot type | Count rate plots | Images |
|---|---|---|
| Comparison with Poisson distribution Blue bars denote a histogram of data divided into 1 sec bins. Red curve is a Poisson curve with rate = median count rate of data. |
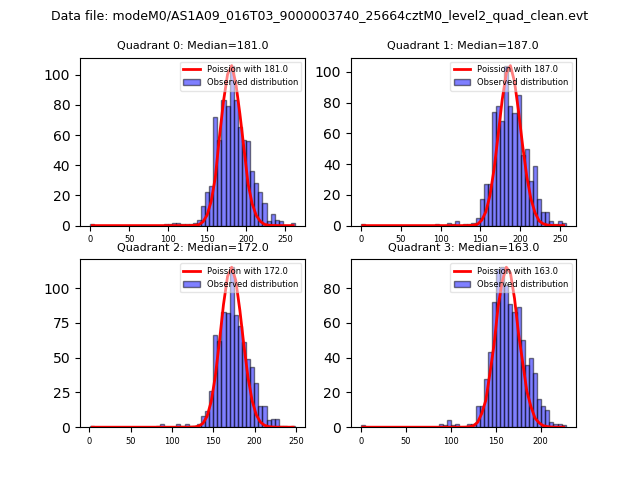 |
 |
| Quadrant-wise count rates Data is divided into 100 sec bins |
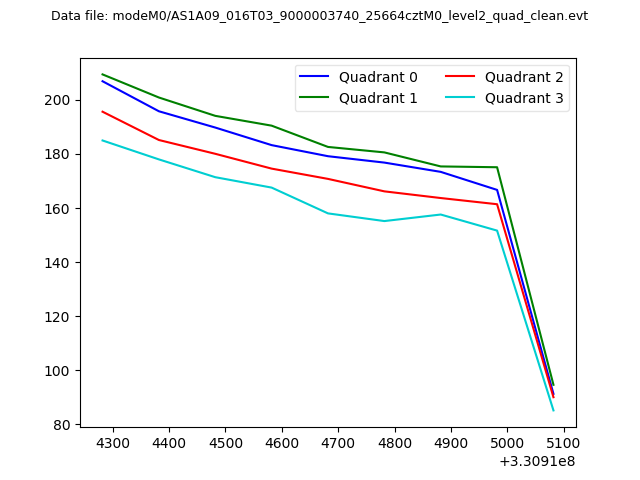 |
|
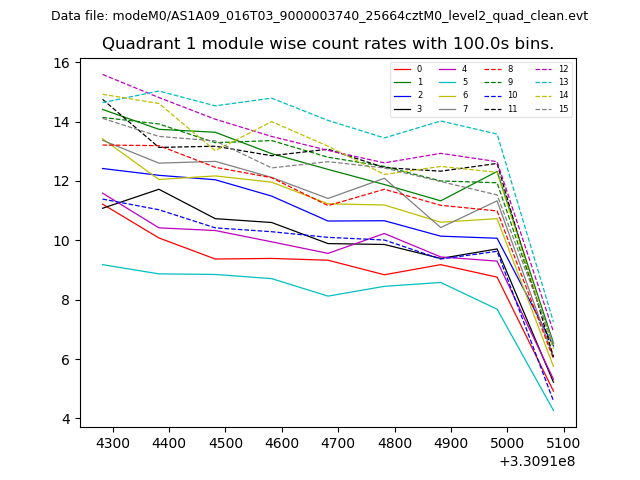
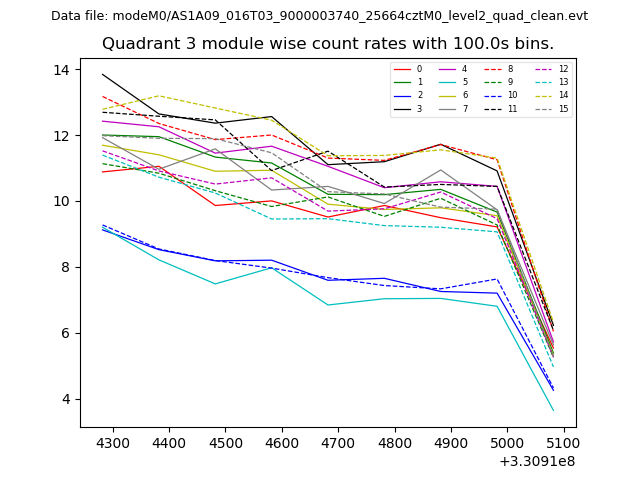
| Module-wise count rates for Quadrant A Data is divided into 100 sec bins |
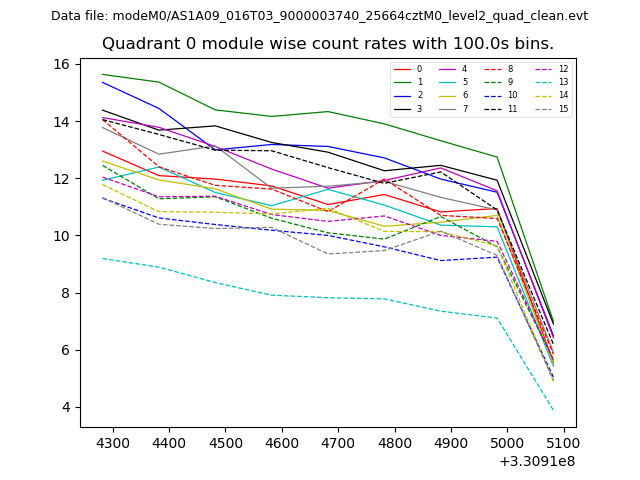 |
 |
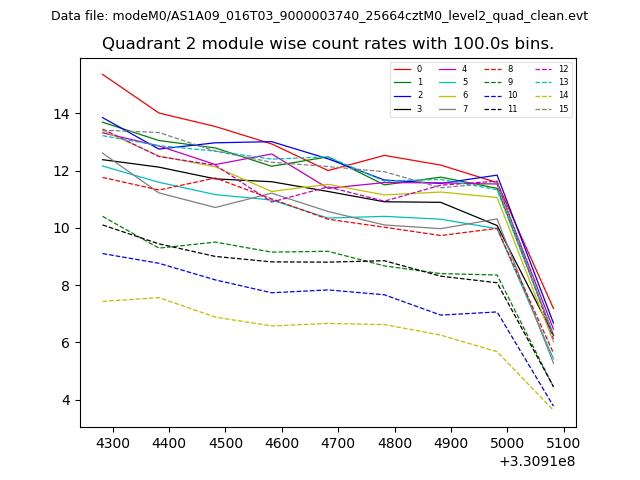
| Module-wise count rates for Quadrant B Data is divided into 100 sec bins |
 |
 |
| Module-wise count rates for Quadrant C Data is divided into 100 sec bins |
 |
 |
| Module-wise count rates for Quadrant D Data is divided into 100 sec bins |
 |
 |
| Parameter | Plot |
|---|---|
| CZT HV Monitor | 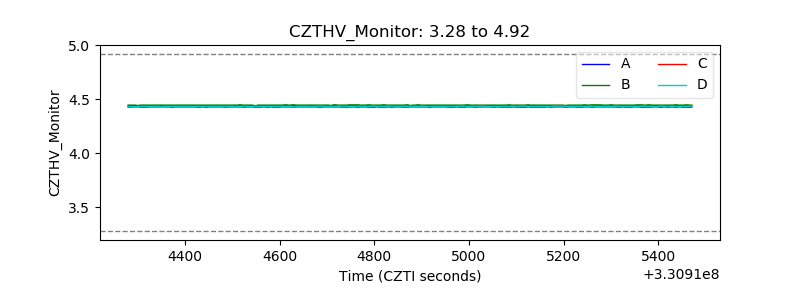 |
| D_VDD | 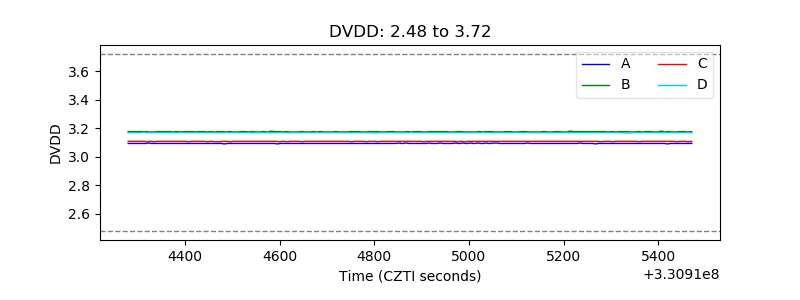 |
| Temperature 1 | 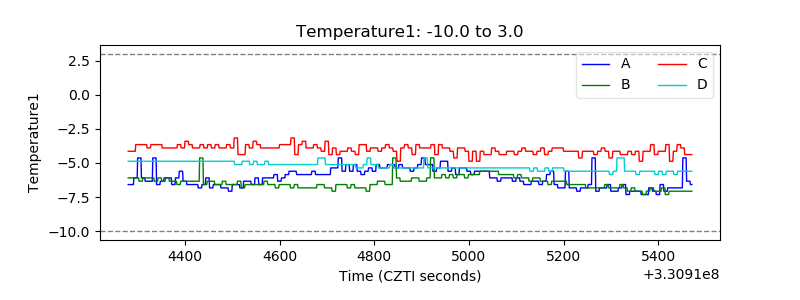 |
| Veto HV Monitor | 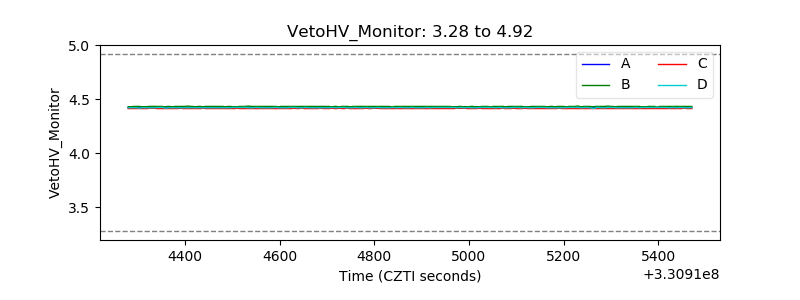 |
| Veto LLD | 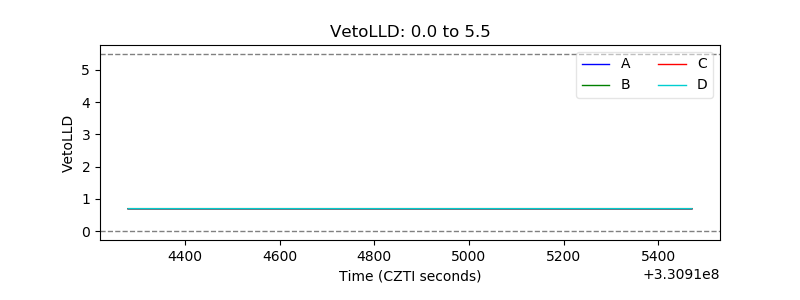 |
| Alpha Counter | 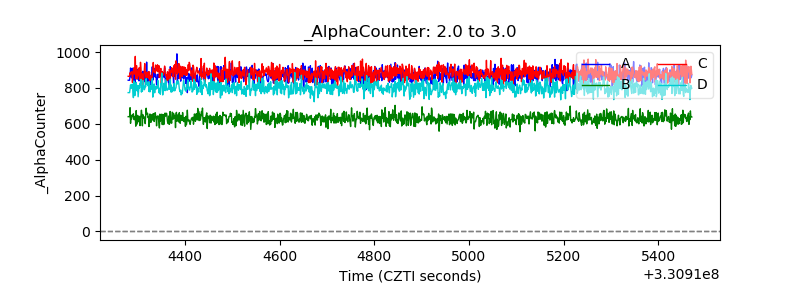 |
| _CPM_Rate | 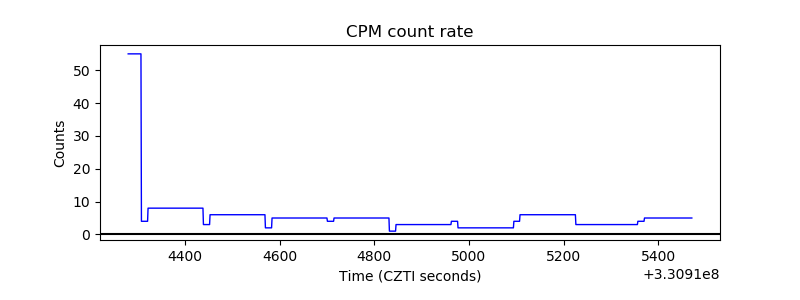 |
| CZT Counter | 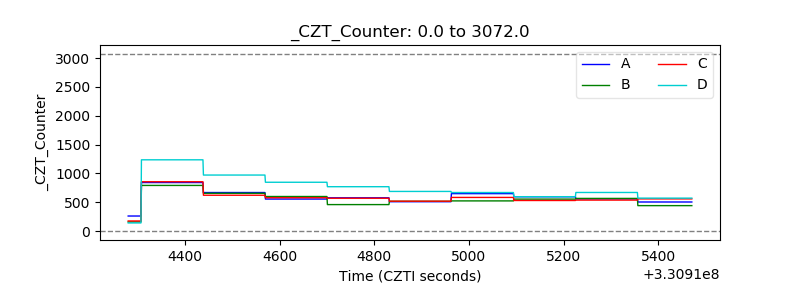 |
| +2.5 Volts monitor | 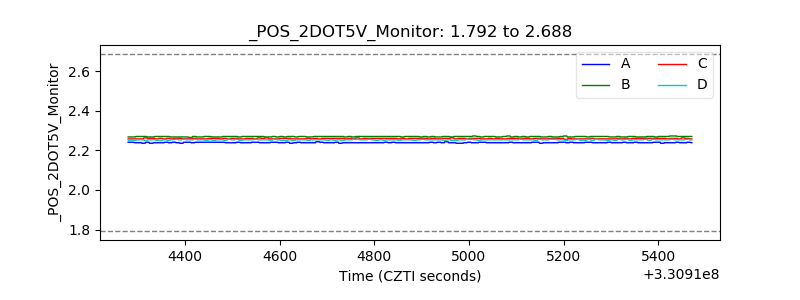 |
| +5 Volts monitor |  |
| _ROLL_ROT | 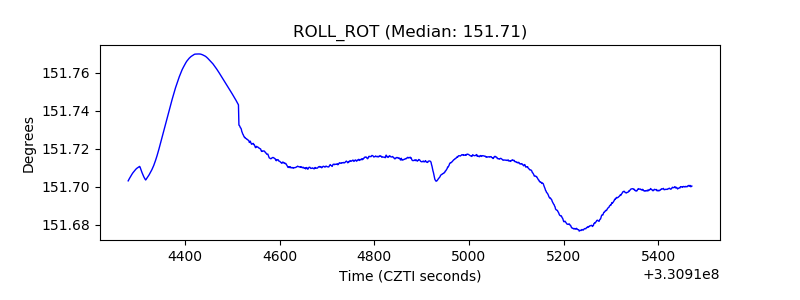 |
| _Roll_DEC | 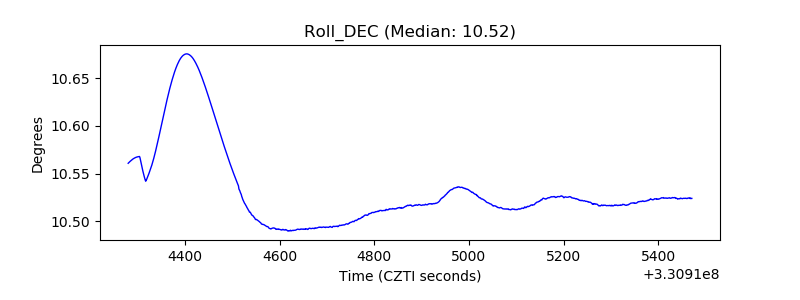 |
| _Roll_RA | 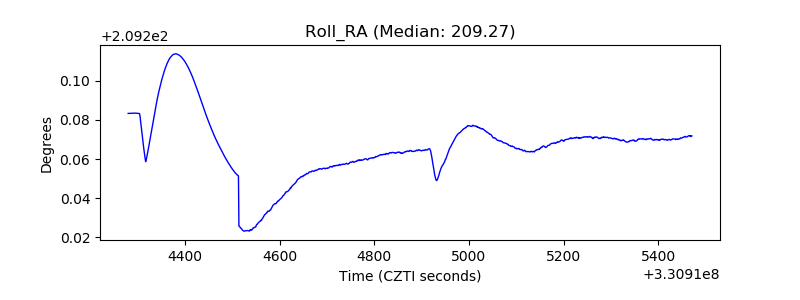 |
| Veto Counter | 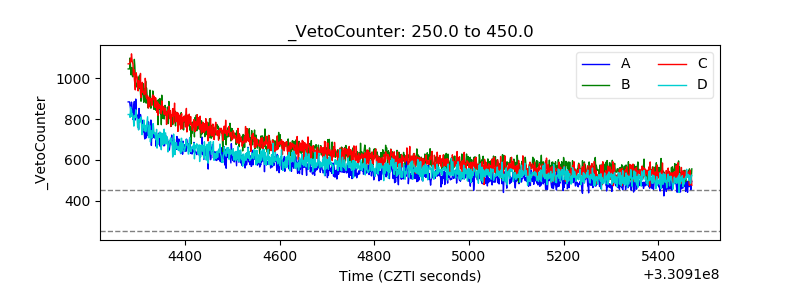 |