| Param | Original file | Final file |
|---|---|---|
| Filename | modeM0/AS1A09_016T03_9000003740_25665cztM0_level2.evt | modeM0/AS1A09_016T03_9000003740_25665cztM0_level2_quad_clean.evt |
| Size (bytes) | 499,377,600 | 78,940,800 |
| Size | 476.2 MB | 75.3 MB |
| Events in quadrant A | 3,365,102 | 503,534 |
| Events in quadrant B | 3,318,301 | 517,698 |
| Events in quadrant C | 3,307,570 | 479,355 |
| Events in quadrant D | 4,713,946 | 458,567 |
| Mode M0 | |||
|---|---|---|---|
| Quadrant | BADHDUFLAG | Total packets | Discarded packets |
| A | 0 | 13460 | 0 |
| B | 0 | 13307 | 0 |
| C | 0 | 13321 | 0 |
| D | 0 | 18230 | 0 |
| Mode M9 | |||
|---|---|---|---|
| Quadrant | BADHDUFLAG | Total packets | Discarded packets |
| A | 0 | 14 | 0 |
| B | 0 | 14 | 0 |
| C | 0 | 14 | 0 |
| D | 0 | 14 | 0 |
| Quadrant | Total seconds | Saturated seconds | Saturation percentage |
|---|---|---|---|
| A | 6177 | 28 | 0.453294% |
| B | 6177 | 37 | 0.598996% |
| C | 6177 | 78 | 1.262749% |
| D | 6176 | 100 | 1.619171% |
Noise dominated data is calculated using 1-second bins in cleaned event files. If a bin has >2000 counts, and if more than 50% of those come from <1% of pixels, then it is considered to be noise-dominated and hence unusable.
| Quadrant | # 1 sec bins | Bins with >0 counts | Bins with >2000 counts | High rate bins dominated by noise | Noise dominated (total time) | Noise dominated (detector-on time) | Marked lightcurve |
|---|---|---|---|---|---|---|---|
| A | 7502 | 6178 | 0 | 0 | 0.00% | 0.00% | 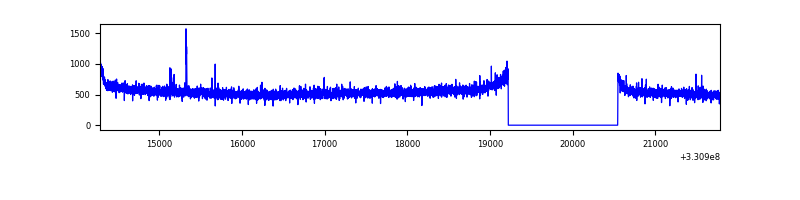 |
| B | 7502 | 6178 | 2 | 2 | 0.03% | 0.03% | 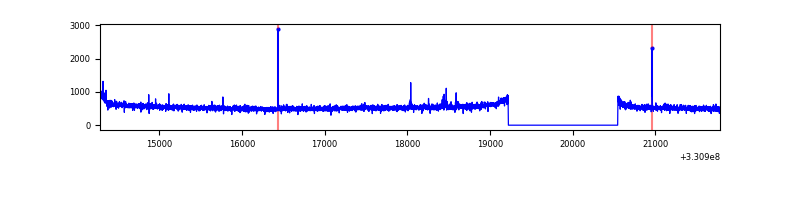 |
| C | 7502 | 6178 | 0 | 0 | 0.00% | 0.00% | 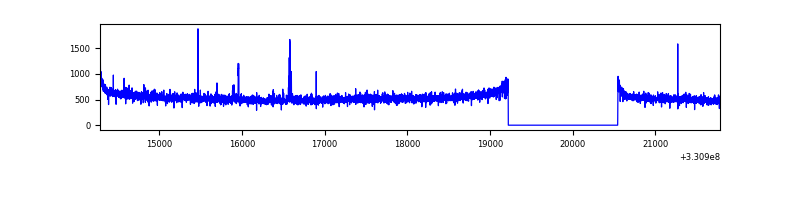 |
| D | 7501 | 6177 | 68 | 68 | 0.91% | 1.10% | 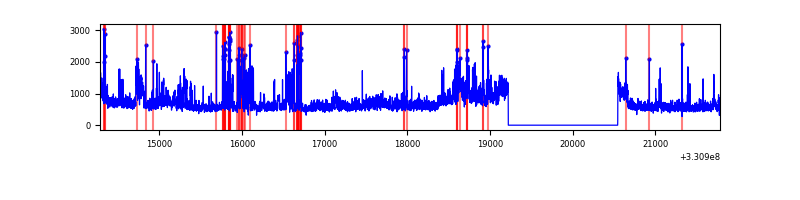 |
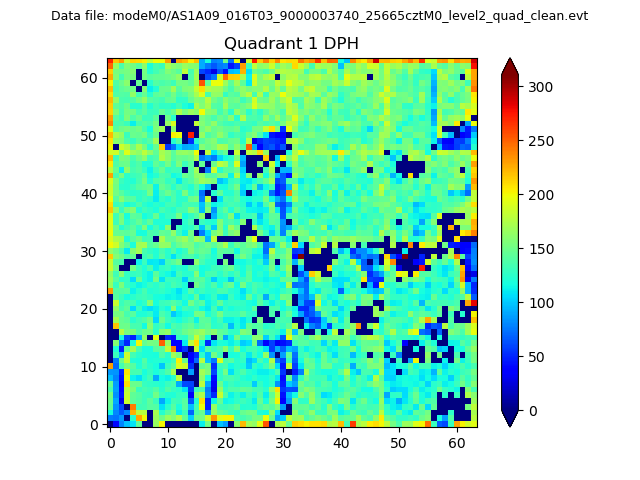
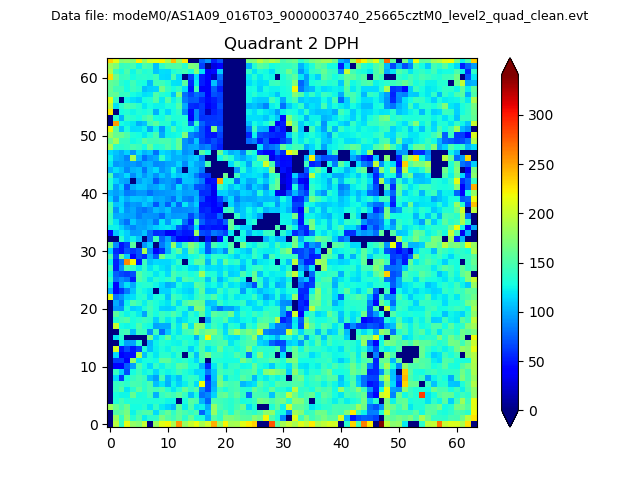
Top three noisy pixels from each quadrant. If the there are fewer than three noisy pixels in the level2.evt file, extra rows are filled as -1
| Pixel properties | Quadrant properties | ||||||
|---|---|---|---|---|---|---|---|
| Quadrant | DetID | PixID | Counts | Sigma | Mean | Median | Sigma |
| A | 8 | 192 | 108564 | 647.83 | 840 | 827 | 166.3 |
| A | 12 | 96 | 16695 | 95.41 | 840 | 827 | 166.3 |
| A | 13 | 254 | 8962 | 48.91 | 840 | 827 | 166.3 |
| B | 12 | 111 | 18703 | 113.38 | 840 | 823 | 157.7 |
| B | 11 | 111 | 16863 | 101.71 | 840 | 823 | 157.7 |
| B | 14 | 111 | 15753 | 94.67 | 840 | 823 | 157.7 |
| C | 14 | 238 | 133543 | 715.92 | 800 | 807 | 185.4 |
| C | 5 | 112 | 36184 | 190.81 | 800 | 807 | 185.4 |
| C | 3 | 233 | 14998 | 76.54 | 800 | 807 | 185.4 |
| D | 1 | 52 | 1290702 | 6627.91 | 796 | 775 | 194.6 |
| D | 8 | 195 | 370136 | 1897.85 | 796 | 775 | 194.6 |
| D | 13 | 104 | 36985 | 186.05 | 796 | 775 | 194.6 |
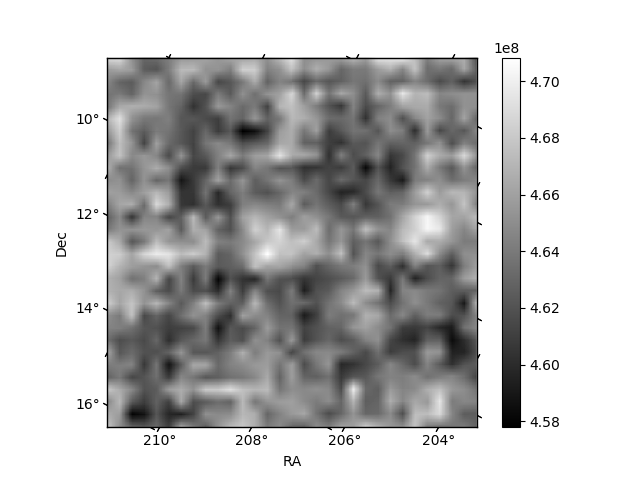
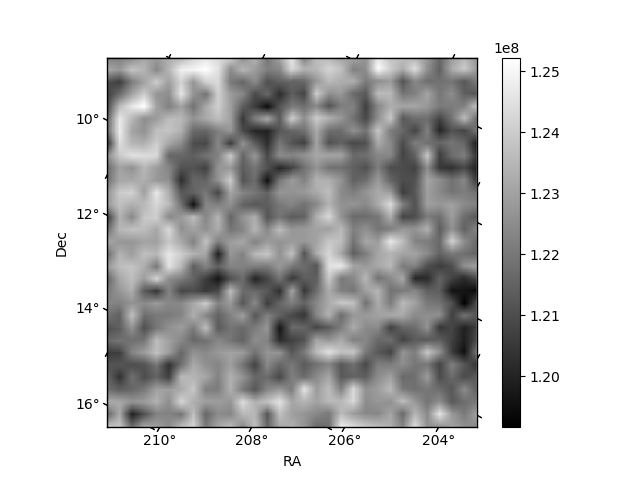
Histogram calculated using DETX and DETY for each event in the final _common_clean file
| Quadrant A | 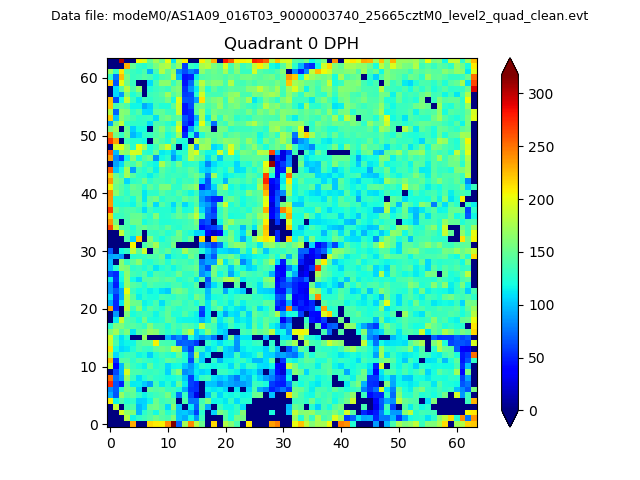 |
 |
Quadrant B |
|---|---|---|---|
| Quadrant D |  |
 |
Quadrant C |
| Plot type | Count rate plots | Images |
|---|---|---|
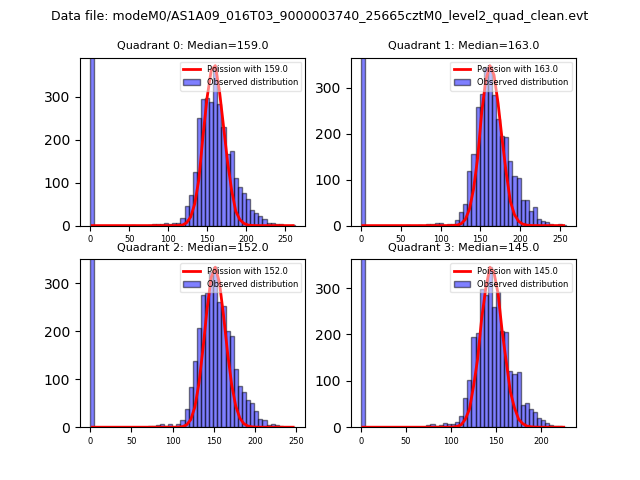
| Comparison with Poisson distribution Blue bars denote a histogram of data divided into 1 sec bins. Red curve is a Poisson curve with rate = median count rate of data. |
 |
 |
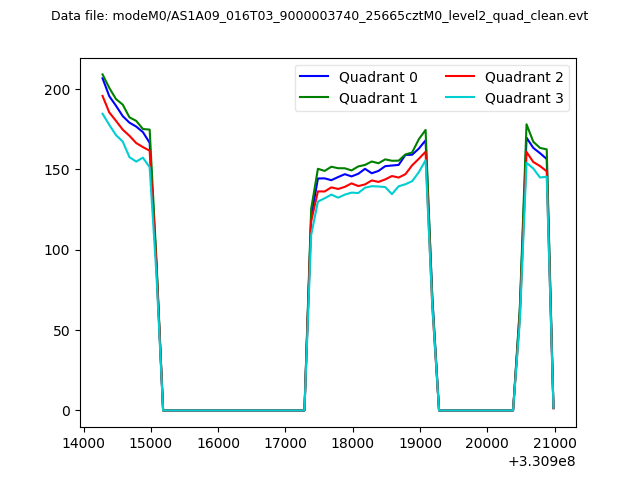
| Quadrant-wise count rates Data is divided into 100 sec bins |
 |
|
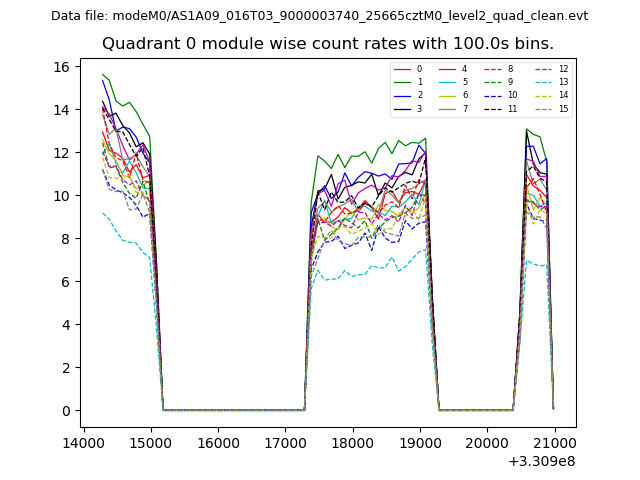
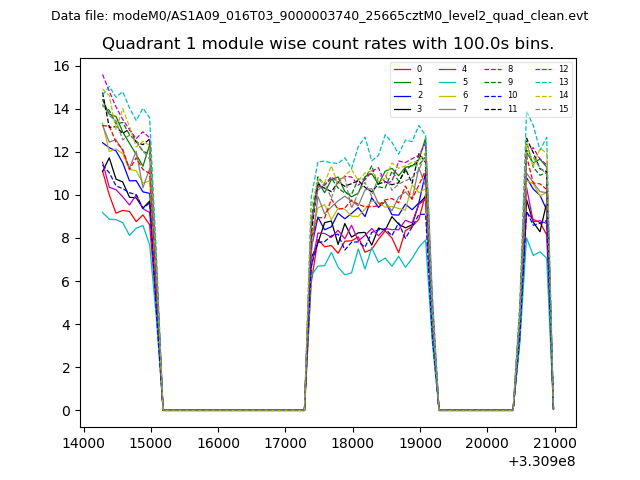
| Module-wise count rates for Quadrant A Data is divided into 100 sec bins |
 |
 |
| Module-wise count rates for Quadrant B Data is divided into 100 sec bins |
 |
 |
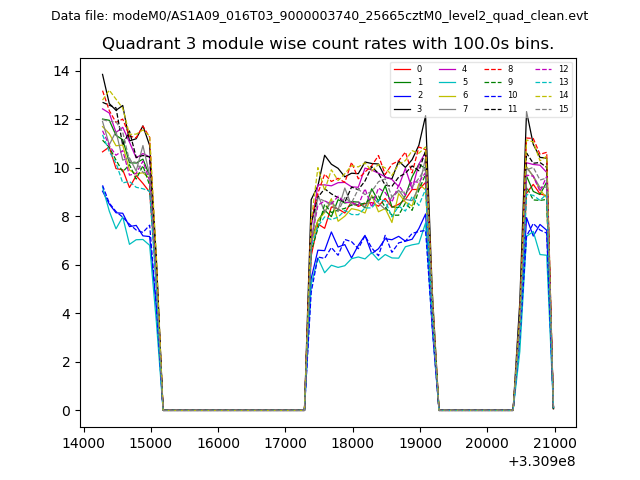
| Module-wise count rates for Quadrant C Data is divided into 100 sec bins |
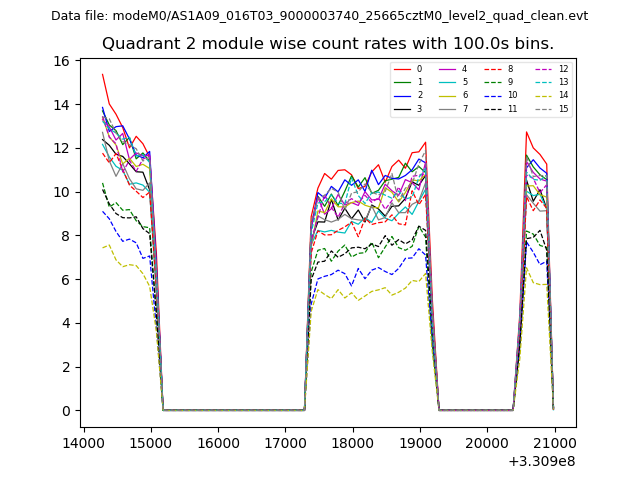 |
 |
| Module-wise count rates for Quadrant D Data is divided into 100 sec bins |
 |
 |
| Parameter | Plot |
|---|---|
| CZT HV Monitor | 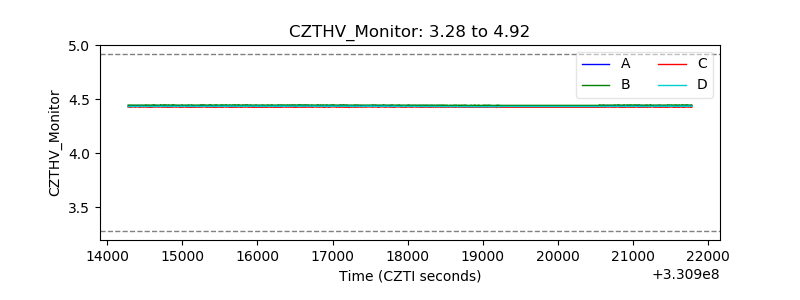 |
| D_VDD | 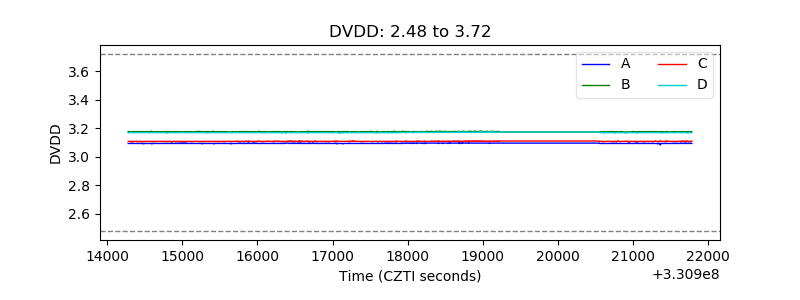 |
| Temperature 1 | 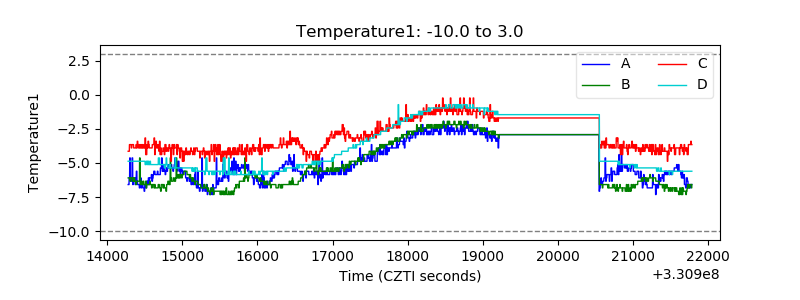 |
| Veto HV Monitor | 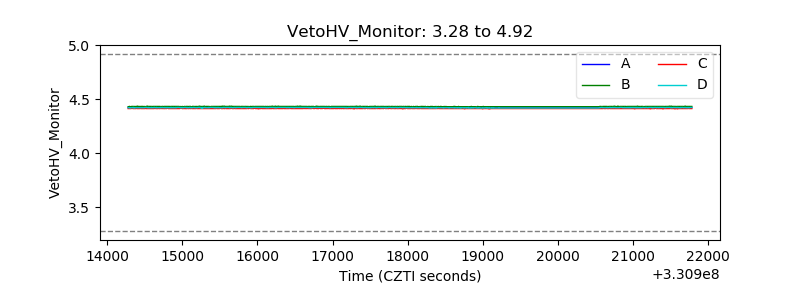 |
| Veto LLD | 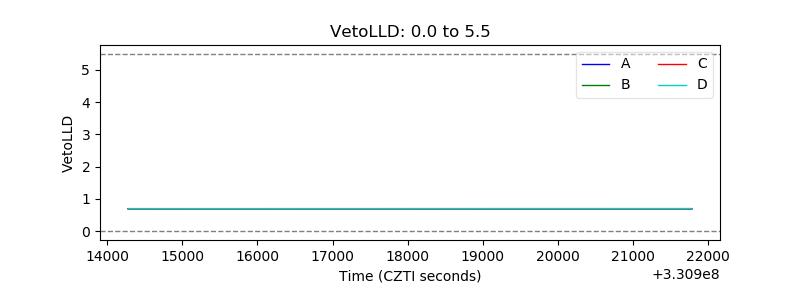 |
| Alpha Counter |  |
| _CPM_Rate | 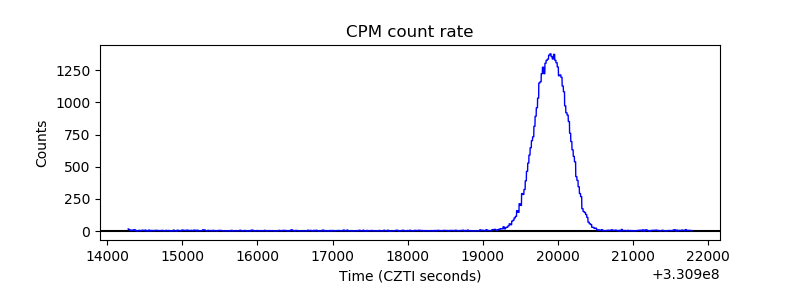 |
| CZT Counter |  |
| +2.5 Volts monitor |  |
| +5 Volts monitor |  |
| _ROLL_ROT | 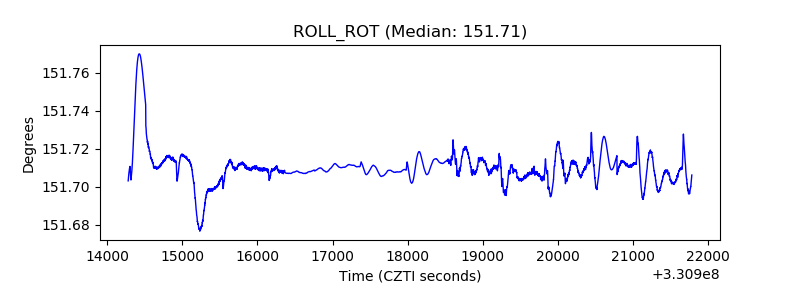 |
| _Roll_DEC | 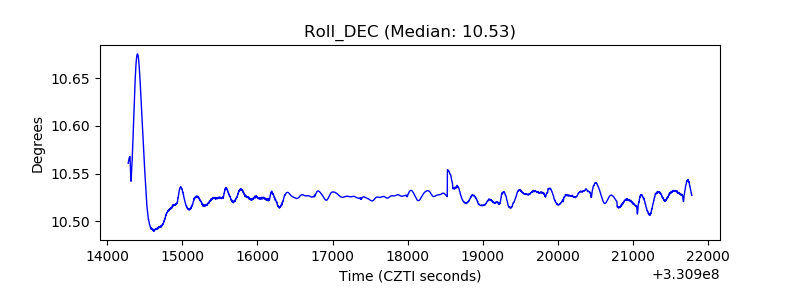 |
| _Roll_RA |  |
| Veto Counter | 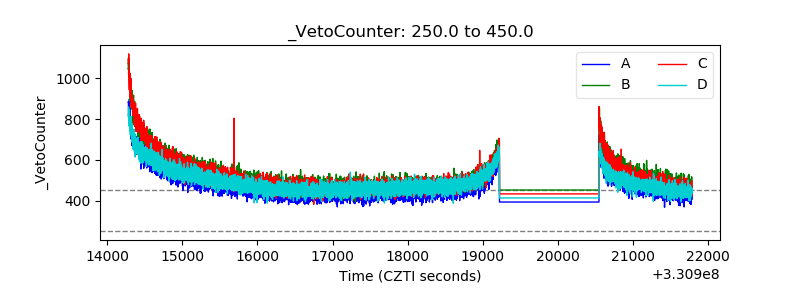 |