| Param | Original file | Final file |
|---|---|---|
| Filename | modeM0/AS1A09_016T03_9000003740_25666cztM0_level2.evt | modeM0/AS1A09_016T03_9000003740_25666cztM0_level2_quad_clean.evt |
| Size (bytes) | 465,701,760 | 72,342,720 |
| Size | 444.1 MB | 69.0 MB |
| Events in quadrant A | 3,375,563 | 445,972 |
| Events in quadrant B | 3,325,344 | 455,665 |
| Events in quadrant C | 3,275,463 | 425,176 |
| Events in quadrant D | 3,689,622 | 413,775 |
| Mode M0 | |||
|---|---|---|---|
| Quadrant | BADHDUFLAG | Total packets | Discarded packets |
| A | 0 | 13585 | 0 |
| B | 0 | 13493 | 0 |
| C | 0 | 13398 | 0 |
| D | 0 | 15007 | 0 |
| Mode M9 | |||
|---|---|---|---|
| Quadrant | BADHDUFLAG | Total packets | Discarded packets |
| A | 0 | 19 | 0 |
| B | 0 | 20 | 0 |
| C | 0 | 20 | 0 |
| D | 0 | 20 | 0 |
| Quadrant | Total seconds | Saturated seconds | Saturation percentage |
|---|---|---|---|
| A | 6445 | 49 | 0.760279% |
| B | 6444 | 74 | 1.148355% |
| C | 6444 | 77 | 1.194910% |
| D | 6444 | 24 | 0.372439% |
Noise dominated data is calculated using 1-second bins in cleaned event files. If a bin has >2000 counts, and if more than 50% of those come from <1% of pixels, then it is considered to be noise-dominated and hence unusable.
| Quadrant | # 1 sec bins | Bins with >0 counts | Bins with >2000 counts | High rate bins dominated by noise | Noise dominated (total time) | Noise dominated (detector-on time) | Marked lightcurve |
|---|---|---|---|---|---|---|---|
| A | 7440 | 6446 | 1 | 1 | 0.01% | 0.02% | 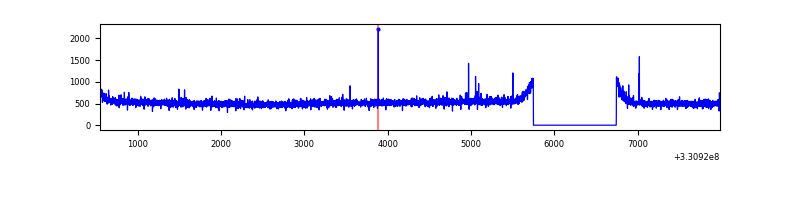 |
| B | 7439 | 6445 | 1 | 1 | 0.01% | 0.02% | 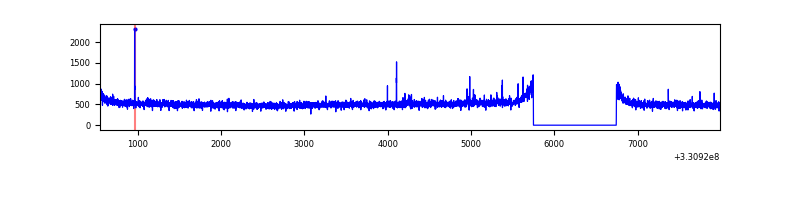 |
| C | 7439 | 6445 | 0 | 0 | 0.00% | 0.00% | 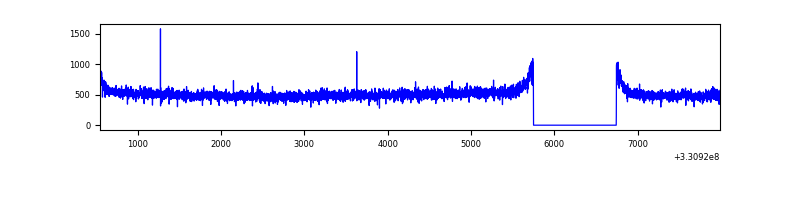 |
| D | 7439 | 6445 | 5 | 5 | 0.07% | 0.08% | 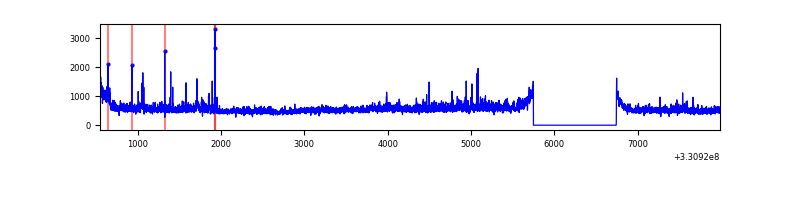 |
Top three noisy pixels from each quadrant. If the there are fewer than three noisy pixels in the level2.evt file, extra rows are filled as -1
| Pixel properties | Quadrant properties | ||||||
|---|---|---|---|---|---|---|---|
| Quadrant | DetID | PixID | Counts | Sigma | Mean | Median | Sigma |
| A | 8 | 192 | 113496 | 668.27 | 841 | 826 | 168.6 |
| A | 12 | 96 | 9479 | 51.32 | 841 | 826 | 168.6 |
| A | 6 | 16 | 8901 | 47.89 | 841 | 826 | 168.6 |
| B | 12 | 111 | 19593 | 116.8 | 841 | 820 | 160.7 |
| B | 11 | 111 | 17569 | 104.21 | 841 | 820 | 160.7 |
| B | 14 | 111 | 16159 | 95.44 | 841 | 820 | 160.7 |
| C | 14 | 238 | 129831 | 685.19 | 803 | 810 | 188.3 |
| C | 3 | 233 | 16087 | 81.13 | 803 | 810 | 188.3 |
| C | 13 | 61 | 5501 | 24.91 | 803 | 810 | 188.3 |
| D | 8 | 195 | 428604 | 2149.38 | 805 | 782 | 199.0 |
| D | 1 | 52 | 188298 | 942.08 | 805 | 782 | 199.0 |
| D | 13 | 104 | 30345 | 148.52 | 805 | 782 | 199.0 |
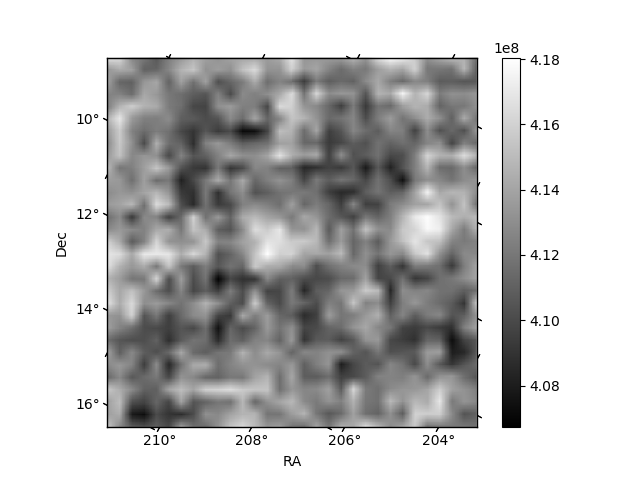
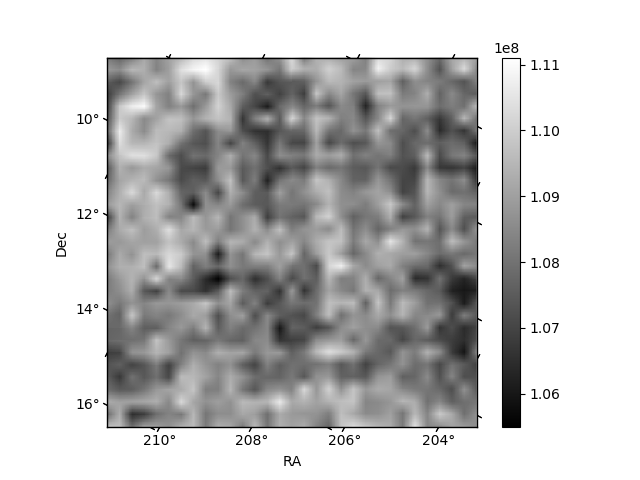
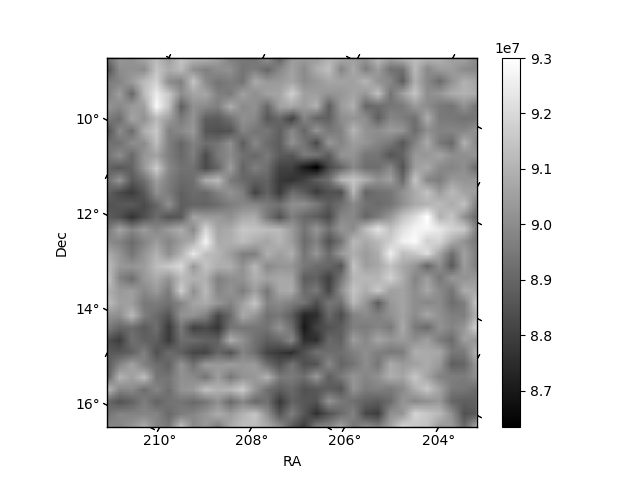
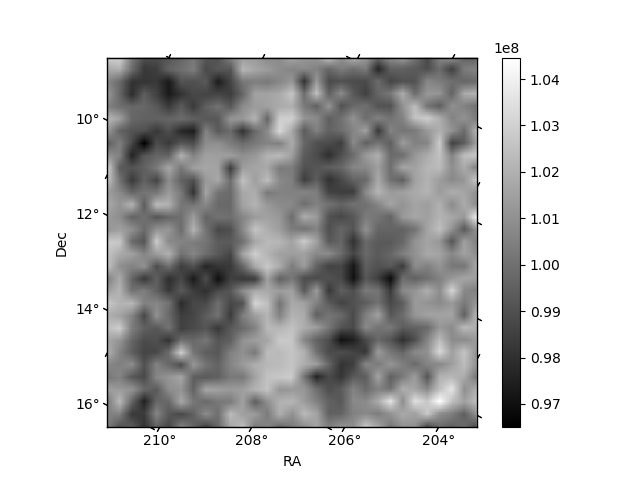
Histogram calculated using DETX and DETY for each event in the final _common_clean file
| Quadrant A | 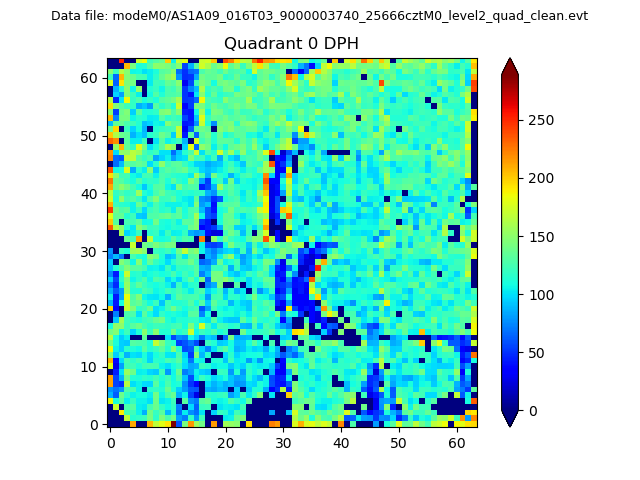 |
 |
Quadrant B |
|---|---|---|---|
| Quadrant D | 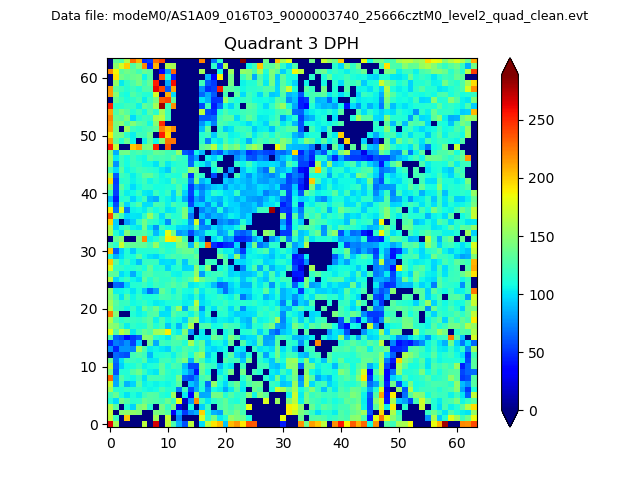 |
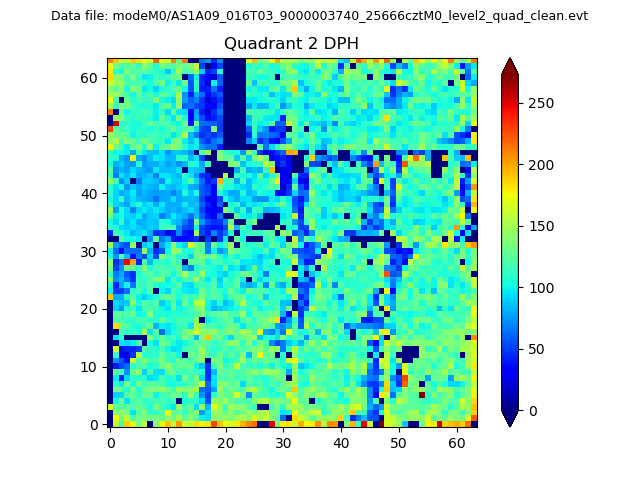 |
Quadrant C |
| Plot type | Count rate plots | Images |
|---|---|---|
| Comparison with Poisson distribution Blue bars denote a histogram of data divided into 1 sec bins. Red curve is a Poisson curve with rate = median count rate of data. |
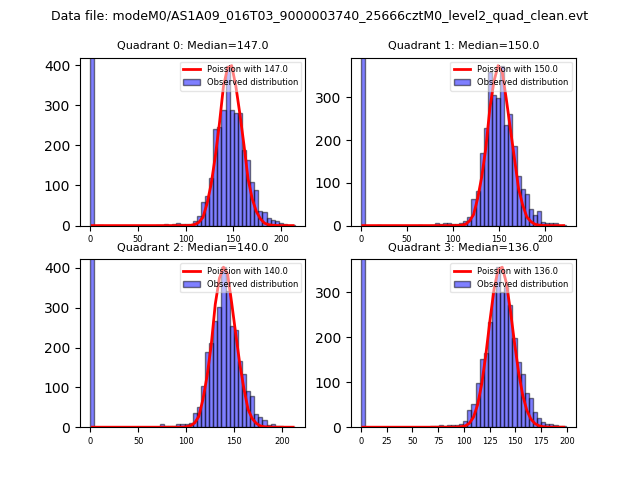 |
 |
| Quadrant-wise count rates Data is divided into 100 sec bins |
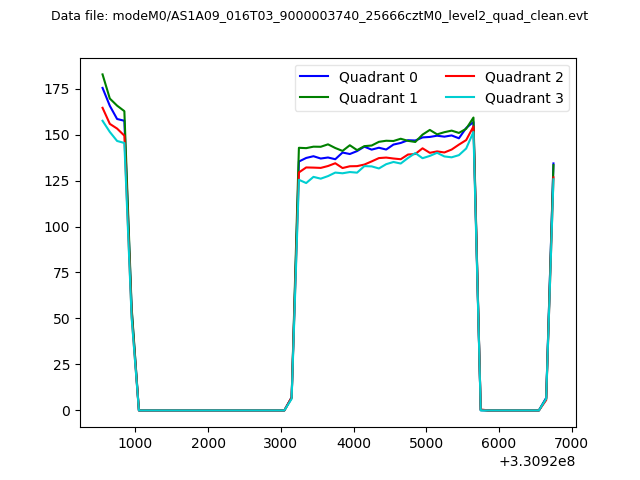 |
|
| Module-wise count rates for Quadrant A Data is divided into 100 sec bins |
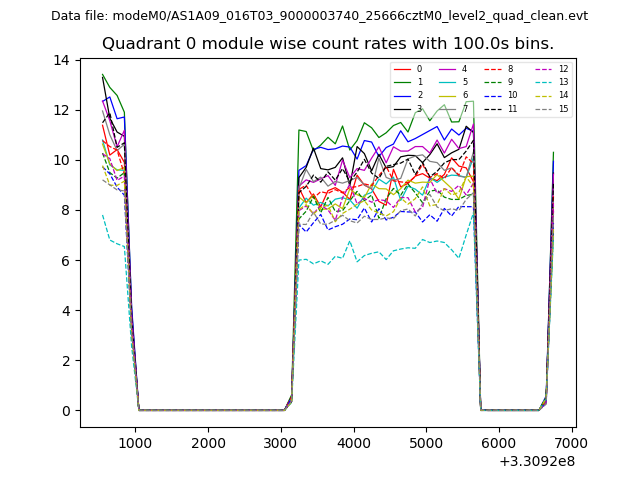 |
 |
| Module-wise count rates for Quadrant B Data is divided into 100 sec bins |
 |
 |
| Module-wise count rates for Quadrant C Data is divided into 100 sec bins |
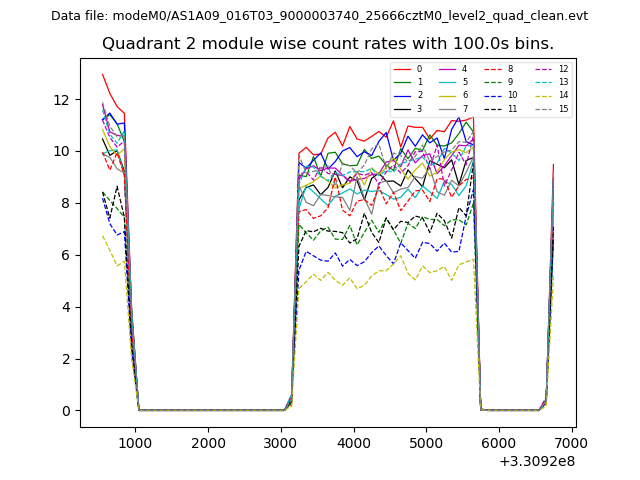 |
 |
| Module-wise count rates for Quadrant D Data is divided into 100 sec bins |
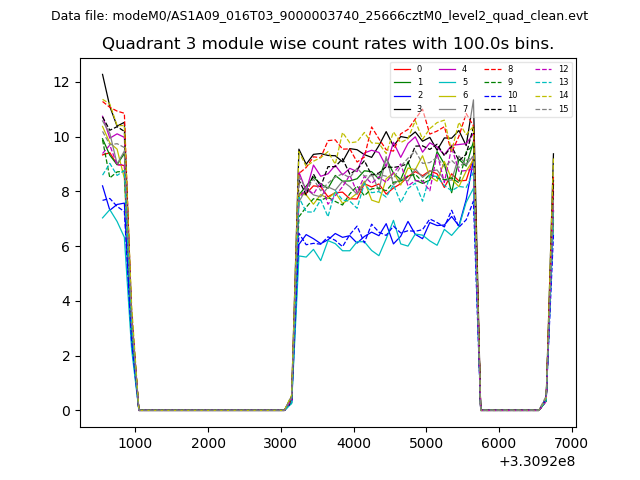 |
 |
| Parameter | Plot |
|---|---|
| CZT HV Monitor | 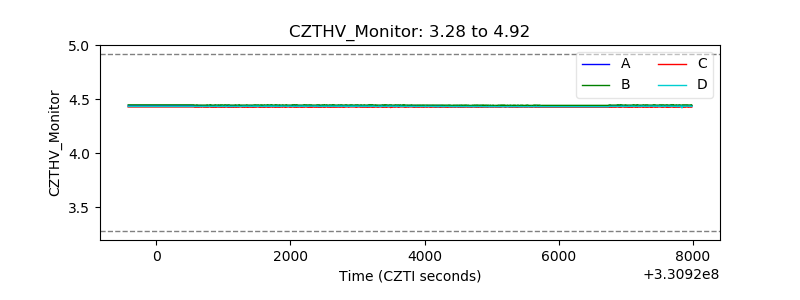 |
| D_VDD | 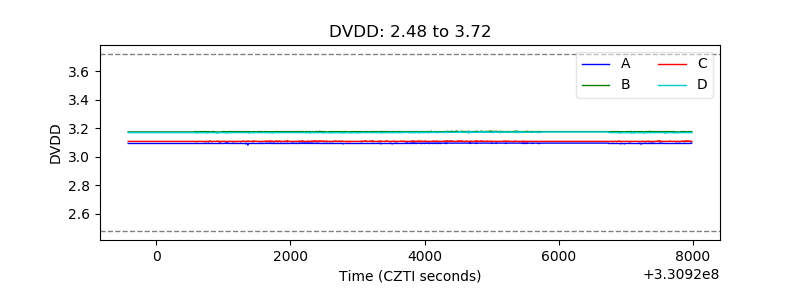 |
| Temperature 1 | 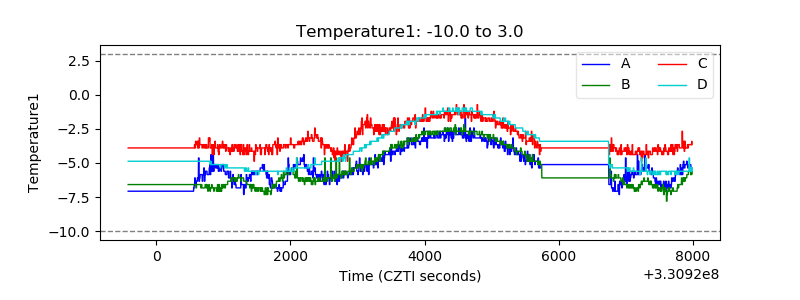 |
| Veto HV Monitor | 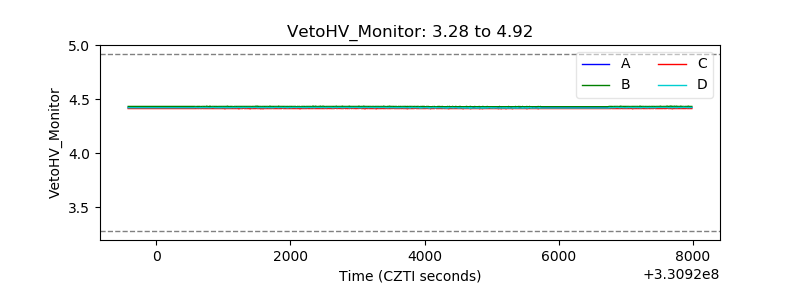 |
| Veto LLD | 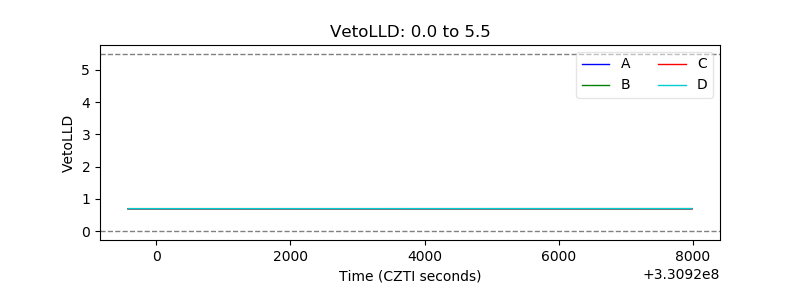 |
| Alpha Counter | 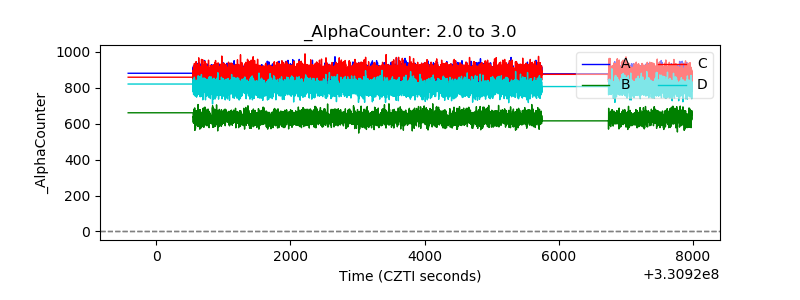 |
| _CPM_Rate | 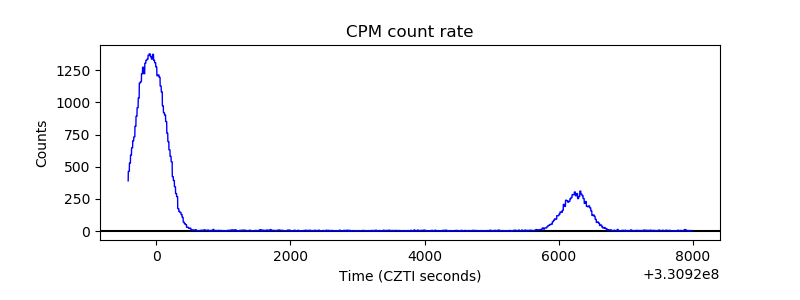 |
| CZT Counter | 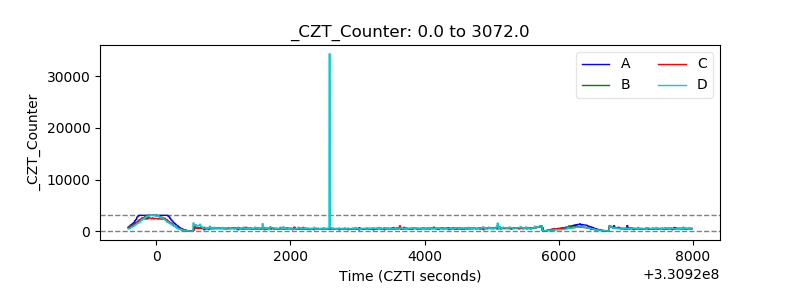 |
| +2.5 Volts monitor |  |
| +5 Volts monitor |  |
| _ROLL_ROT | 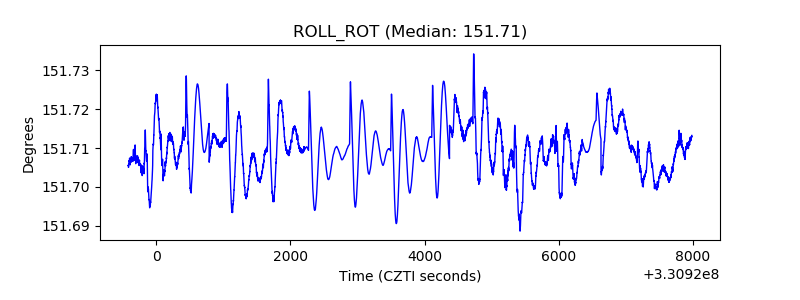 |
| _Roll_DEC | 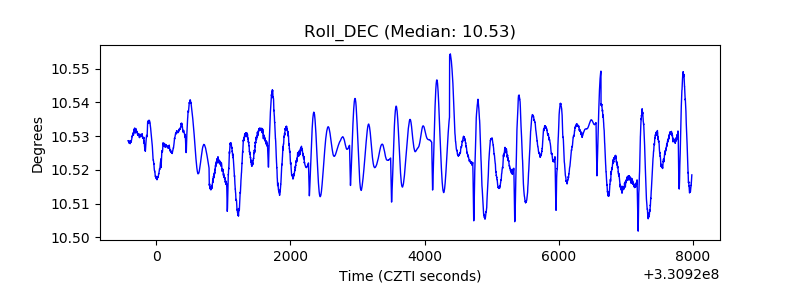 |
| _Roll_RA | 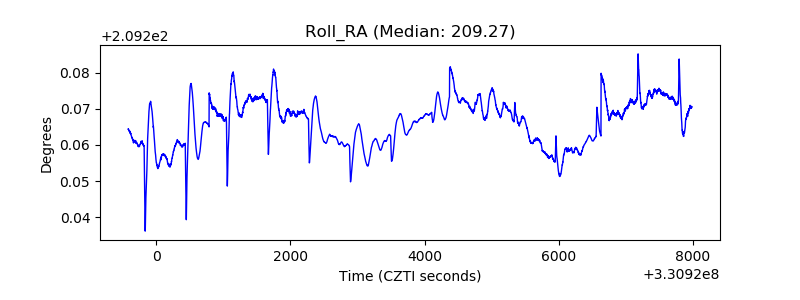 |
| Veto Counter | 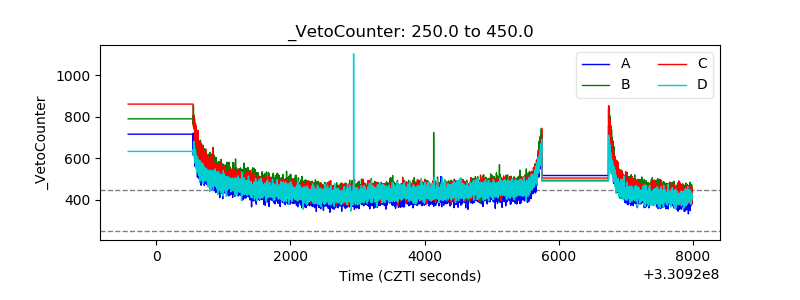 |