| Param | Original file | Final file |
|---|---|---|
| Filename | modeM0/AS1A09_016T03_9000003740_25667cztM0_level2.evt | modeM0/AS1A09_016T03_9000003740_25667cztM0_level2_quad_clean.evt |
| Size (bytes) | 544,752,000 | 84,948,480 |
| Size | 519.5 MB | 81.0 MB |
| Events in quadrant A | 4,007,771 | 523,526 |
| Events in quadrant B | 3,888,321 | 531,209 |
| Events in quadrant C | 3,803,202 | 500,750 |
| Events in quadrant D | 4,284,469 | 489,854 |
| Mode M0 | |||
|---|---|---|---|
| Quadrant | BADHDUFLAG | Total packets | Discarded packets |
| A | 0 | 16207 | 0 |
| B | 0 | 15995 | 0 |
| C | 0 | 15844 | 0 |
| D | 0 | 17489 | 0 |
| Mode M9 | |||
|---|---|---|---|
| Quadrant | BADHDUFLAG | Total packets | Discarded packets |
| A | 0 | 15 | 0 |
| B | 0 | 15 | 0 |
| C | 0 | 15 | 0 |
| D | 0 | 15 | 0 |
| Quadrant | Total seconds | Saturated seconds | Saturation percentage |
|---|---|---|---|
| A | 7567 | 147 | 1.942646% |
| B | 7567 | 186 | 2.458041% |
| C | 7568 | 155 | 2.048097% |
| D | 7568 | 93 | 1.228858% |
Noise dominated data is calculated using 1-second bins in cleaned event files. If a bin has >2000 counts, and if more than 50% of those come from <1% of pixels, then it is considered to be noise-dominated and hence unusable.
| Quadrant | # 1 sec bins | Bins with >0 counts | Bins with >2000 counts | High rate bins dominated by noise | Noise dominated (total time) | Noise dominated (detector-on time) | Marked lightcurve |
|---|---|---|---|---|---|---|---|
| A | 9112 | 7568 | 0 | 0 | 0.00% | 0.00% | 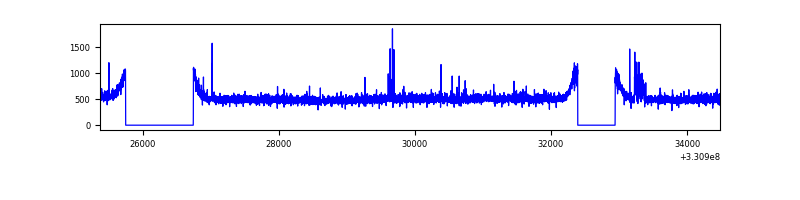 |
| B | 9112 | 7568 | 1 | 1 | 0.01% | 0.01% | 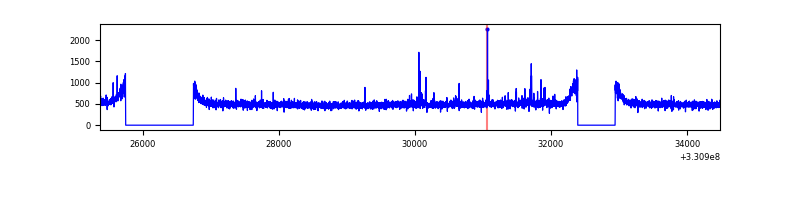 |
| C | 9113 | 7570 | 0 | 0 | 0.00% | 0.00% | 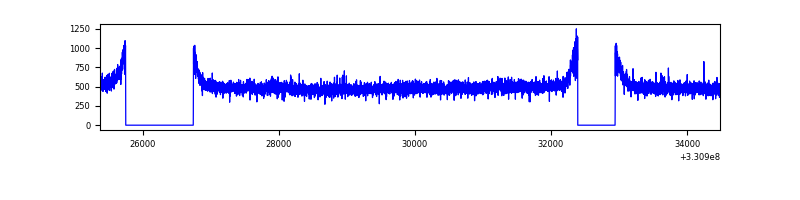 |
| D | 9113 | 7570 | 4 | 4 | 0.04% | 0.05% | 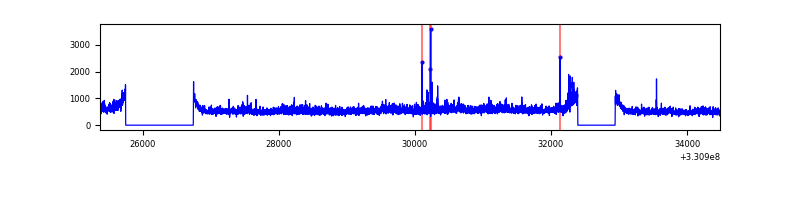 |
Top three noisy pixels from each quadrant. If the there are fewer than three noisy pixels in the level2.evt file, extra rows are filled as -1
| Pixel properties | Quadrant properties | ||||||
|---|---|---|---|---|---|---|---|
| Quadrant | DetID | PixID | Counts | Sigma | Mean | Median | Sigma |
| A | 8 | 192 | 177551 | 890.65 | 978 | 957 | 198.3 |
| A | 4 | 2 | 33179 | 162.51 | 978 | 957 | 198.3 |
| A | 12 | 96 | 16869 | 80.25 | 978 | 957 | 198.3 |
| B | 0 | 245 | 43504 | 225.16 | 975 | 949 | 189.0 |
| B | 12 | 111 | 23828 | 121.05 | 975 | 949 | 189.0 |
| B | 11 | 111 | 21499 | 108.73 | 975 | 949 | 189.0 |
| C | 14 | 238 | 149239 | 670.25 | 933 | 938 | 221.3 |
| C | 3 | 233 | 17876 | 76.55 | 933 | 938 | 221.3 |
| C | 13 | 61 | 6297 | 24.22 | 933 | 938 | 221.3 |
| D | 8 | 195 | 613791 | 2664.8 | 940 | 913 | 230.0 |
| D | 1 | 52 | 77077 | 331.16 | 940 | 913 | 230.0 |
| D | 13 | 104 | 33772 | 142.87 | 940 | 913 | 230.0 |
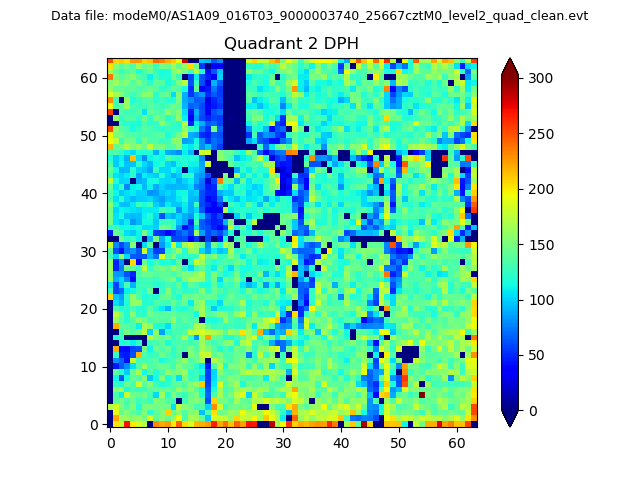
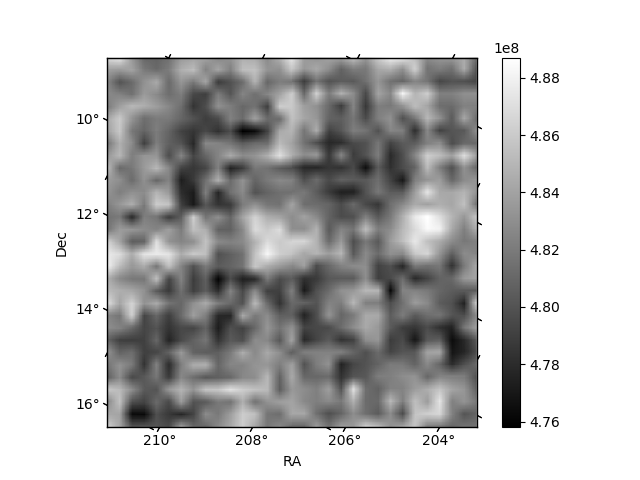
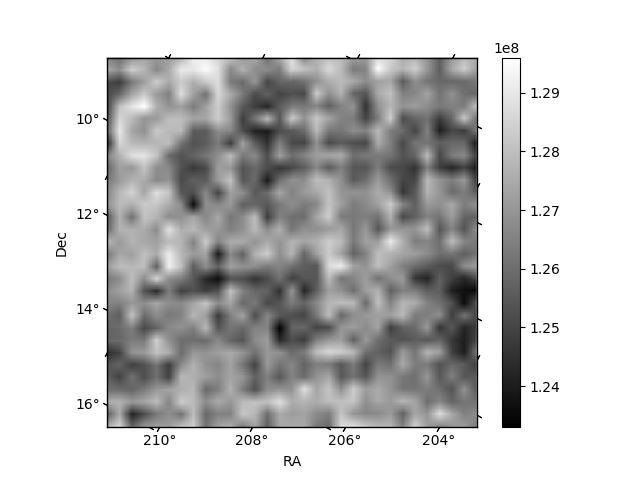
Histogram calculated using DETX and DETY for each event in the final _common_clean file
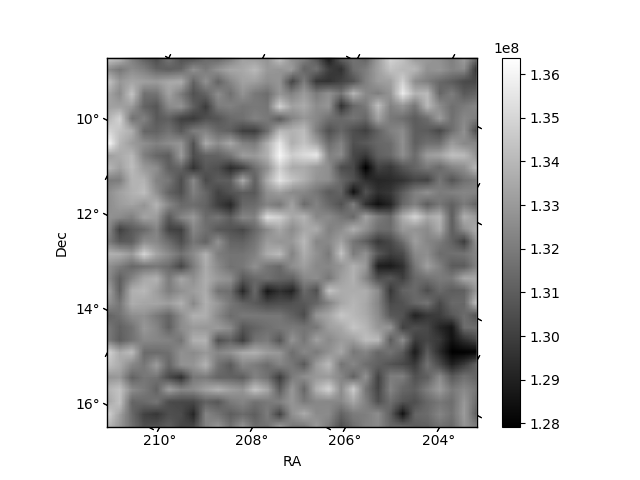
| Quadrant A | 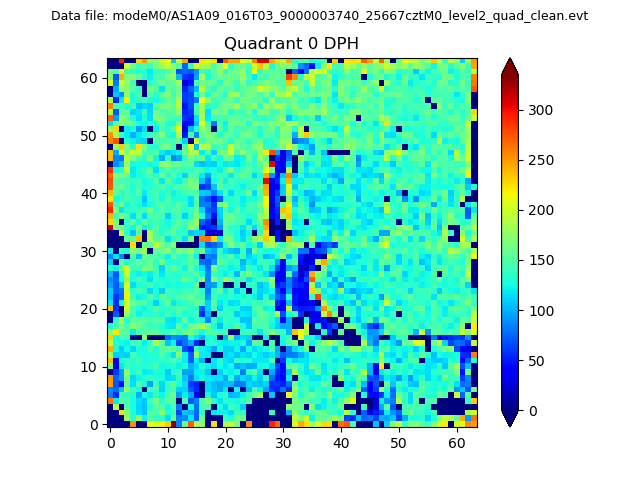 |
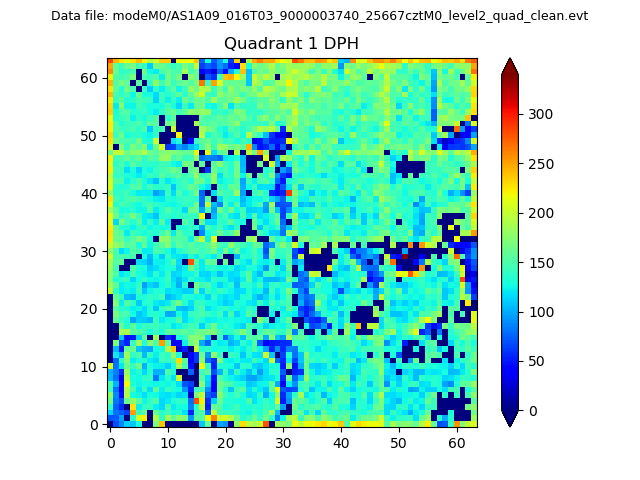 |
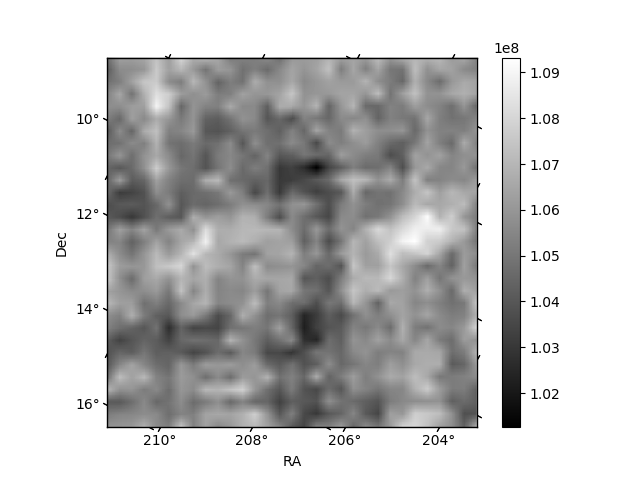
Quadrant B |
|---|---|---|---|
| Quadrant D | 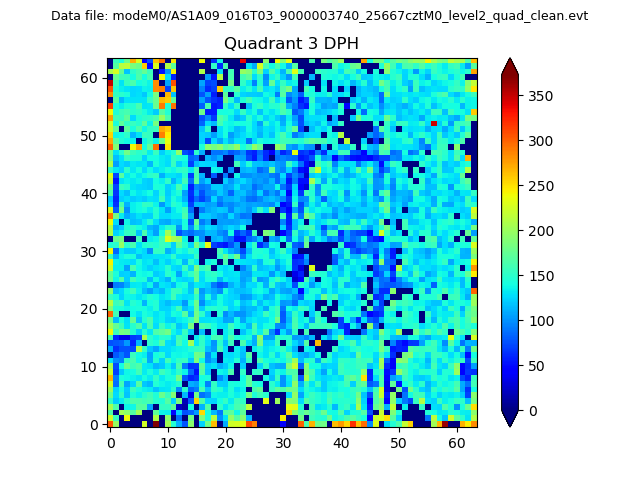 |
 |
Quadrant C |
| Plot type | Count rate plots | Images |
|---|---|---|
| Comparison with Poisson distribution Blue bars denote a histogram of data divided into 1 sec bins. Red curve is a Poisson curve with rate = median count rate of data. |
 |
 |
| Quadrant-wise count rates Data is divided into 100 sec bins |
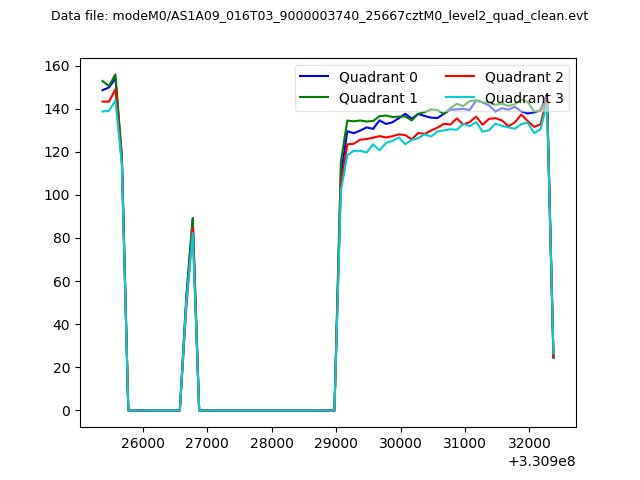 |
|
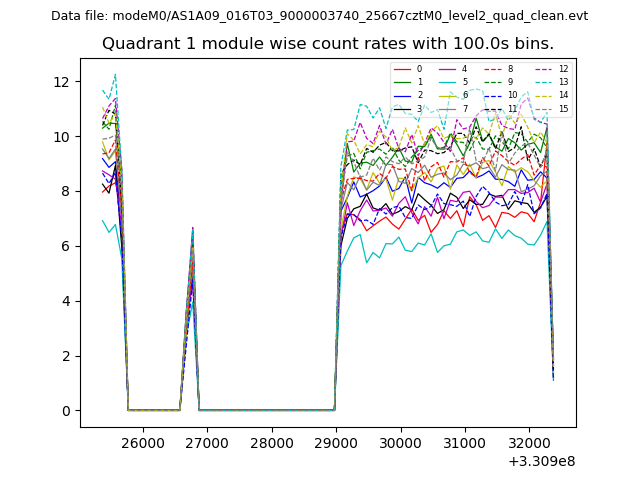
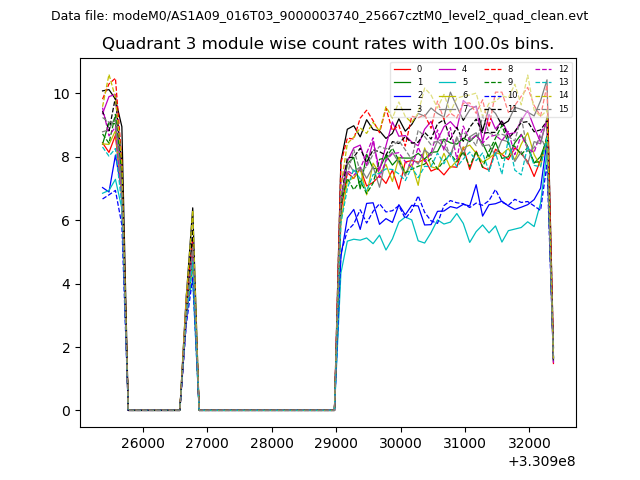
| Module-wise count rates for Quadrant A Data is divided into 100 sec bins |
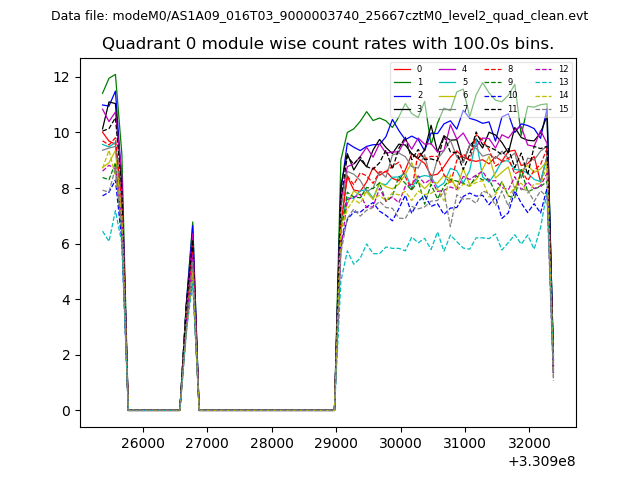 |
 |
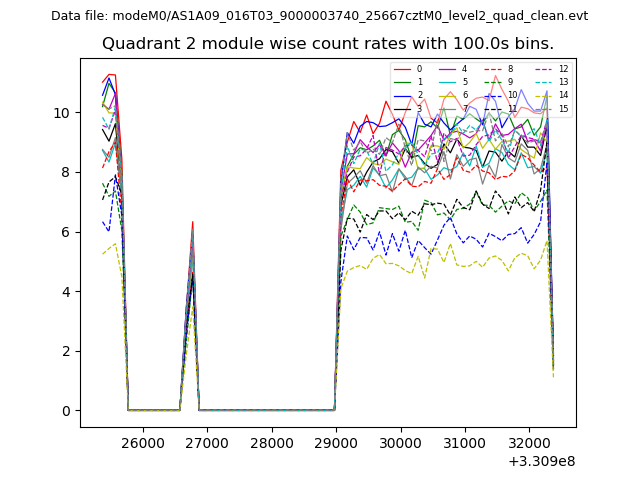
| Module-wise count rates for Quadrant B Data is divided into 100 sec bins |
 |
 |
| Module-wise count rates for Quadrant C Data is divided into 100 sec bins |
 |
 |
| Module-wise count rates for Quadrant D Data is divided into 100 sec bins |
 |
 |
| Parameter | Plot |
|---|---|
| CZT HV Monitor | 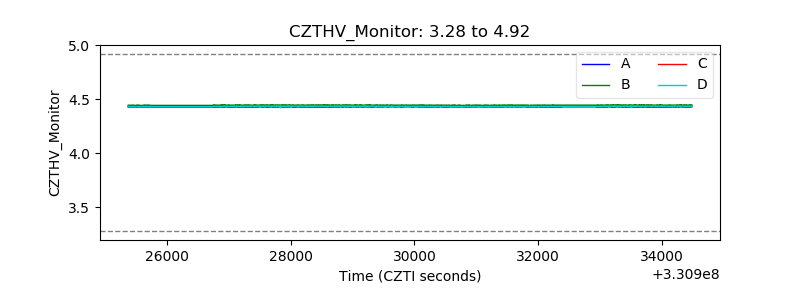 |
| D_VDD | 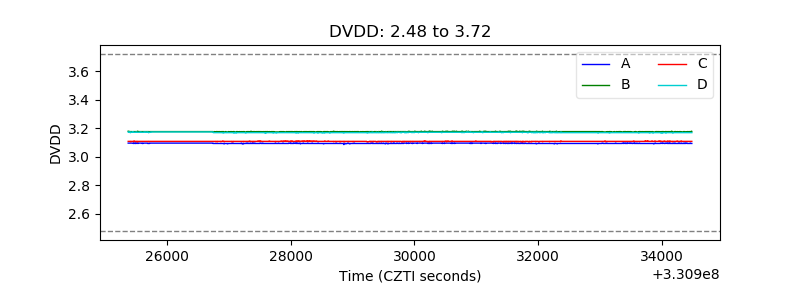 |
| Temperature 1 | 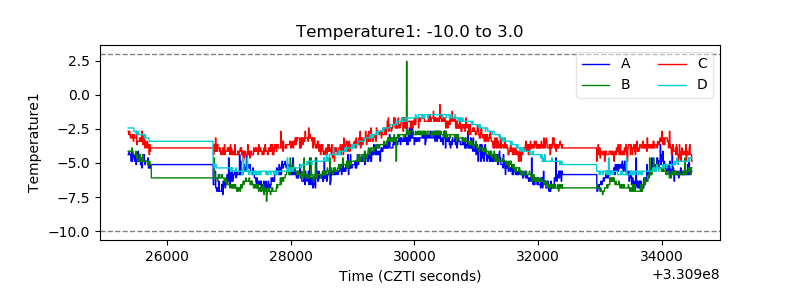 |
| Veto HV Monitor | 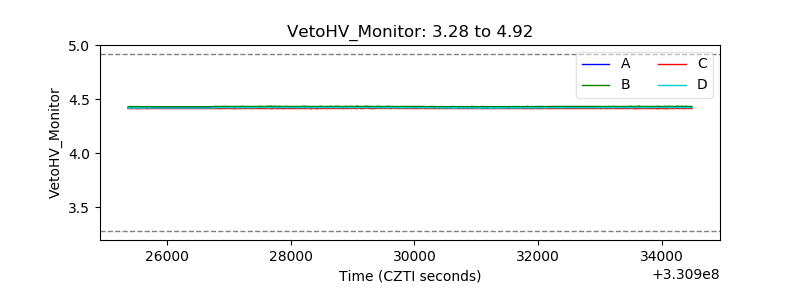 |
| Veto LLD | 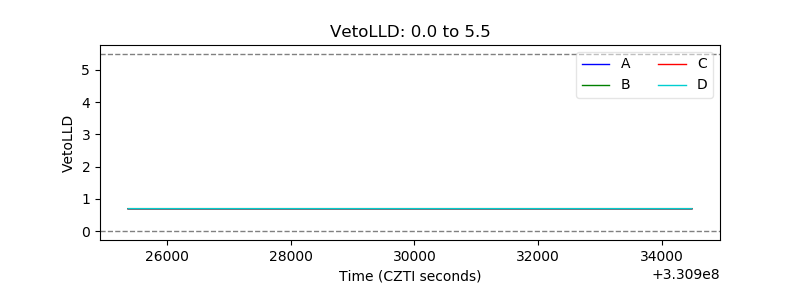 |
| Alpha Counter | 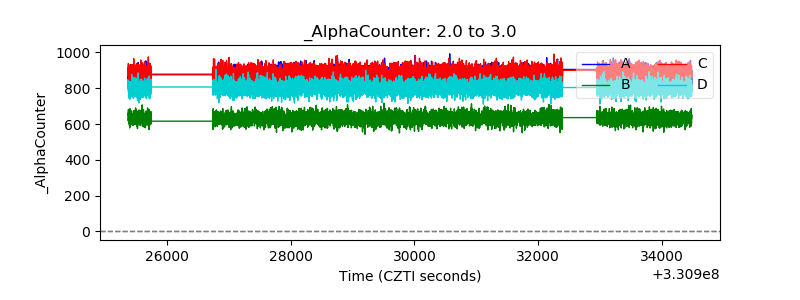 |
| _CPM_Rate | 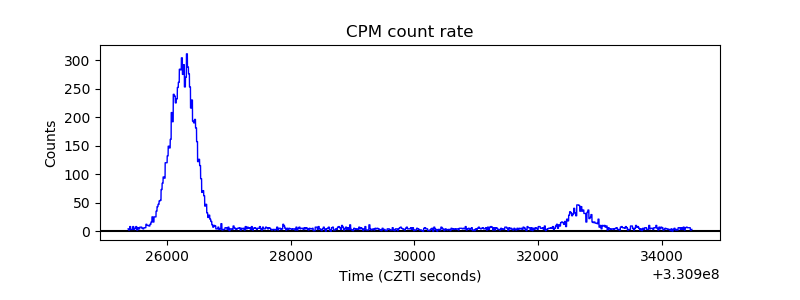 |
| CZT Counter | 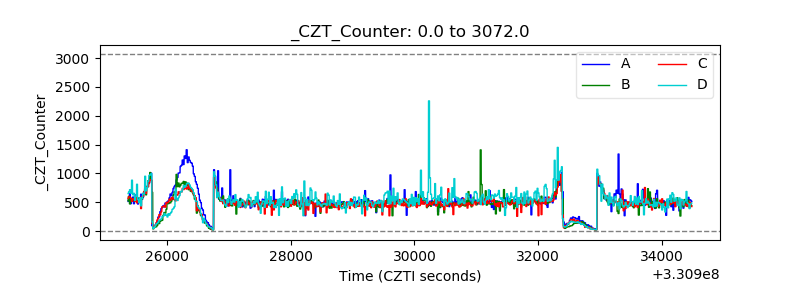 |
| +2.5 Volts monitor |  |
| +5 Volts monitor | 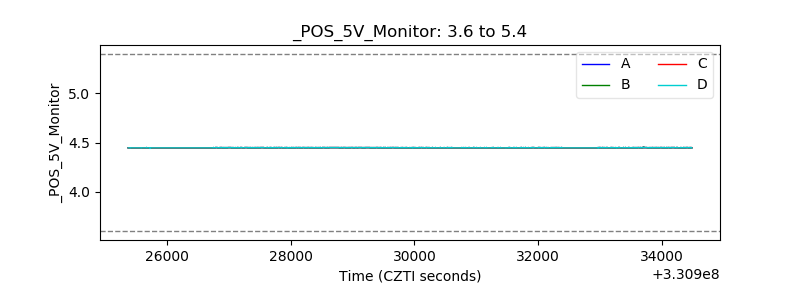 |
| _ROLL_ROT | 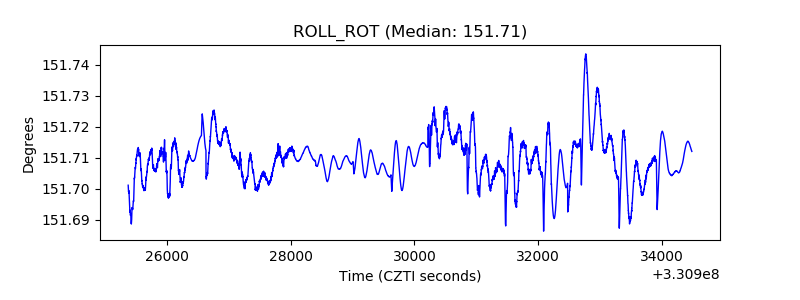 |
| _Roll_DEC |  |
| _Roll_RA | 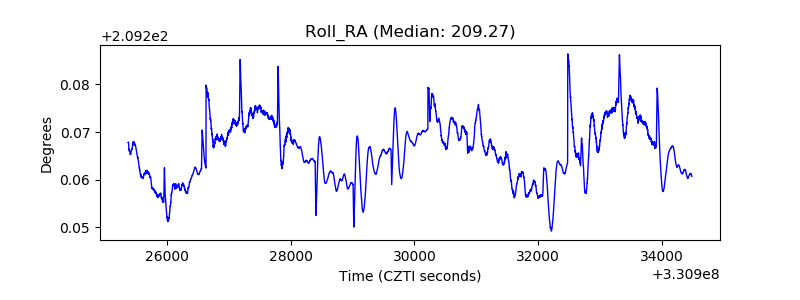 |
| Veto Counter | 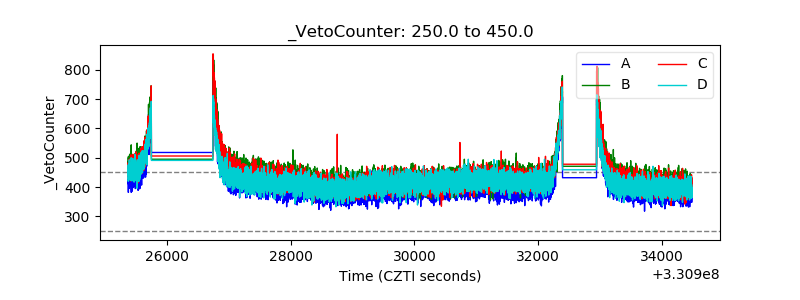 |