| Param | Original file | Final file |
|---|---|---|
| Filename | modeM0/AS1A09_016T03_9000003740_25668cztM0_level2.evt | modeM0/AS1A09_016T03_9000003740_25668cztM0_level2_quad_clean.evt |
| Size (bytes) | 618,379,200 | 95,610,240 |
| Size | 589.7 MB | 91.2 MB |
| Events in quadrant A | 4,538,324 | 587,757 |
| Events in quadrant B | 4,411,921 | 594,153 |
| Events in quadrant C | 4,337,464 | 563,098 |
| Events in quadrant D | 4,855,674 | 552,410 |
| Mode M0 | |||
|---|---|---|---|
| Quadrant | BADHDUFLAG | Total packets | Discarded packets |
| A | 0 | 18412 | 0 |
| B | 0 | 18304 | 0 |
| C | 0 | 18139 | 0 |
| D | 0 | 19662 | 0 |
| Mode M9 | |||
|---|---|---|---|
| Quadrant | BADHDUFLAG | Total packets | Discarded packets |
| A | 0 | 6 | 0 |
| B | 0 | 6 | 0 |
| C | 0 | 6 | 0 |
| D | 0 | 6 | 0 |
| Quadrant | Total seconds | Saturated seconds | Saturation percentage |
|---|---|---|---|
| A | 8610 | 419 | 4.866434% |
| B | 8610 | 451 | 5.238095% |
| C | 8610 | 412 | 4.785134% |
| D | 8611 | 331 | 3.843921% |
Noise dominated data is calculated using 1-second bins in cleaned event files. If a bin has >2000 counts, and if more than 50% of those come from <1% of pixels, then it is considered to be noise-dominated and hence unusable.
| Quadrant | # 1 sec bins | Bins with >0 counts | Bins with >2000 counts | High rate bins dominated by noise | Noise dominated (total time) | Noise dominated (detector-on time) | Marked lightcurve |
|---|---|---|---|---|---|---|---|
| A | 9200 | 8611 | 0 | 0 | 0.00% | 0.00% | 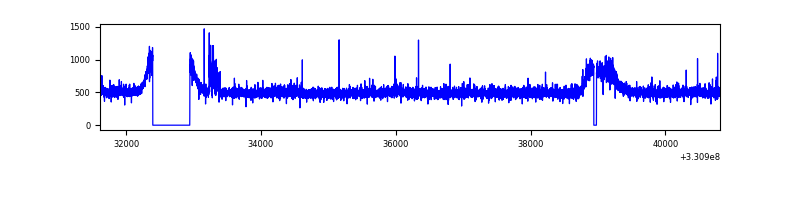 |
| B | 9200 | 8610 | 1 | 1 | 0.01% | 0.01% | 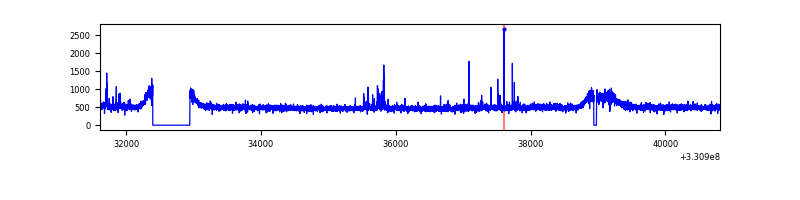 |
| C | 9200 | 8612 | 0 | 0 | 0.00% | 0.00% | 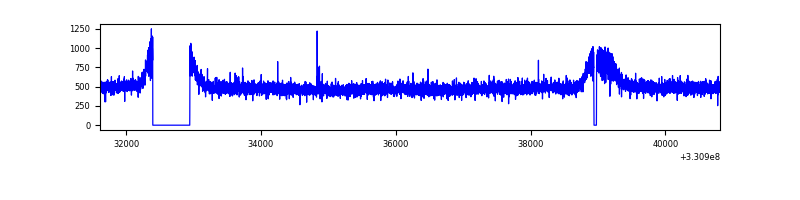 |
| D | 9201 | 8613 | 7 | 7 | 0.08% | 0.08% | 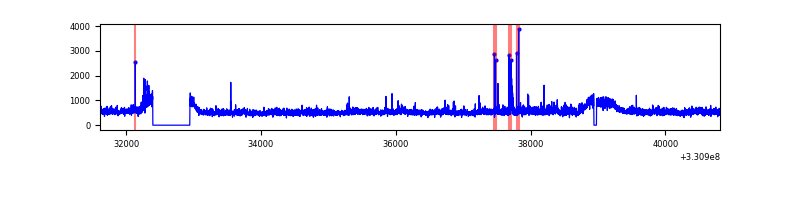 |
Top three noisy pixels from each quadrant. If the there are fewer than three noisy pixels in the level2.evt file, extra rows are filled as -1
| Pixel properties | Quadrant properties | ||||||
|---|---|---|---|---|---|---|---|
| Quadrant | DetID | PixID | Counts | Sigma | Mean | Median | Sigma |
| A | 8 | 192 | 194441 | 853.28 | 1114 | 1089 | 226.6 |
| A | 4 | 2 | 33341 | 142.33 | 1114 | 1089 | 226.6 |
| A | 13 | 254 | 11611 | 46.43 | 1114 | 1089 | 226.6 |
| B | 0 | 245 | 46256 | 209.88 | 1107 | 1079 | 215.3 |
| B | 12 | 111 | 27467 | 122.59 | 1107 | 1079 | 215.3 |
| B | 11 | 111 | 25092 | 111.56 | 1107 | 1079 | 215.3 |
| C | 14 | 238 | 166886 | 655.26 | 1063 | 1065 | 253.1 |
| C | 3 | 233 | 21238 | 79.72 | 1063 | 1065 | 253.1 |
| C | 13 | 61 | 7199 | 24.24 | 1063 | 1065 | 253.1 |
| D | 8 | 195 | 562521 | 2133.95 | 1080 | 1045 | 263.1 |
| D | 1 | 52 | 183857 | 694.8 | 1080 | 1045 | 263.1 |
| D | 2 | 234 | 36492 | 134.72 | 1080 | 1045 | 263.1 |
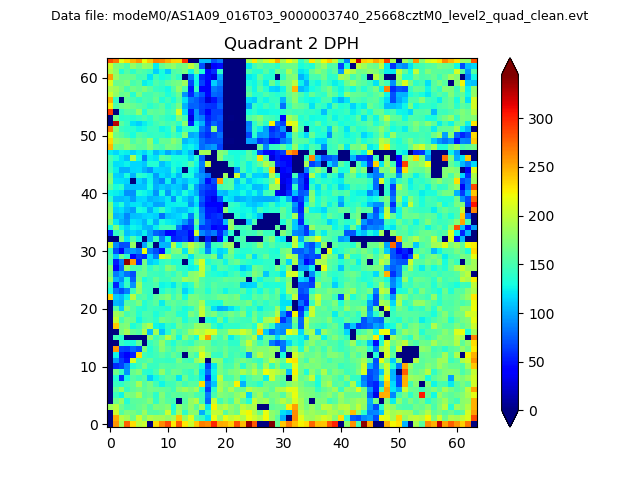
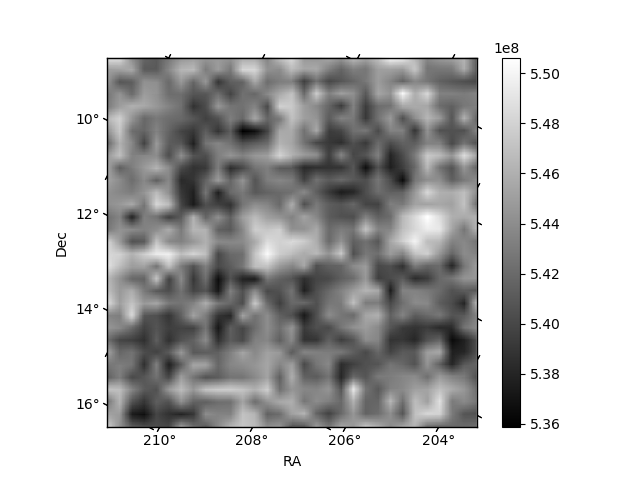
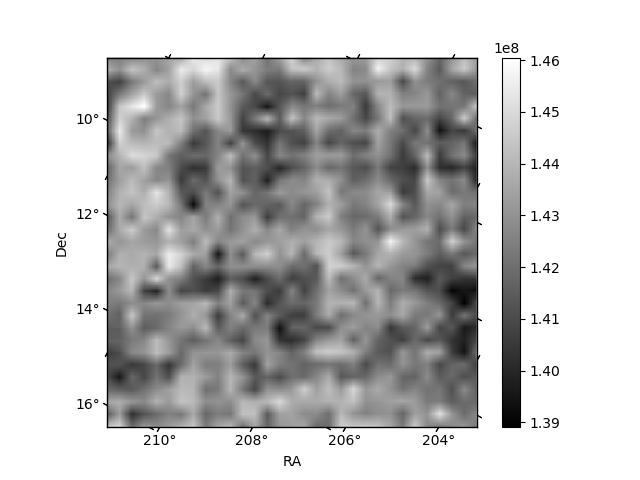
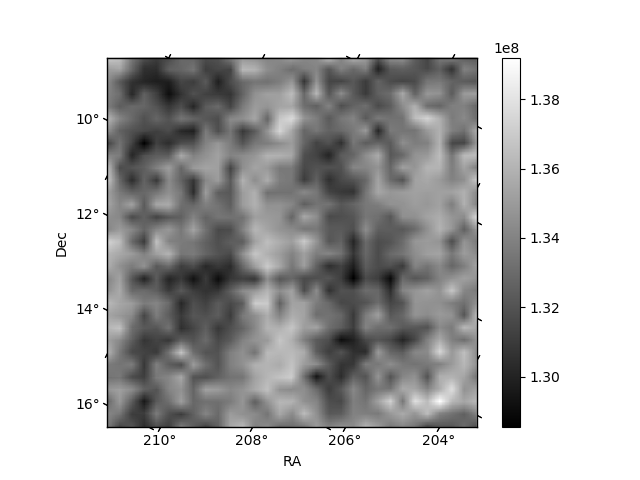
Histogram calculated using DETX and DETY for each event in the final _common_clean file
| Quadrant A | 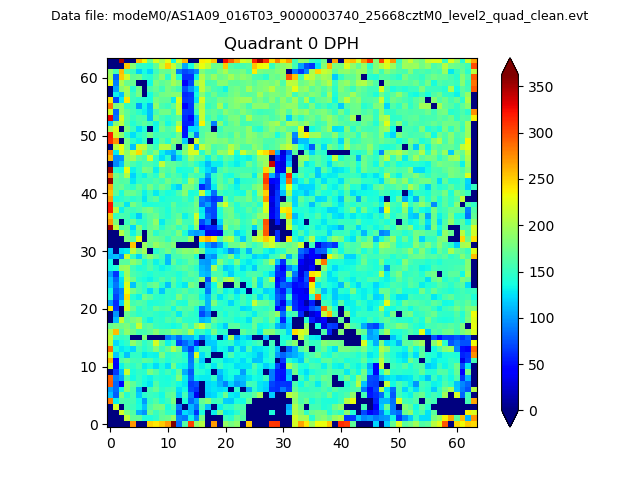 |
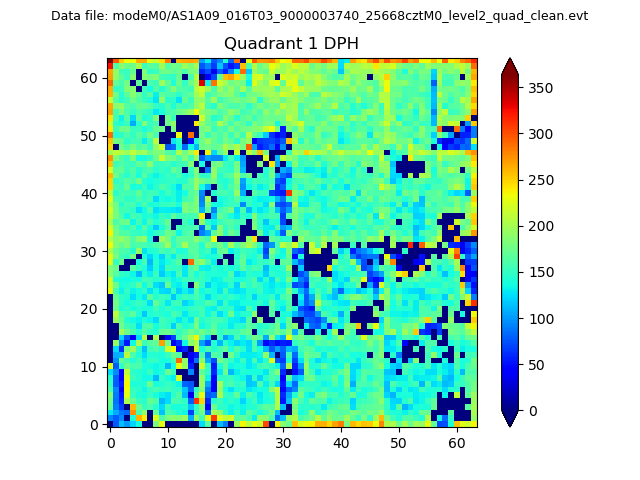 |
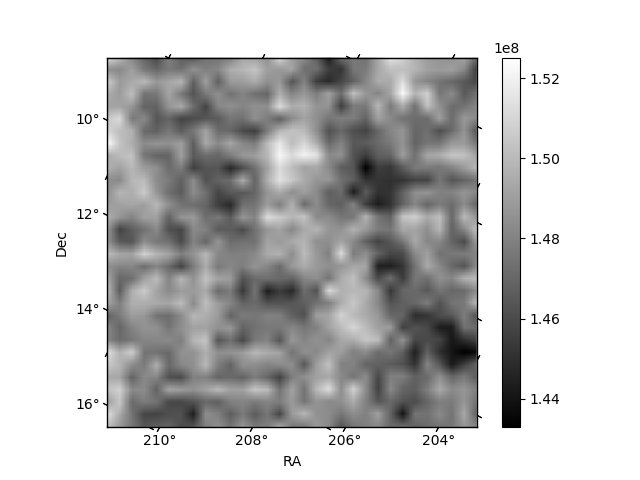
Quadrant B |
|---|---|---|---|
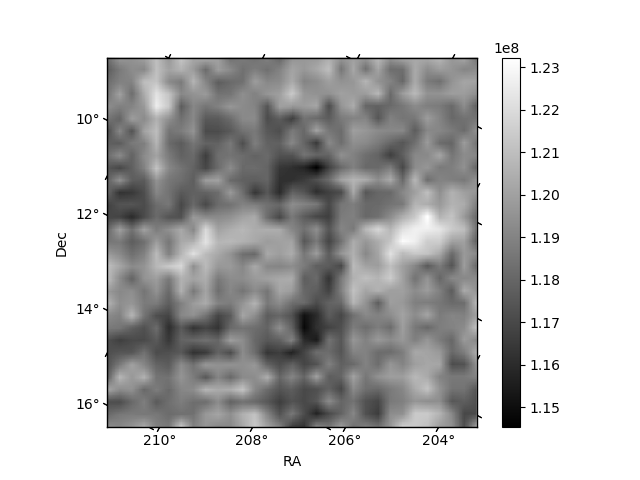
| Quadrant D | 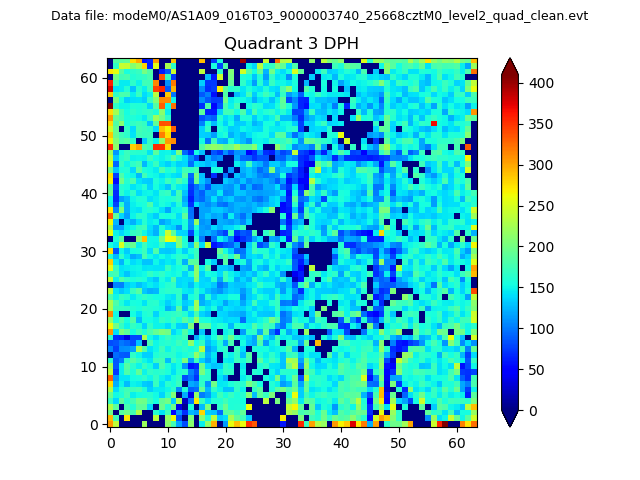 |
 |
Quadrant C |
| Plot type | Count rate plots | Images |
|---|---|---|
| Comparison with Poisson distribution Blue bars denote a histogram of data divided into 1 sec bins. Red curve is a Poisson curve with rate = median count rate of data. |
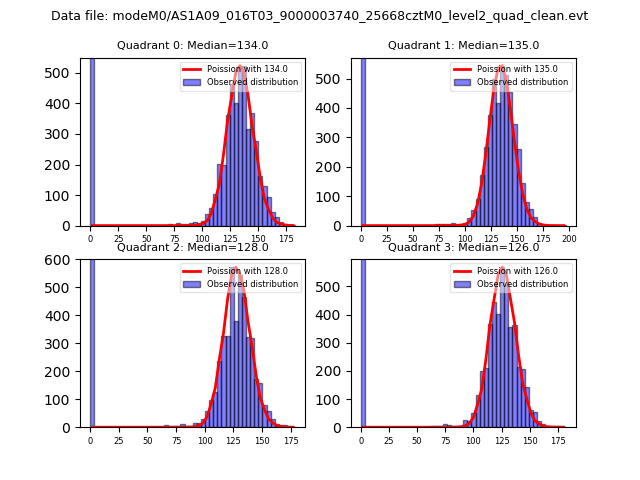 |
 |
| Quadrant-wise count rates Data is divided into 100 sec bins |
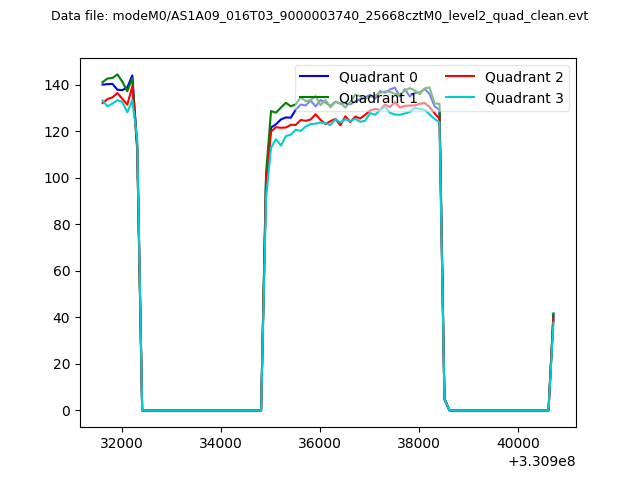 |
|
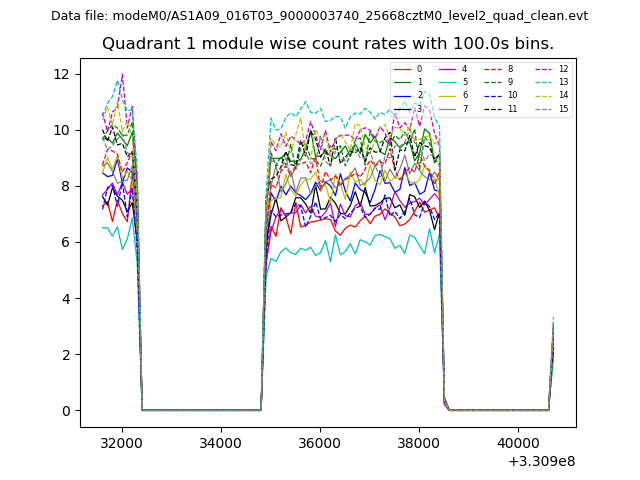
| Module-wise count rates for Quadrant A Data is divided into 100 sec bins |
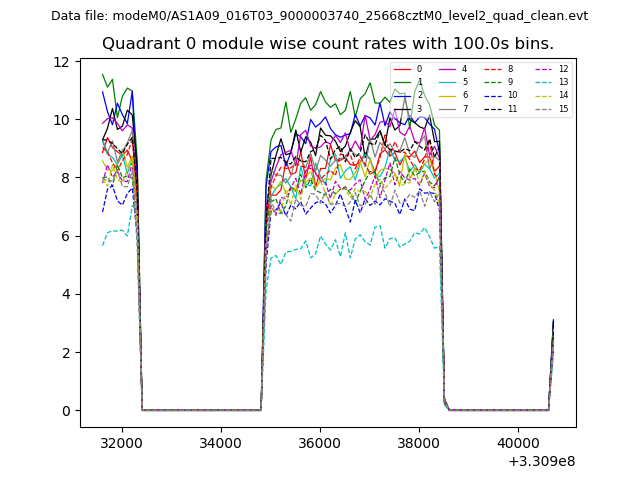 |
 |
| Module-wise count rates for Quadrant B Data is divided into 100 sec bins |
 |
 |
| Module-wise count rates for Quadrant C Data is divided into 100 sec bins |
 |
 |
| Module-wise count rates for Quadrant D Data is divided into 100 sec bins |
 |
 |
| Parameter | Plot |
|---|---|
| CZT HV Monitor |  |
| D_VDD | 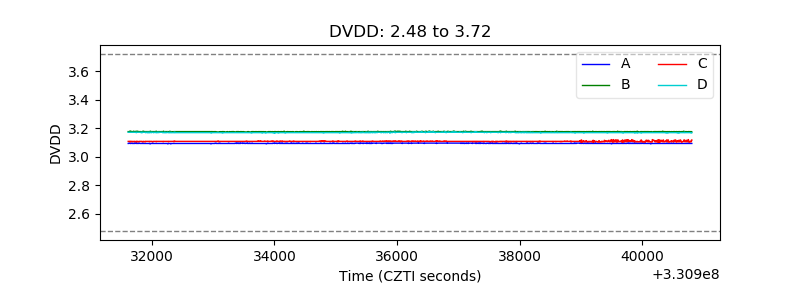 |
| Temperature 1 | 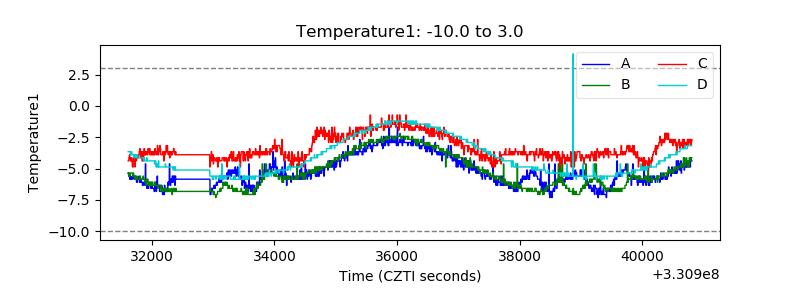 |
| Veto HV Monitor | 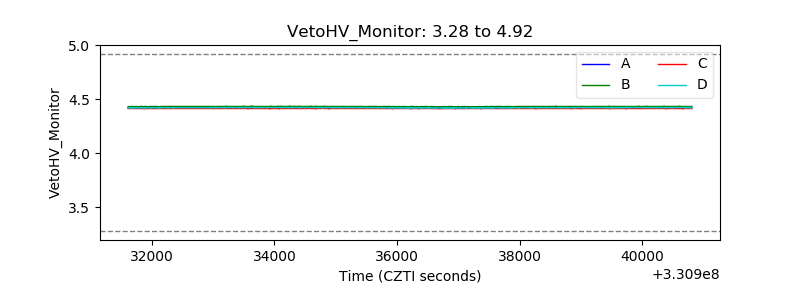 |
| Veto LLD | 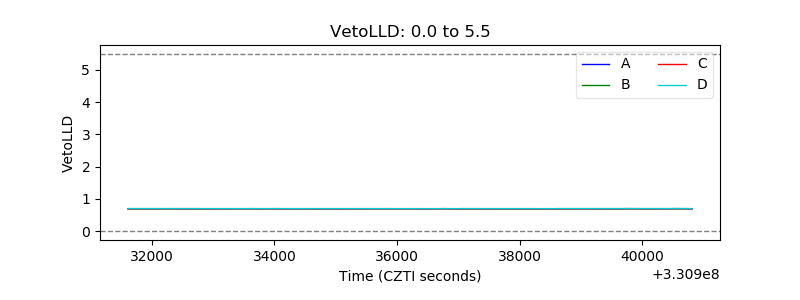 |
| Alpha Counter | 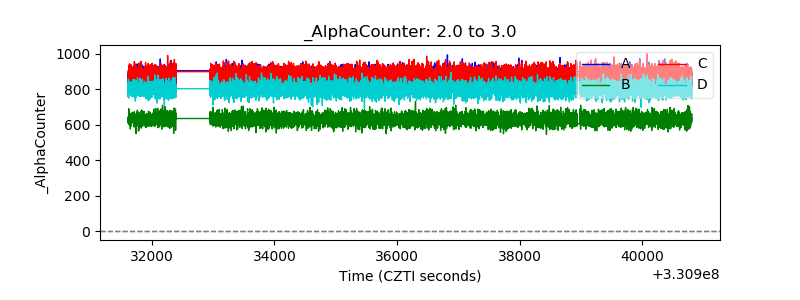 |
| _CPM_Rate | 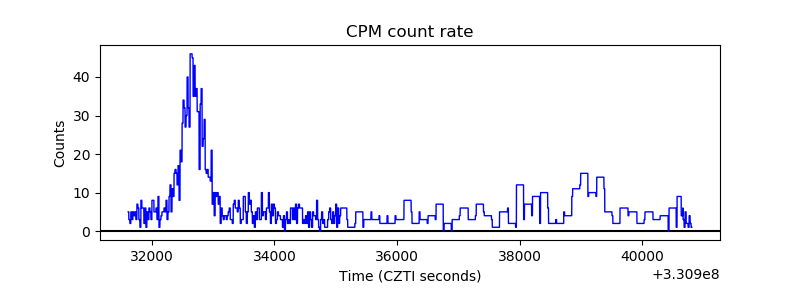 |
| CZT Counter | 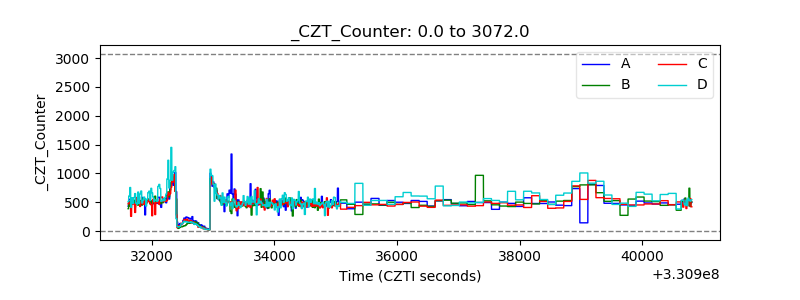 |
| +2.5 Volts monitor |  |
| +5 Volts monitor |  |
| _ROLL_ROT | 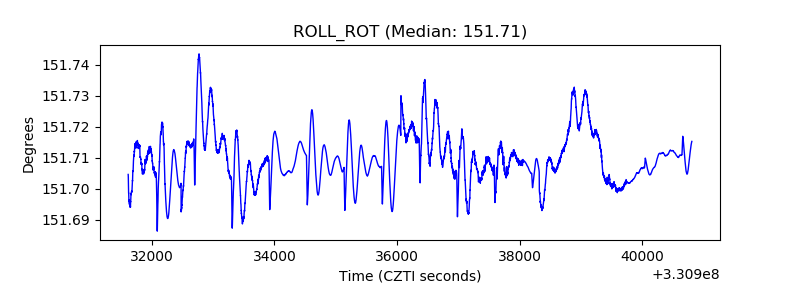 |
| _Roll_DEC | 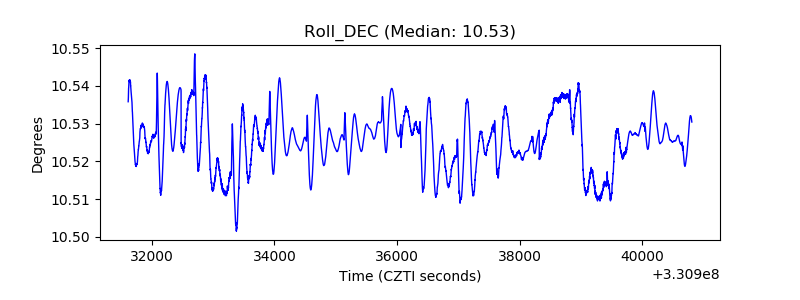 |
| _Roll_RA | 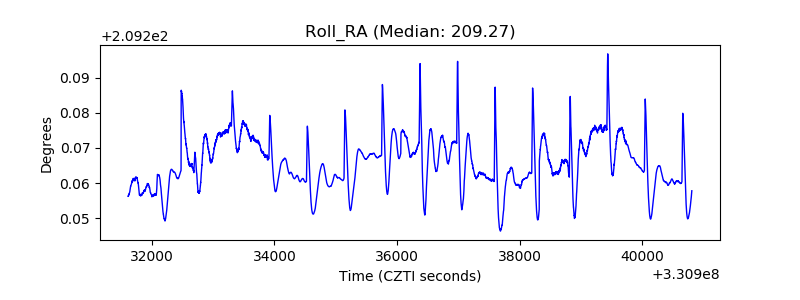 |
| Veto Counter |  |