| Param | Original file | Final file |
|---|---|---|
| Filename | modeM0/AS1A09_016T03_9000003740_25669cztM0_level2.evt | modeM0/AS1A09_016T03_9000003740_25669cztM0_level2_quad_clean.evt |
| Size (bytes) | 550,687,680 | 85,754,880 |
| Size | 525.2 MB | 81.8 MB |
| Events in quadrant A | 4,167,834 | 526,809 |
| Events in quadrant B | 3,798,290 | 536,950 |
| Events in quadrant C | 3,780,018 | 502,842 |
| Events in quadrant D | 4,408,275 | 494,214 |
| Mode M0 | |||
|---|---|---|---|
| Quadrant | BADHDUFLAG | Total packets | Discarded packets |
| A | 0 | 16895 | 0 |
| B | 0 | 15935 | 0 |
| C | 0 | 15918 | 0 |
| D | 0 | 17749 | 0 |
| Mode M9 | |||
|---|---|---|---|
| Quadrant | BADHDUFLAG | Total packets | Discarded packets |
| A | 0 | 1 | 0 |
| B | 0 | 1 | 0 |
| C | 0 | 1 | 0 |
| D | 0 | 1 | 0 |
| Quadrant | Total seconds | Saturated seconds | Saturation percentage |
|---|---|---|---|
| A | 7699 | 289 | 3.753734% |
| B | 7700 | 206 | 2.675325% |
| C | 7700 | 230 | 2.987013% |
| D | 7700 | 175 | 2.272727% |
Noise dominated data is calculated using 1-second bins in cleaned event files. If a bin has >2000 counts, and if more than 50% of those come from <1% of pixels, then it is considered to be noise-dominated and hence unusable.
| Quadrant | # 1 sec bins | Bins with >0 counts | Bins with >2000 counts | High rate bins dominated by noise | Noise dominated (total time) | Noise dominated (detector-on time) | Marked lightcurve |
|---|---|---|---|---|---|---|---|
| A | 7889 | 7699 | 52 | 52 | 0.66% | 0.68% | 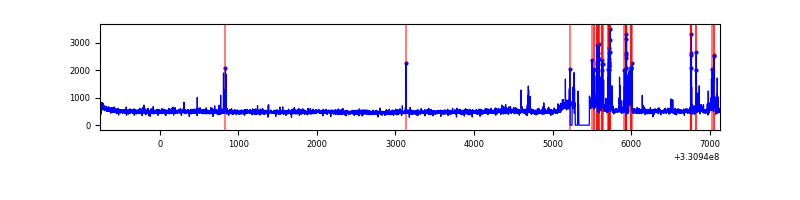 |
| B | 7890 | 7701 | 0 | 0 | 0.00% | 0.00% | 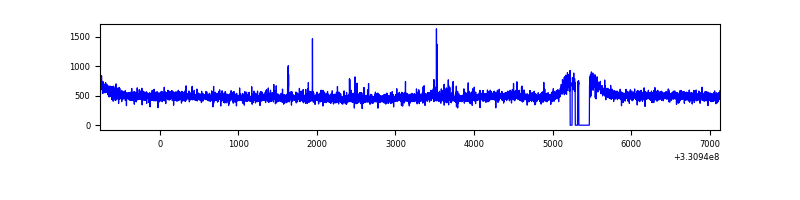 |
| C | 7890 | 7701 | 0 | 0 | 0.00% | 0.00% | 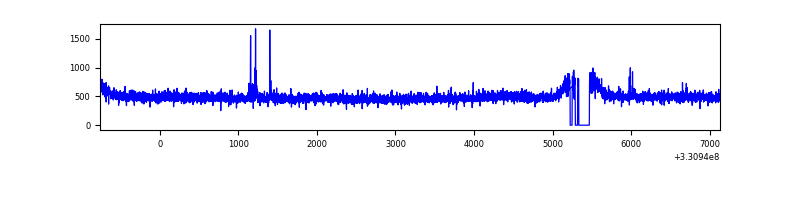 |
| D | 7890 | 7701 | 24 | 24 | 0.30% | 0.31% | 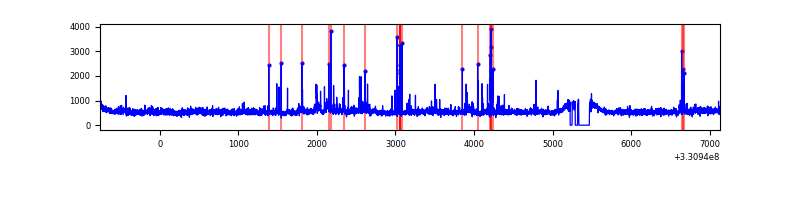 |
Top three noisy pixels from each quadrant. If the there are fewer than three noisy pixels in the level2.evt file, extra rows are filled as -1
| Pixel properties | Quadrant properties | ||||||
|---|---|---|---|---|---|---|---|
| Quadrant | DetID | PixID | Counts | Sigma | Mean | Median | Sigma |
| A | 12 | 96 | 333135 | 1718.47 | 954 | 932 | 193.3 |
| A | 8 | 192 | 155722 | 800.72 | 954 | 932 | 193.3 |
| A | 13 | 254 | 9853 | 46.15 | 954 | 932 | 193.3 |
| B | 0 | 245 | 27592 | 145.18 | 955 | 932 | 183.6 |
| B | 12 | 111 | 23497 | 122.88 | 955 | 932 | 183.6 |
| B | 11 | 111 | 21274 | 110.77 | 955 | 932 | 183.6 |
| C | 14 | 238 | 146591 | 678.98 | 915 | 922 | 214.5 |
| C | 2 | 16 | 30742 | 138.99 | 915 | 922 | 214.5 |
| C | 8 | 128 | 13504 | 58.65 | 915 | 922 | 214.5 |
| D | 8 | 195 | 559136 | 2460.34 | 927 | 897 | 226.9 |
| D | 1 | 52 | 202084 | 886.7 | 927 | 897 | 226.9 |
| D | 2 | 244 | 124279 | 543.78 | 927 | 897 | 226.9 |
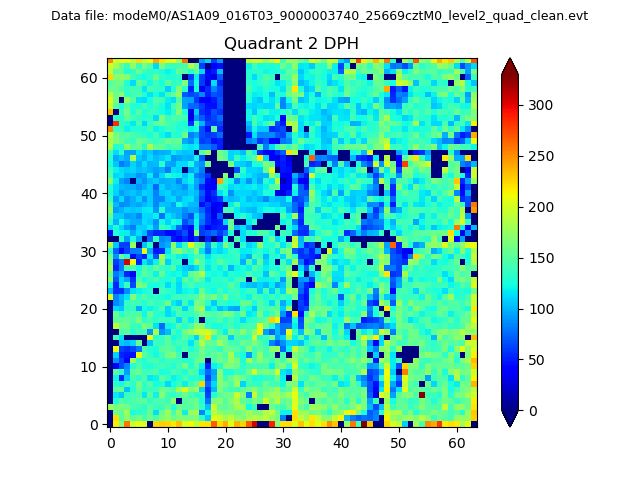
Histogram calculated using DETX and DETY for each event in the final _common_clean file
| Quadrant A | 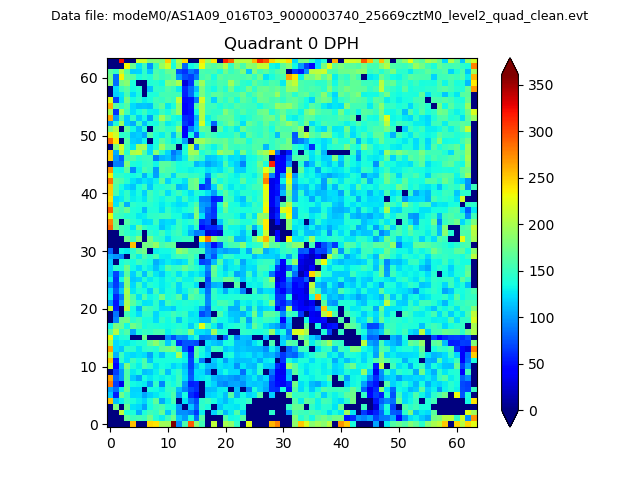 |
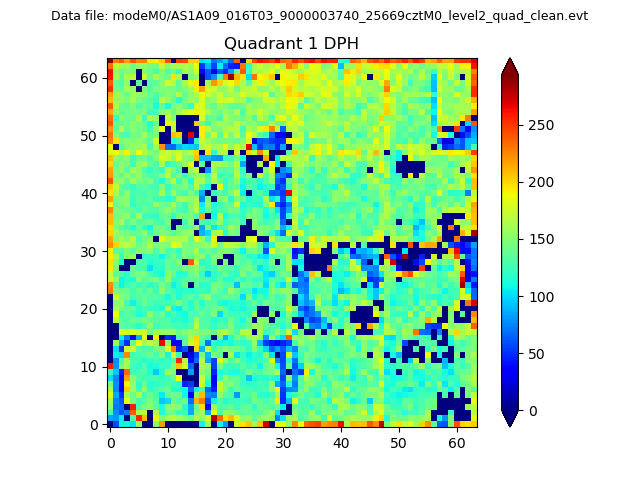 |
Quadrant B |
|---|---|---|---|
| Quadrant D | 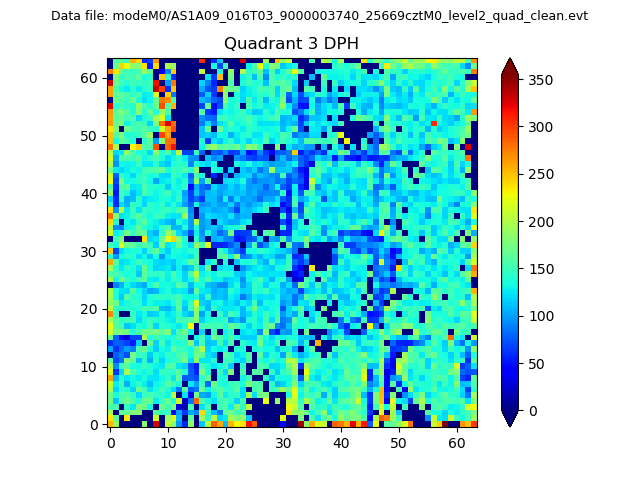 |
 |
Quadrant C |
| Plot type | Count rate plots | Images |
|---|---|---|
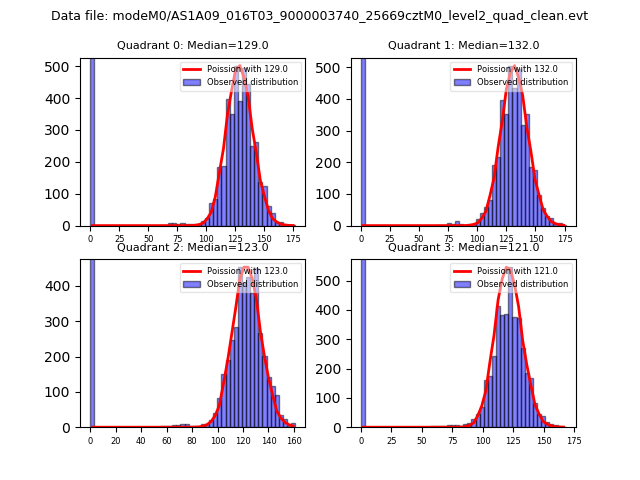
| Comparison with Poisson distribution Blue bars denote a histogram of data divided into 1 sec bins. Red curve is a Poisson curve with rate = median count rate of data. |
 |
 |
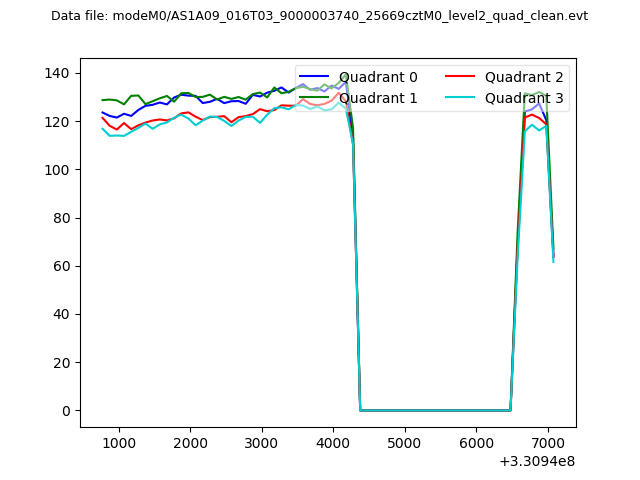
| Quadrant-wise count rates Data is divided into 100 sec bins |
 |
|
| Module-wise count rates for Quadrant A Data is divided into 100 sec bins |
 |
 |
| Module-wise count rates for Quadrant B Data is divided into 100 sec bins |
 |
 |
| Module-wise count rates for Quadrant C Data is divided into 100 sec bins |
 |
 |
| Module-wise count rates for Quadrant D Data is divided into 100 sec bins |
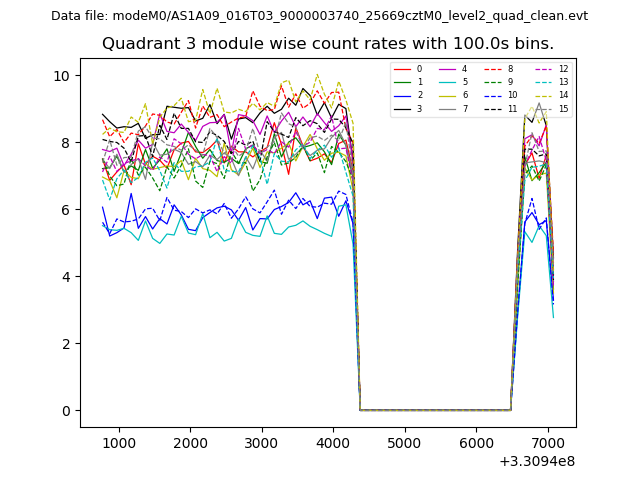 |
 |
| Parameter | Plot |
|---|---|
| CZT HV Monitor |  |
| D_VDD | 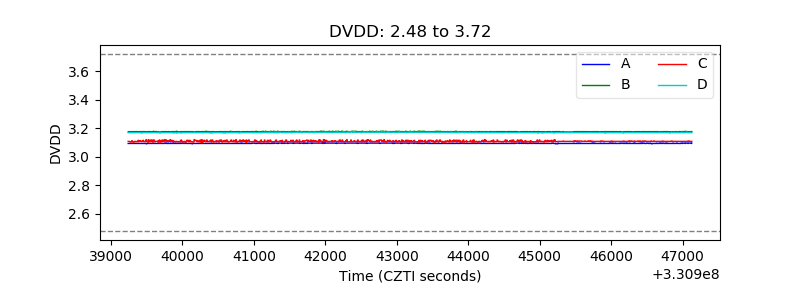 |
| Temperature 1 | 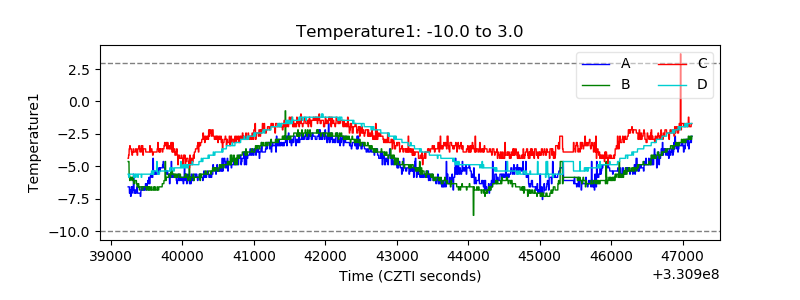 |
| Veto HV Monitor |  |
| Veto LLD | 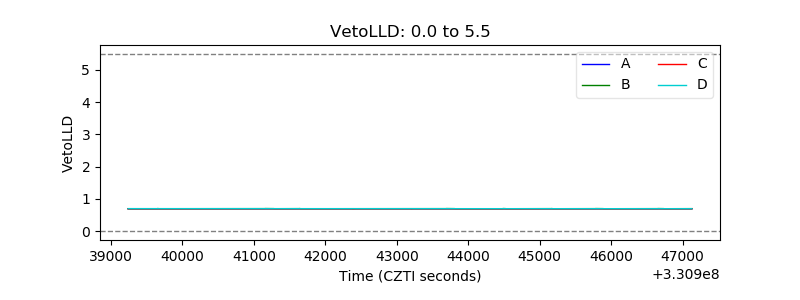 |
| Alpha Counter | 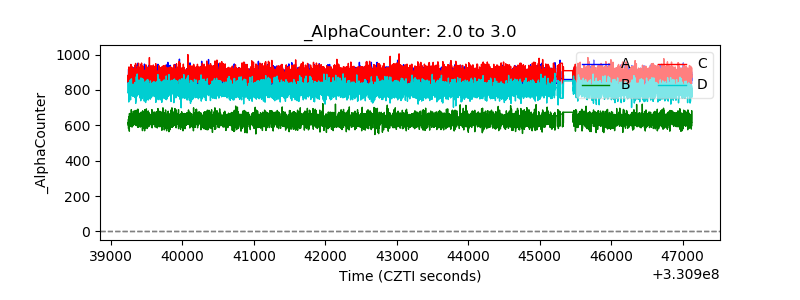 |
| _CPM_Rate | 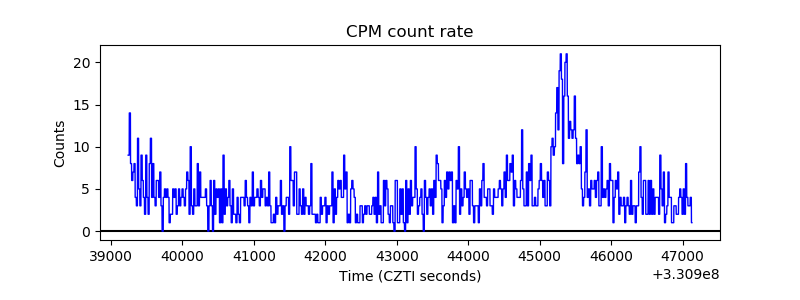 |
| CZT Counter | 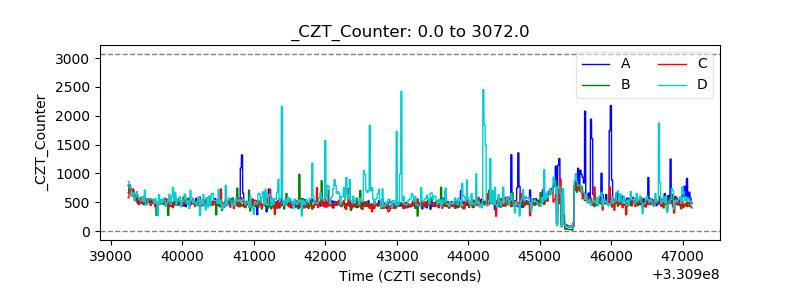 |
| +2.5 Volts monitor |  |
| +5 Volts monitor |  |
| _ROLL_ROT | 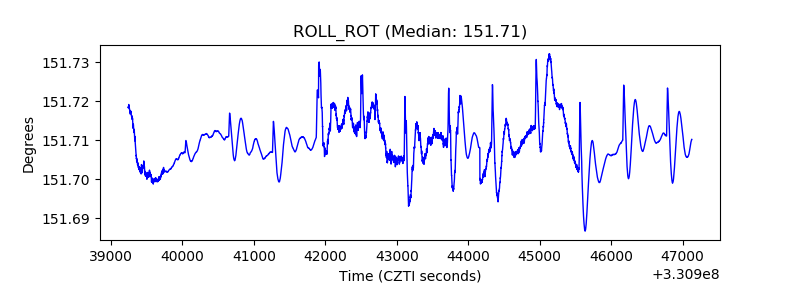 |
| _Roll_DEC | 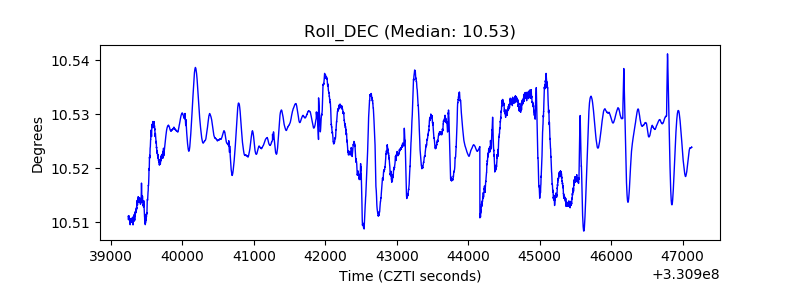 |
| _Roll_RA | 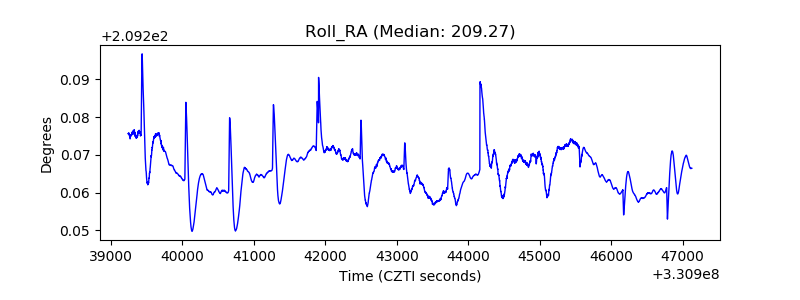 |
| Veto Counter | 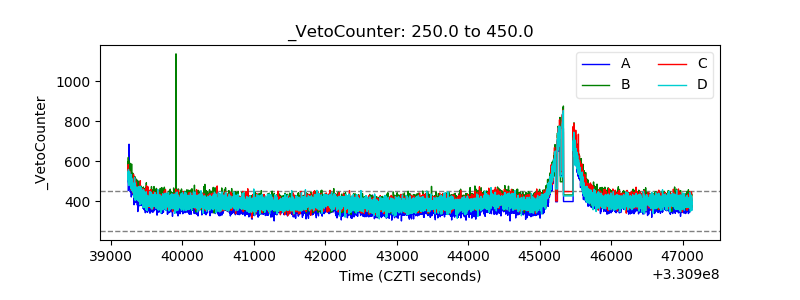 |