| Param | Original file | Final file |
|---|---|---|
| Filename | modeM0/AS1A09_016T03_9000003740_25672cztM0_level2.evt | modeM0/AS1A09_016T03_9000003740_25672cztM0_level2_quad_clean.evt |
| Size (bytes) | 264,291,840 | 45,158,400 |
| Size | 252.0 MB | 43.1 MB |
| Events in quadrant A | 2,466,153 | 282,580 |
| Events in quadrant B | 1,679,039 | 293,999 |
| Events in quadrant C | 1,650,484 | 276,135 |
| Events in quadrant D | 1,972,875 | 270,146 |
| Mode M0 | |||
|---|---|---|---|
| Quadrant | BADHDUFLAG | Total packets | Discarded packets |
| A | 0 | 9430 | 0 |
| B | 0 | 7112 | 0 |
| C | 0 | 7075 | 0 |
| D | 0 | 7966 | 0 |
| Quadrant | Total seconds | Saturated seconds | Saturation percentage |
|---|---|---|---|
| A | 3441 | 252 | 7.323452% |
| B | 3442 | 81 | 2.353283% |
| C | 3442 | 102 | 2.963393% |
| D | 3442 | 64 | 1.859384% |
Noise dominated data is calculated using 1-second bins in cleaned event files. If a bin has >2000 counts, and if more than 50% of those come from <1% of pixels, then it is considered to be noise-dominated and hence unusable.
| Quadrant | # 1 sec bins | Bins with >0 counts | Bins with >2000 counts | High rate bins dominated by noise | Noise dominated (total time) | Noise dominated (detector-on time) | Marked lightcurve |
|---|---|---|---|---|---|---|---|
| A | 3441 | 3441 | 116 | 116 | 3.37% | 3.37% | 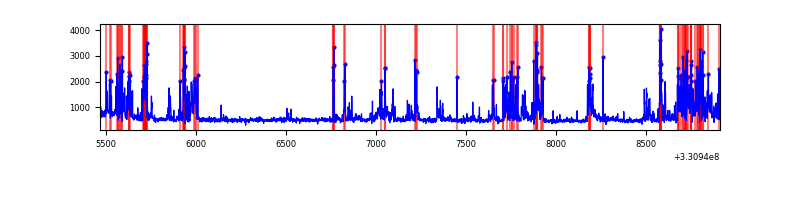 |
| B | 3442 | 3442 | 0 | 0 | 0.00% | 0.00% | 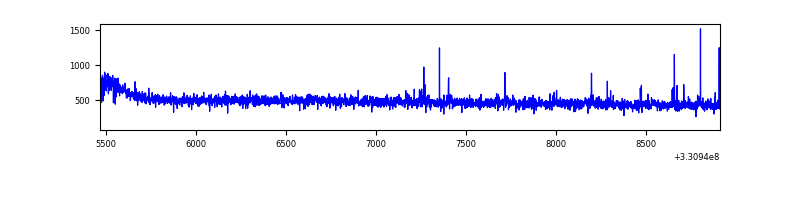 |
| C | 3442 | 3442 | 0 | 0 | 0.00% | 0.00% | 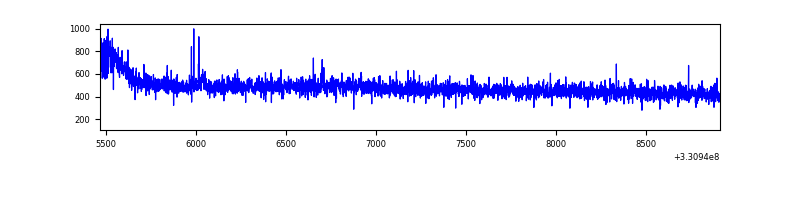 |
| D | 3442 | 3442 | 6 | 6 | 0.17% | 0.17% | 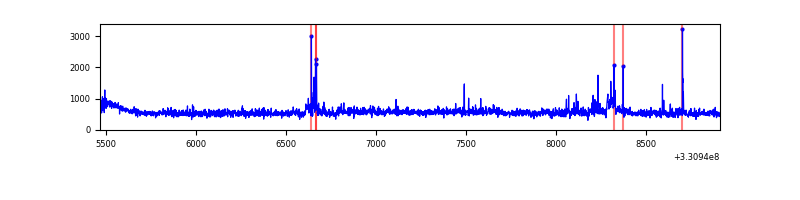 |
Top three noisy pixels from each quadrant. If the there are fewer than three noisy pixels in the level2.evt file, extra rows are filled as -1
| Pixel properties | Quadrant properties | ||||||
|---|---|---|---|---|---|---|---|
| Quadrant | DetID | PixID | Counts | Sigma | Mean | Median | Sigma |
| A | 12 | 96 | 782358 | 8997.18 | 418 | 407 | 86.9 |
| A | 8 | 192 | 71451 | 817.44 | 418 | 407 | 86.9 |
| A | 13 | 254 | 4436 | 46.36 | 418 | 407 | 86.9 |
| B | 0 | 245 | 19432 | 231.38 | 419 | 409 | 82.2 |
| B | 12 | 111 | 10134 | 118.29 | 419 | 409 | 82.2 |
| B | 0 | 190 | 10030 | 117.02 | 419 | 409 | 82.2 |
| C | 14 | 238 | 65386 | 676.49 | 404 | 405 | 96.1 |
| C | 2 | 16 | 4348 | 41.05 | 404 | 405 | 96.1 |
| C | 5 | 112 | 4174 | 39.24 | 404 | 405 | 96.1 |
| D | 8 | 195 | 324267 | 3181.26 | 412 | 398 | 101.8 |
| D | 2 | 244 | 62908 | 614.01 | 412 | 398 | 101.8 |
| D | 2 | 234 | 15328 | 146.65 | 412 | 398 | 101.8 |
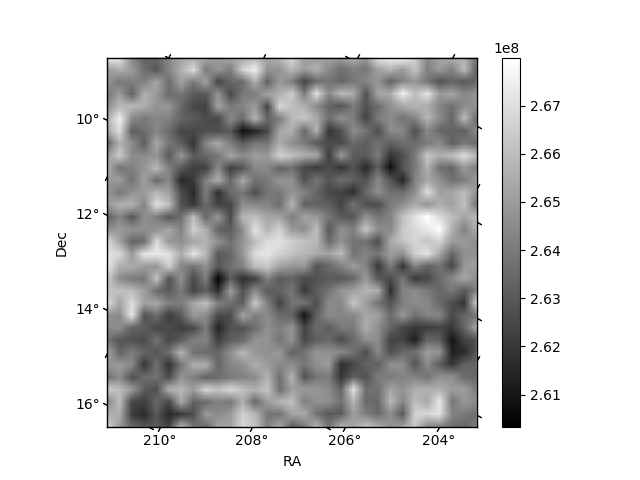
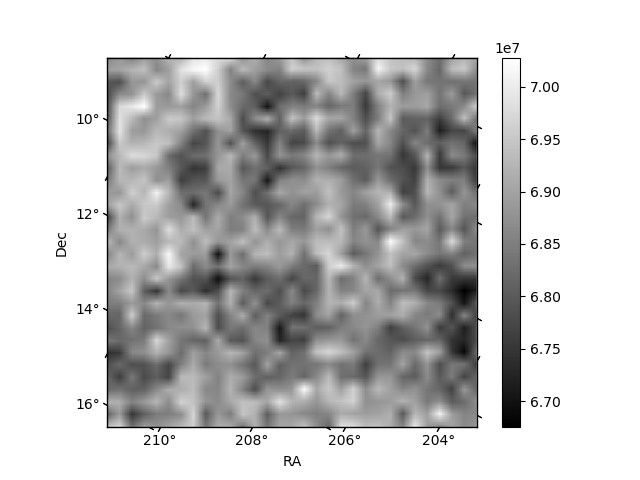
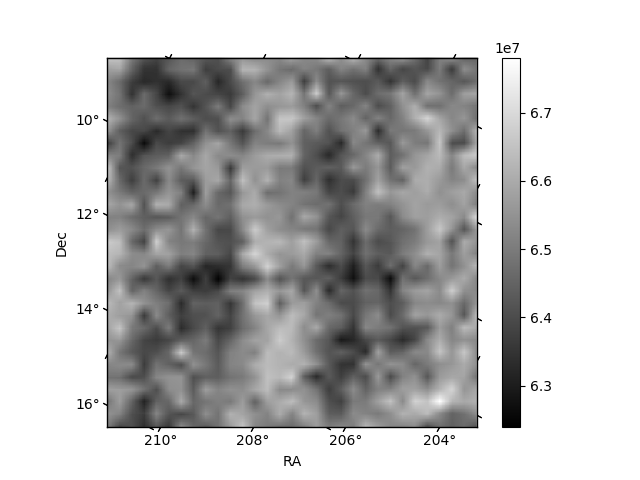
Histogram calculated using DETX and DETY for each event in the final _common_clean file
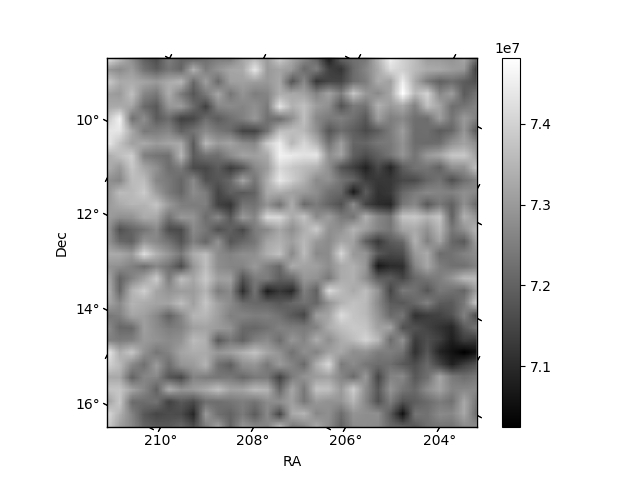
| Quadrant A | 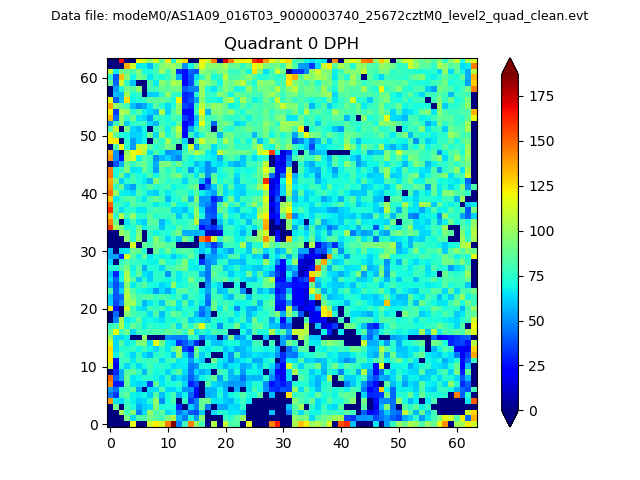 |
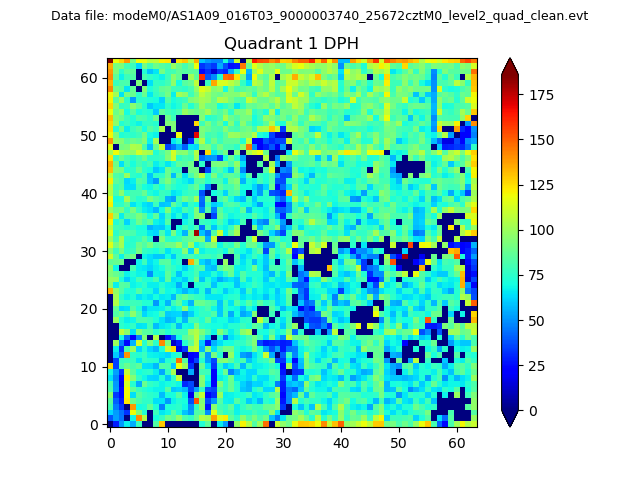 |
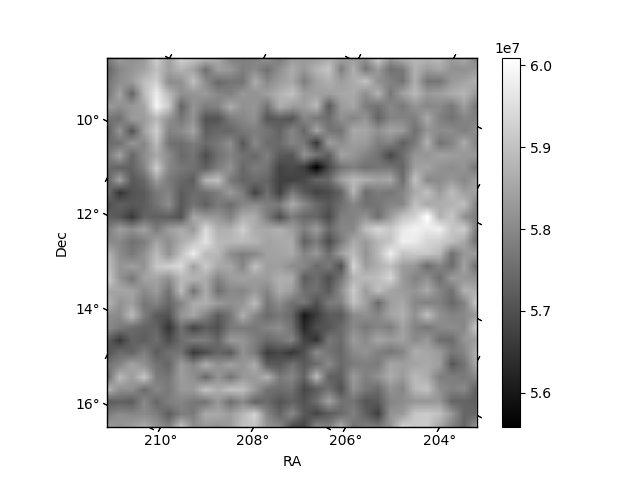
Quadrant B |
|---|---|---|---|
| Quadrant D | 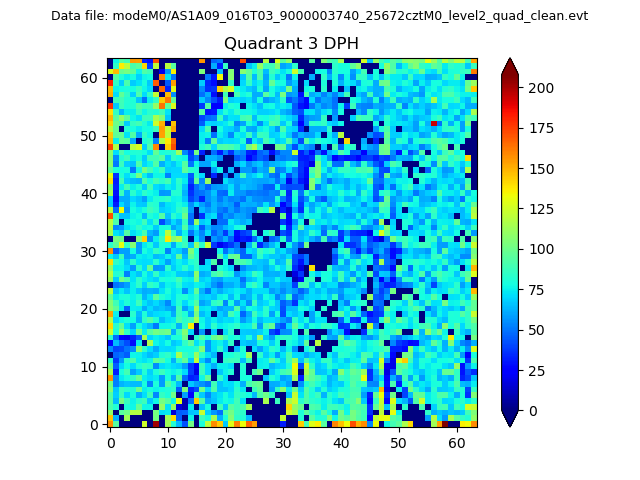 |
 |
Quadrant C |
| Plot type | Count rate plots | Images |
|---|---|---|
| Comparison with Poisson distribution Blue bars denote a histogram of data divided into 1 sec bins. Red curve is a Poisson curve with rate = median count rate of data. |
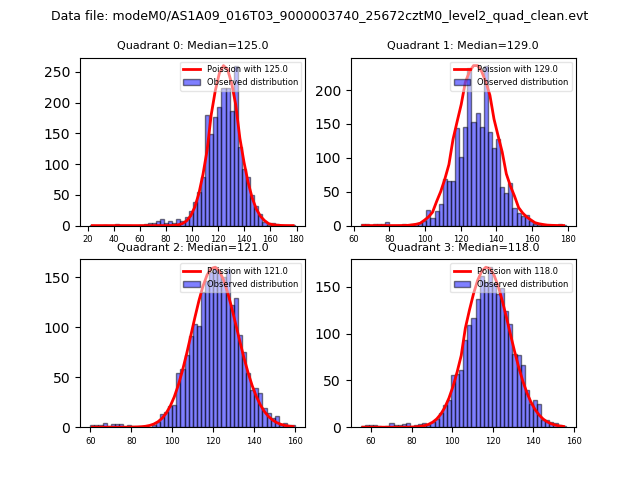 |
 |
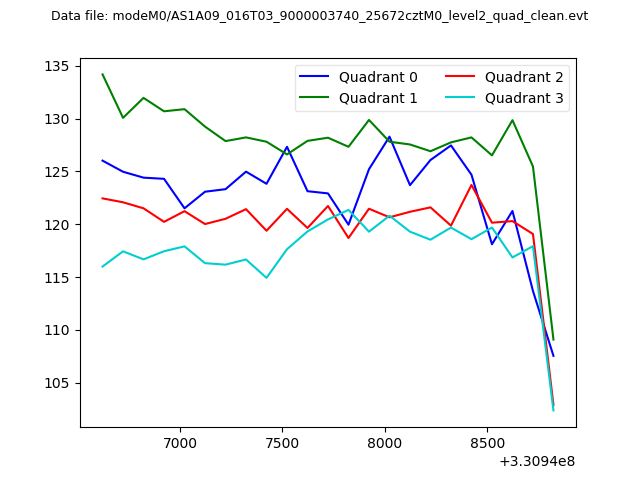
| Quadrant-wise count rates Data is divided into 100 sec bins |
 |
|
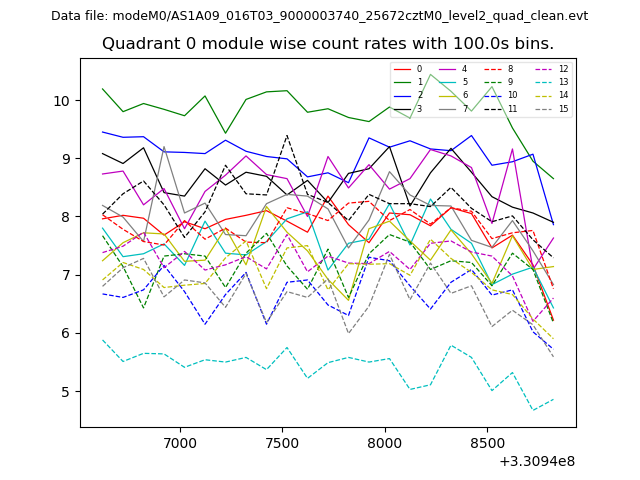
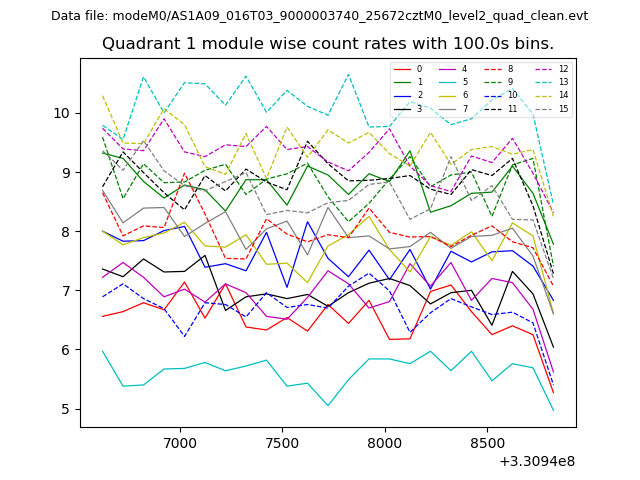
| Module-wise count rates for Quadrant A Data is divided into 100 sec bins |
 |
 |
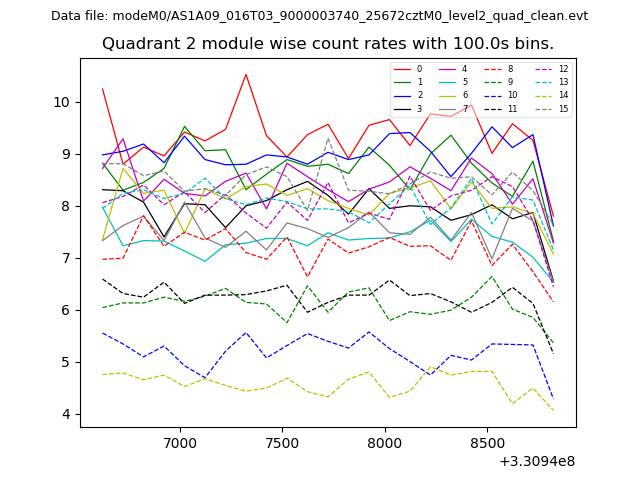
| Module-wise count rates for Quadrant B Data is divided into 100 sec bins |
 |
 |
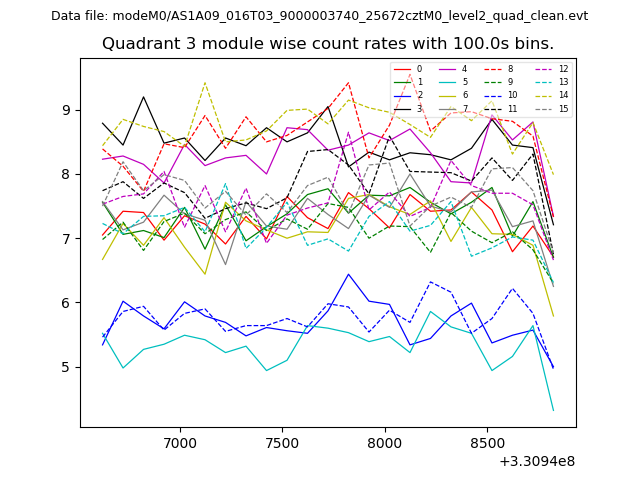
| Module-wise count rates for Quadrant C Data is divided into 100 sec bins |
 |
 |
| Module-wise count rates for Quadrant D Data is divided into 100 sec bins |
 |
 |
| Parameter | Plot |
|---|---|
| CZT HV Monitor | 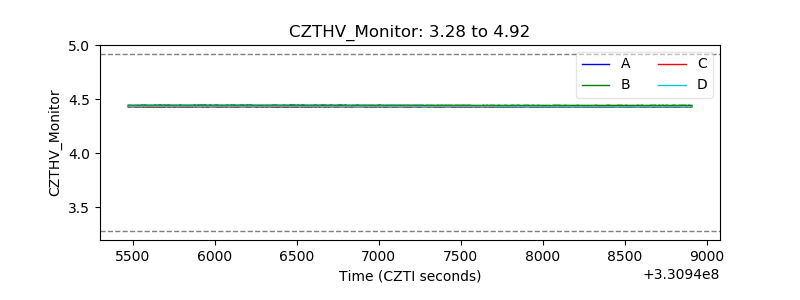 |
| D_VDD | 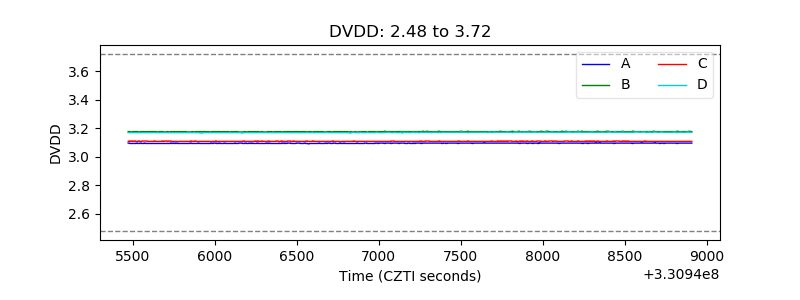 |
| Temperature 1 | 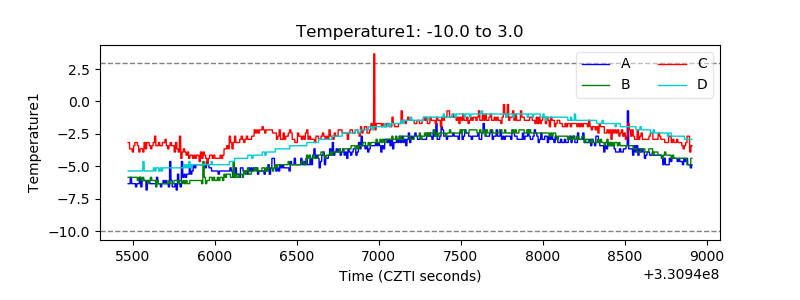 |
| Veto HV Monitor | 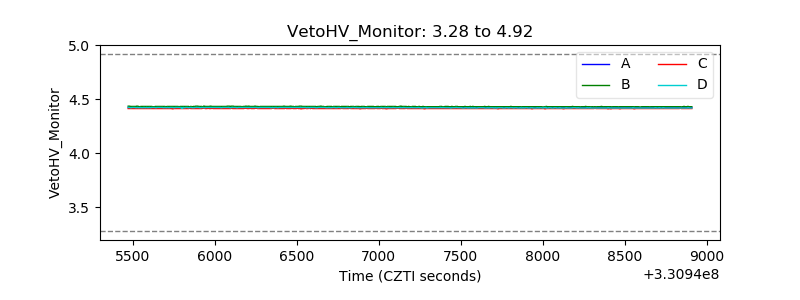 |
| Veto LLD | 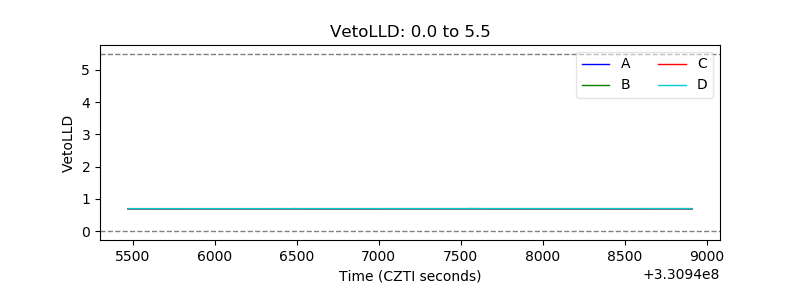 |
| Alpha Counter | 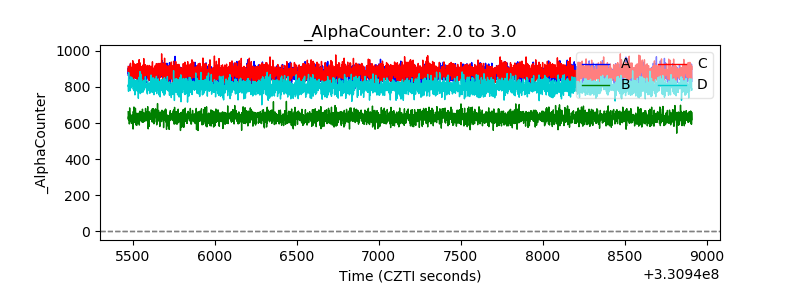 |
| _CPM_Rate | 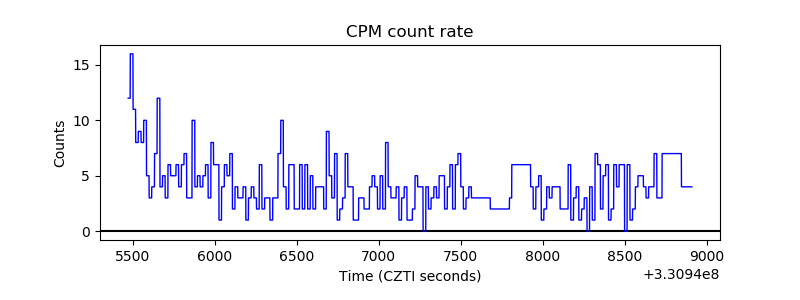 |
| CZT Counter |  |
| +2.5 Volts monitor |  |
| +5 Volts monitor |  |
| _ROLL_ROT | 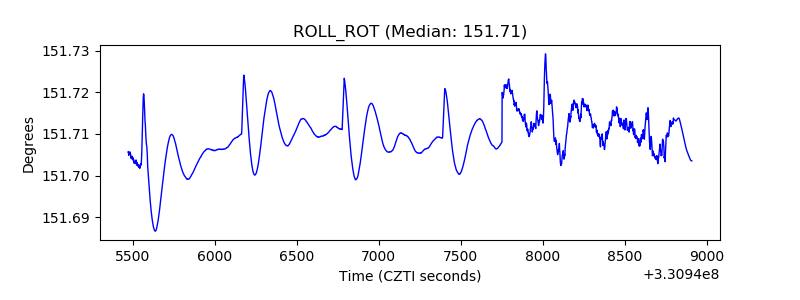 |
| _Roll_DEC | 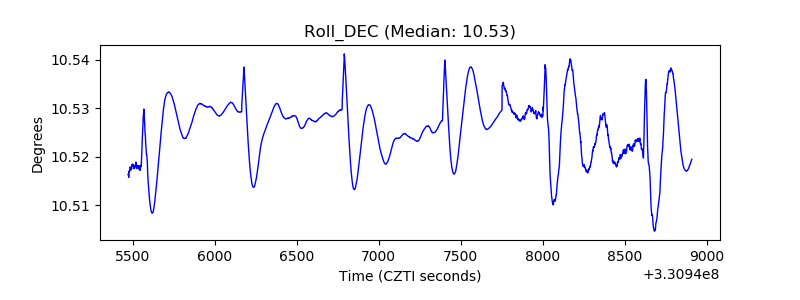 |
| _Roll_RA | 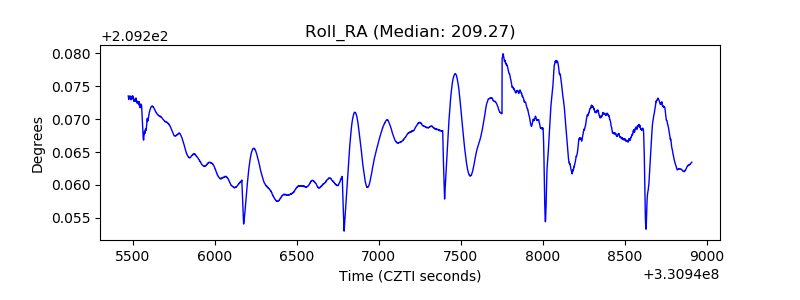 |
| Veto Counter | 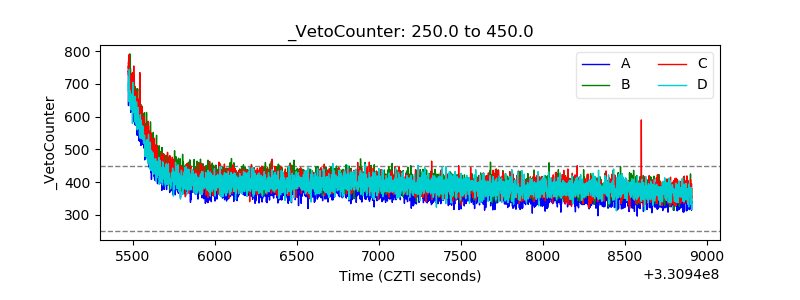 |