| Param | Original file | Final file |
|---|---|---|
| Filename | modeM0/AS1A09_016T04_9000003742cztM0_level2.fits | modeM0/AS1A09_016T04_9000003742cztM0_level2_quad_clean.evt |
| Size (bytes) | 98,346,240 | 99,406,080 |
| Size | 93.8 MB | 94.8 MB |
| Events in quadrant A | 589,228 | 598,434 |
| Events in quadrant B | 579,698 | 606,651 |
| Events in quadrant C | 583,356 | 566,279 |
| Events in quadrant D | 510,606 | 523,075 |
| Mode SS | |||
|---|---|---|---|
| Quadrant | BADHDUFLAG | Total packets | Discarded packets |
| A | 0 | 212 | 0 |
| B | 0 | 212 | 0 |
| C | 0 | 212 | 0 |
| D | 0 | 212 | 0 |
| Mode M0 | |||
|---|---|---|---|
| Quadrant | BADHDUFLAG | Total packets | Discarded packets |
| A | 0 | 28155 | 0 |
| B | 0 | 21483 | 0 |
| C | 0 | 21092 | 0 |
| D | 0 | 25325 | 0 |
| Mode M9 | |||
|---|---|---|---|
| Quadrant | BADHDUFLAG | Total packets | Discarded packets |
| A | 0 | 10 | 0 |
| B | 0 | 10 | 0 |
| C | 0 | 10 | 0 |
| D | 0 | 10 | 0 |
| Quadrant | Total seconds | Saturated seconds | Saturation percentage |
|---|---|---|---|
| A | 10323 | 627 | 6.073816% |
| B | 10323 | 181 | 1.753366% |
| C | 10323 | 231 | 2.237722% |
| D | 10323 | 183 | 1.772740% |
Noise dominated data is calculated using 1-second bins in cleaned event files. If a bin has >2000 counts, and if more than 50% of those come from <1% of pixels, then it is considered to be noise-dominated and hence unusable.
| Quadrant | # 1 sec bins | Bins with >0 counts | Bins with >2000 counts | High rate bins dominated by noise | Noise dominated (total time) | Noise dominated (detector-on time) | Marked lightcurve |
|---|---|---|---|---|---|---|---|
| A | 11368 | 10321 | 0 | 0 | 0.00% | 0.00% |  |
| B | 11368 | 10321 | 0 | 0 | 0.00% | 0.00% |  |
| C | 11368 | 10321 | 0 | 0 | 0.00% | 0.00% |  |
| D | 11368 | 10320 | 0 | 0 | 0.00% | 0.00% |  |
Top three noisy pixels from each quadrant. If the there are fewer than three noisy pixels in the level2.evt file, extra rows are filled as -1
| Pixel properties | Quadrant properties | ||||||
|---|---|---|---|---|---|---|---|
| Quadrant | DetID | PixID | Counts | Sigma | Mean | Median | Sigma |
| A | 14 | 188 | 604 | 11.54 | 153 | 144 | 39.9 |
| A | 0 | 29 | 570 | 10.69 | 153 | 144 | 39.9 |
| A | 14 | 204 | 556 | 10.34 | 153 | 144 | 39.9 |
| B | 2 | 9 | 487 | 10.23 | 153 | 145 | 33.4 |
| B | 3 | 17 | 397 | 7.54 | 153 | 145 | 33.4 |
| B | 2 | 8 | 392 | 7.39 | 153 | 145 | 33.4 |
| C | 12 | 241 | 425 | 6.86 | 154 | 144 | 41.0 |
| C | 9 | 233 | 410 | 6.49 | 154 | 144 | 41.0 |
| C | 12 | 250 | 398 | 6.2 | 154 | 144 | 41.0 |
| D | 6 | 38 | 372 | 5.92 | 145 | 132 | 40.6 |
| D | 3 | 14 | 369 | 5.84 | 145 | 132 | 40.6 |
| D | 4 | 160 | 362 | 5.67 | 145 | 132 | 40.6 |
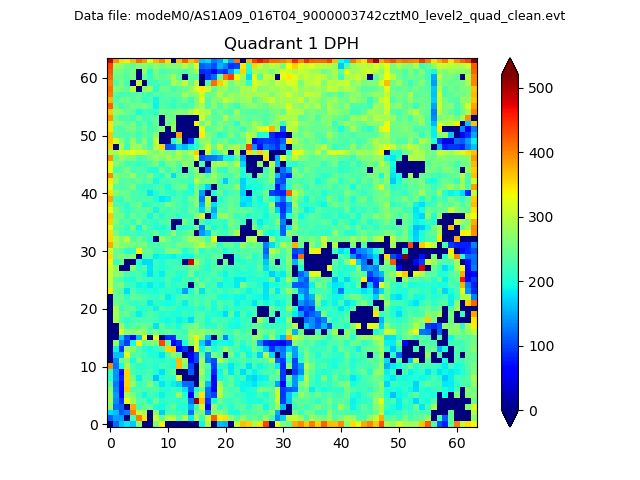
Histogram calculated using DETX and DETY for each event in the final _common_clean file
| Quadrant A |  |
 |
Quadrant B |
|---|---|---|---|
| Quadrant D |  |
 |
Quadrant C |
| Plot type | Count rate plots | Images |
|---|---|---|
| Comparison with Poisson distribution Blue bars denote a histogram of data divided into 1 sec bins. Red curve is a Poisson curve with rate = median count rate of data. |
 |
 |
| Quadrant-wise count rates Data is divided into 100 sec bins |
 |
|
| Module-wise count rates for Quadrant A Data is divided into 100 sec bins |
 |
 |
| Module-wise count rates for Quadrant B Data is divided into 100 sec bins |
 |
 |
| Module-wise count rates for Quadrant C Data is divided into 100 sec bins |
 |
 |
| Module-wise count rates for Quadrant D Data is divided into 100 sec bins |
 |
 |
| Parameter | Plot |
|---|---|
| CZT HV Monitor |  |
| D_VDD | 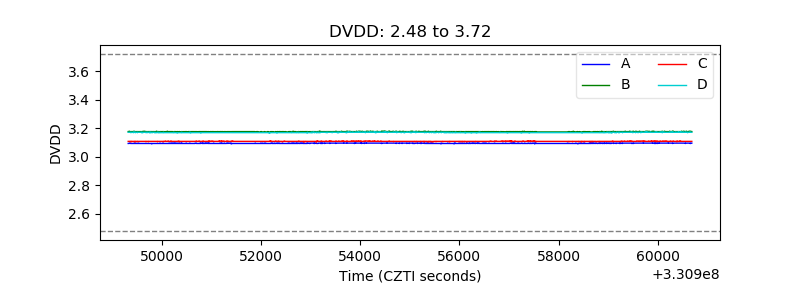 |
| Temperature 1 |  |
| Veto HV Monitor |  |
| Veto LLD |  |
| Alpha Counter |  |
| _CPM_Rate |  |
| CZT Counter |  |
| +2.5 Volts monitor |  |
| +5 Volts monitor |  |
| _ROLL_ROT |  |
| _Roll_DEC |  |
| _Roll_RA |  |
| Veto Counter |  |