| Param | Original file | Final file |
|---|---|---|
| Filename | modeM0/AS1A09_016T04_9000003742_25672cztM0_level2.evt | modeM0/AS1A09_016T04_9000003742_25672cztM0_level2_quad_clean.evt |
| Size (bytes) | 799,701,120 | 136,526,400 |
| Size | 762.7 MB | 130.2 MB |
| Events in quadrant A | 7,249,680 | 866,255 |
| Events in quadrant B | 5,081,347 | 887,830 |
| Events in quadrant C | 4,937,762 | 839,137 |
| Events in quadrant D | 6,251,310 | 826,170 |
| Mode M0 | |||
|---|---|---|---|
| Quadrant | BADHDUFLAG | Total packets | Discarded packets |
| A | 0 | 28155 | 0 |
| B | 0 | 21483 | 0 |
| C | 0 | 21092 | 0 |
| D | 0 | 25325 | 0 |
| Mode M9 | |||
|---|---|---|---|
| Quadrant | BADHDUFLAG | Total packets | Discarded packets |
| A | 0 | 10 | 0 |
| B | 0 | 10 | 0 |
| C | 0 | 10 | 0 |
| D | 0 | 10 | 0 |
| Quadrant | Total seconds | Saturated seconds | Saturation percentage |
|---|---|---|---|
| A | 10323 | 627 | 6.073816% |
| B | 10323 | 181 | 1.753366% |
| C | 10323 | 231 | 2.237722% |
| D | 10323 | 183 | 1.772740% |
Noise dominated data is calculated using 1-second bins in cleaned event files. If a bin has >2000 counts, and if more than 50% of those come from <1% of pixels, then it is considered to be noise-dominated and hence unusable.
| Quadrant | # 1 sec bins | Bins with >0 counts | Bins with >2000 counts | High rate bins dominated by noise | Noise dominated (total time) | Noise dominated (detector-on time) | Marked lightcurve |
|---|---|---|---|---|---|---|---|
| A | 11368 | 10323 | 355 | 355 | 3.12% | 3.44% | 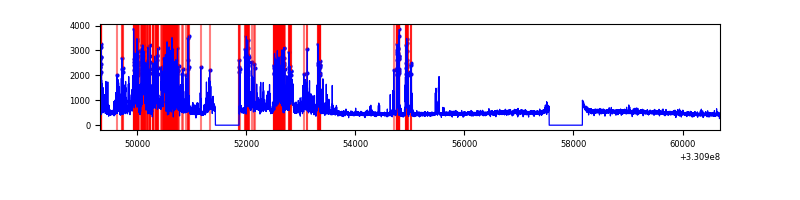 |
| B | 11368 | 10323 | 5 | 5 | 0.04% | 0.05% | 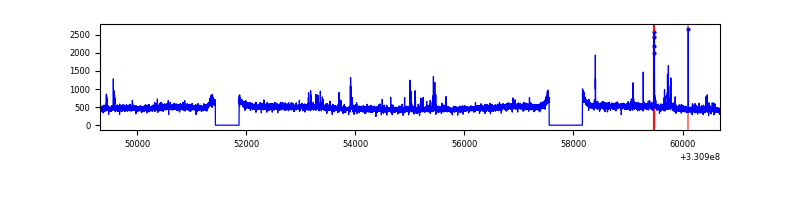 |
| C | 11368 | 10323 | 0 | 0 | 0.00% | 0.00% | 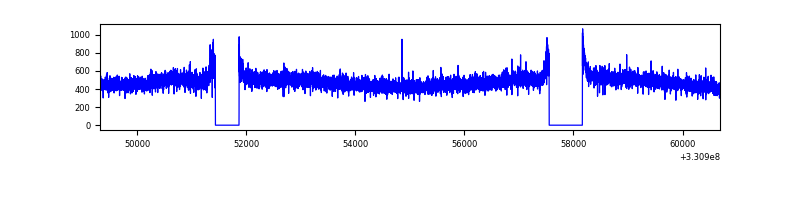 |
| D | 11368 | 10323 | 40 | 40 | 0.35% | 0.39% | 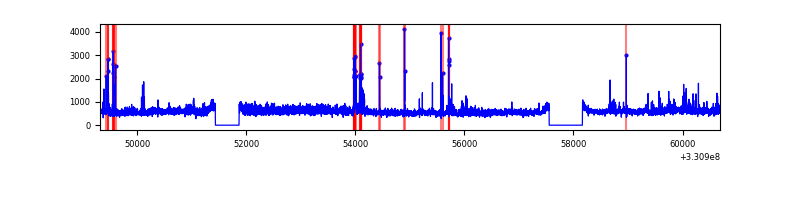 |
Top three noisy pixels from each quadrant. If the there are fewer than three noisy pixels in the level2.evt file, extra rows are filled as -1
| Pixel properties | Quadrant properties | ||||||
|---|---|---|---|---|---|---|---|
| Quadrant | DetID | PixID | Counts | Sigma | Mean | Median | Sigma |
| A | 12 | 96 | 2230298 | 8806.75 | 1252 | 1224 | 253.1 |
| A | 8 | 192 | 197645 | 776.03 | 1252 | 1224 | 253.1 |
| A | 13 | 254 | 13751 | 49.49 | 1252 | 1224 | 253.1 |
| B | 0 | 245 | 88249 | 357.21 | 1261 | 1227 | 243.6 |
| B | 0 | 190 | 31072 | 122.51 | 1261 | 1227 | 243.6 |
| B | 12 | 111 | 30373 | 119.64 | 1261 | 1227 | 243.6 |
| C | 14 | 238 | 194060 | 676.4 | 1214 | 1221 | 285.1 |
| C | 3 | 233 | 9424 | 28.77 | 1214 | 1221 | 285.1 |
| C | 13 | 61 | 8325 | 24.92 | 1214 | 1221 | 285.1 |
| D | 8 | 195 | 1209135 | 4042.97 | 1230 | 1195 | 298.8 |
| D | 2 | 244 | 175443 | 583.21 | 1230 | 1195 | 298.8 |
| D | 13 | 174 | 129798 | 430.43 | 1230 | 1195 | 298.8 |
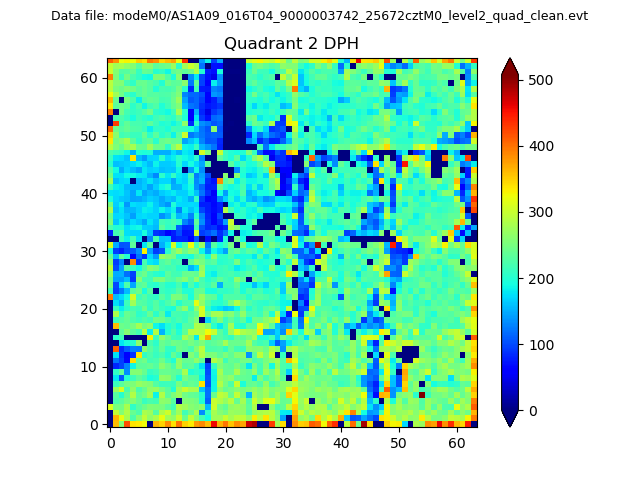
Histogram calculated using DETX and DETY for each event in the final _common_clean file
| Quadrant A | 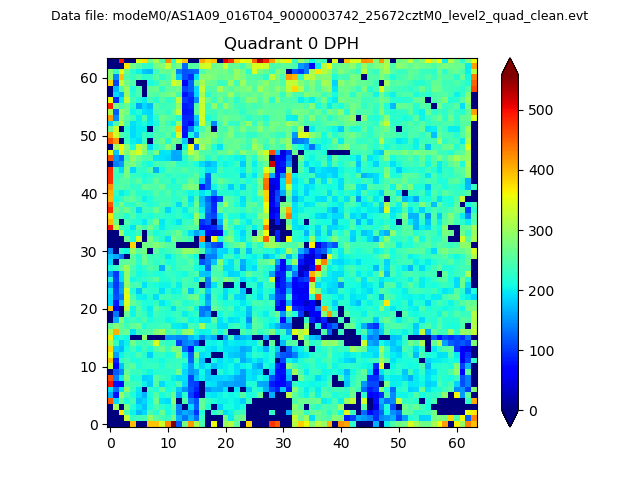 |
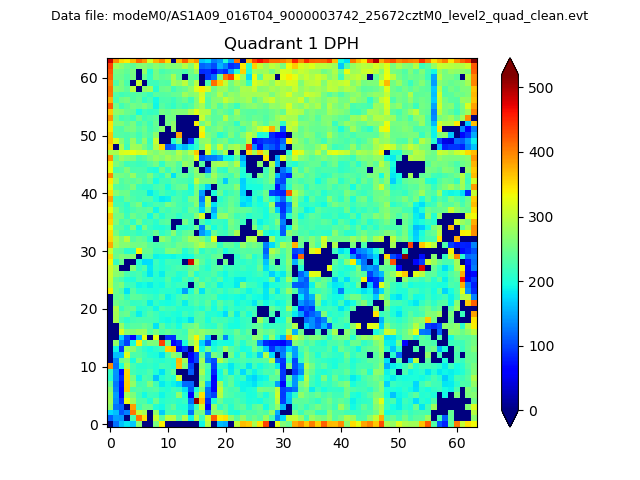 |
Quadrant B |
|---|---|---|---|
| Quadrant D | 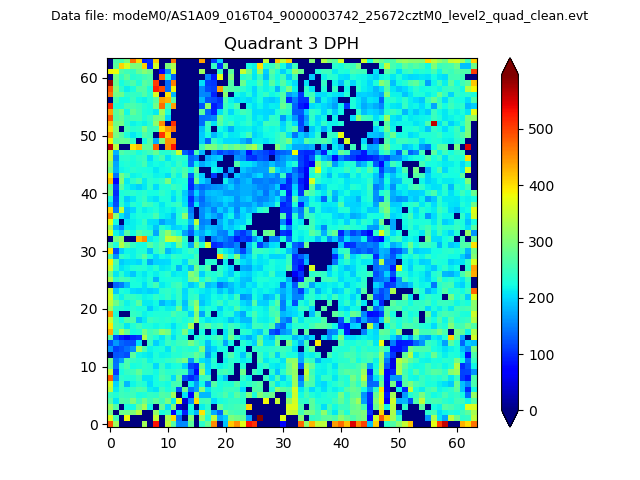 |
 |
Quadrant C |
| Plot type | Count rate plots | Images |
|---|---|---|
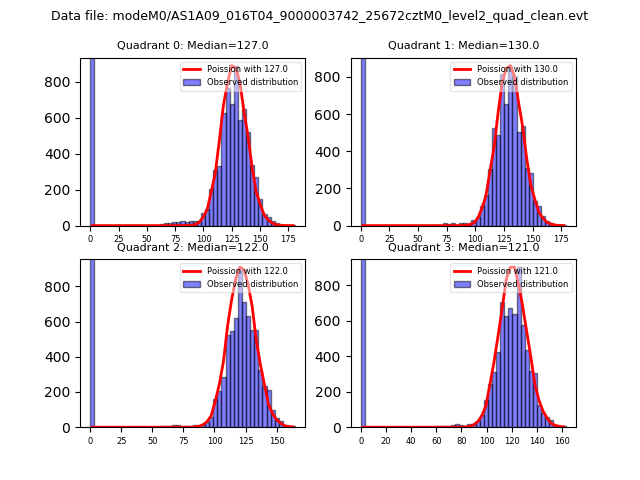
| Comparison with Poisson distribution Blue bars denote a histogram of data divided into 1 sec bins. Red curve is a Poisson curve with rate = median count rate of data. |
 |
 |
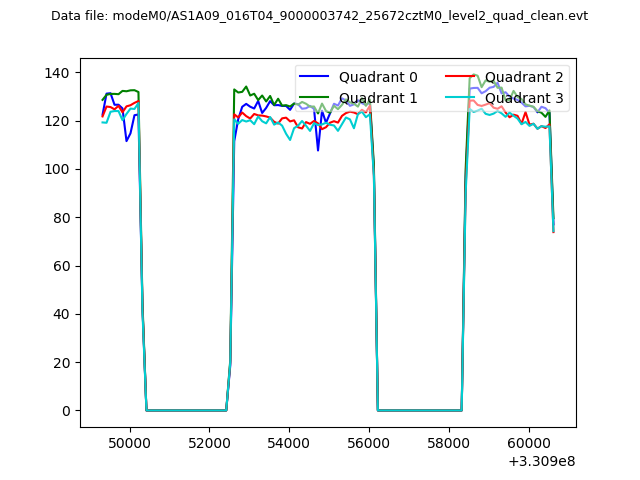
| Quadrant-wise count rates Data is divided into 100 sec bins |
 |
|
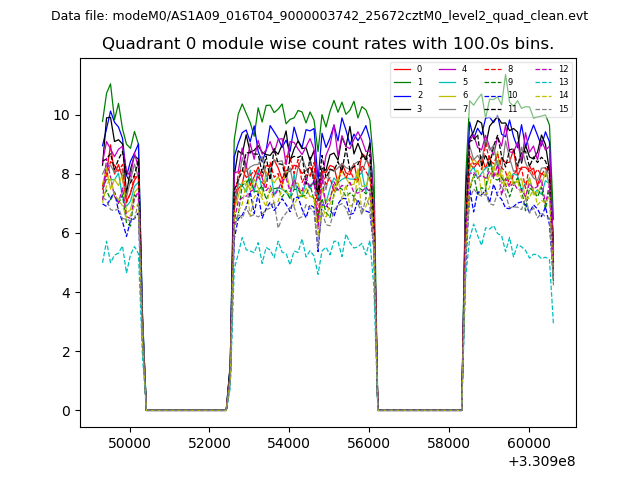
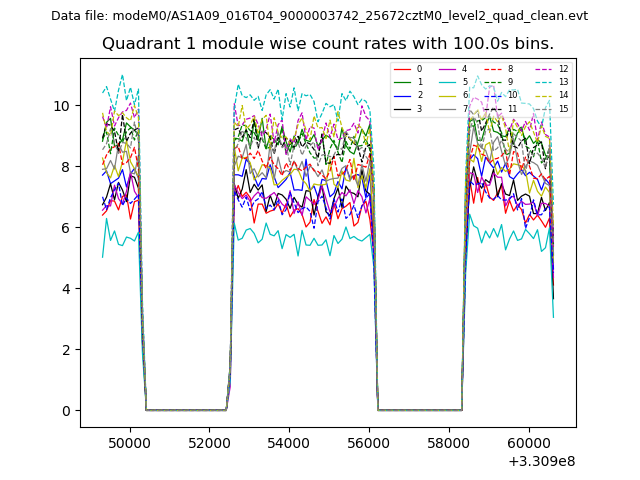
| Module-wise count rates for Quadrant A Data is divided into 100 sec bins |
 |
 |
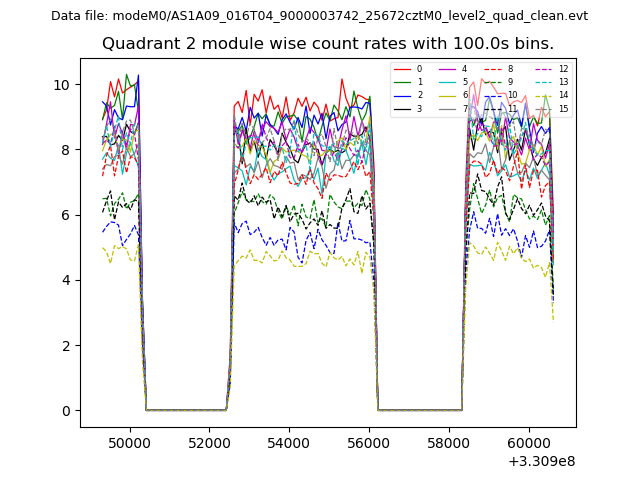
| Module-wise count rates for Quadrant B Data is divided into 100 sec bins |
 |
 |
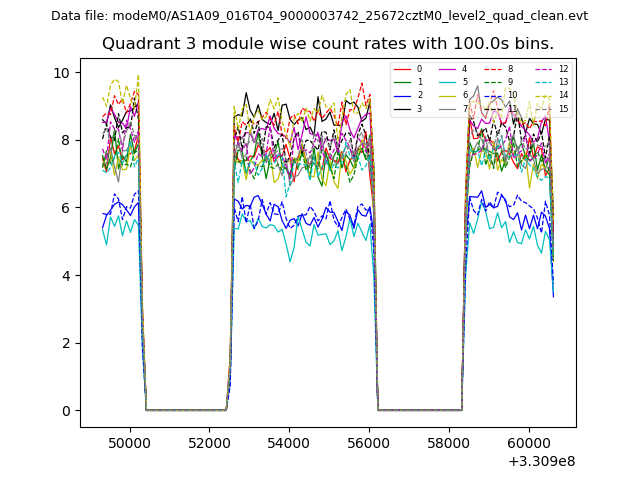
| Module-wise count rates for Quadrant C Data is divided into 100 sec bins |
 |
 |
| Module-wise count rates for Quadrant D Data is divided into 100 sec bins |
 |
 |
| Parameter | Plot |
|---|---|
| CZT HV Monitor | 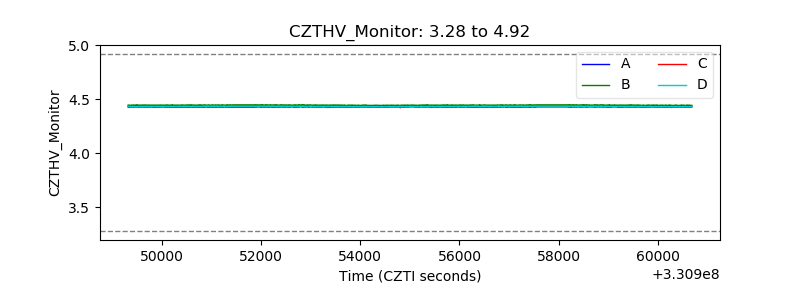 |
| D_VDD | 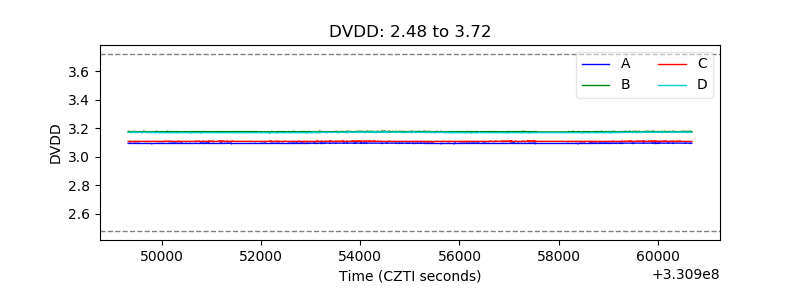 |
| Temperature 1 | 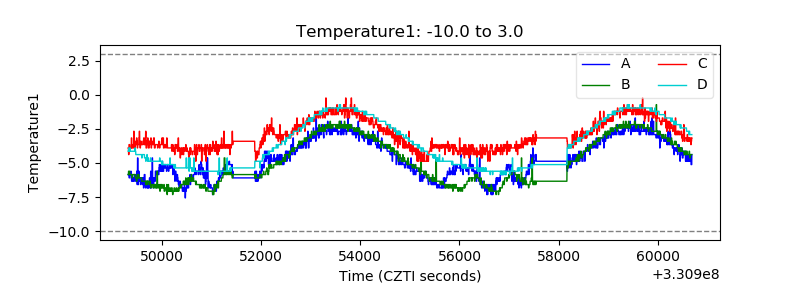 |
| Veto HV Monitor |  |
| Veto LLD | 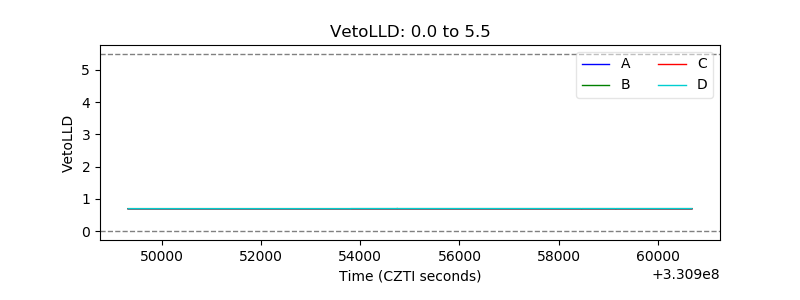 |
| Alpha Counter | 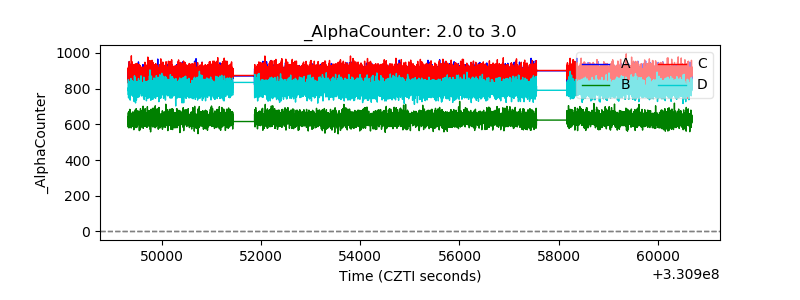 |
| _CPM_Rate | 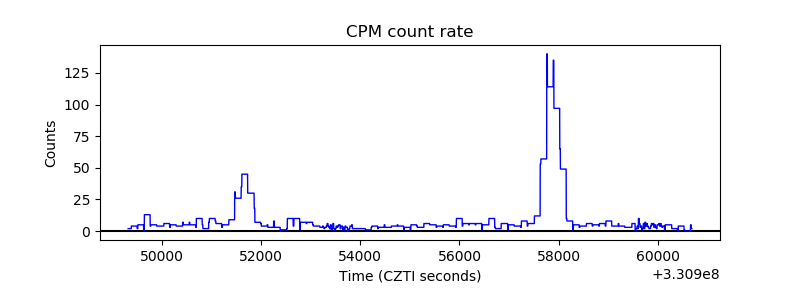 |
| CZT Counter | 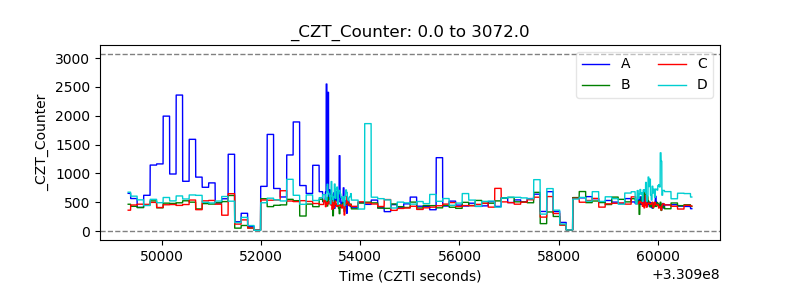 |
| +2.5 Volts monitor |  |
| +5 Volts monitor |  |
| _ROLL_ROT | 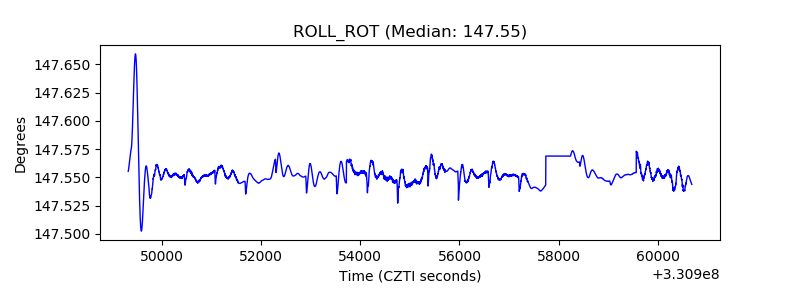 |
| _Roll_DEC | 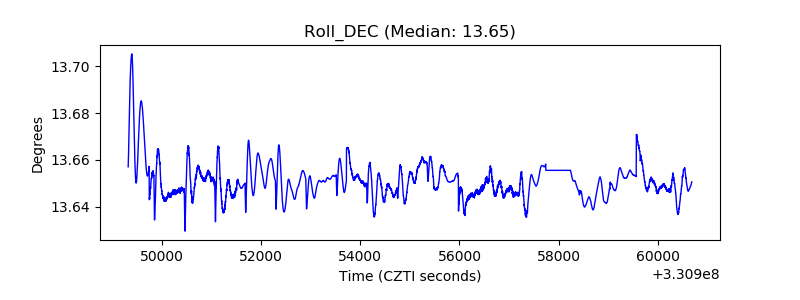 |
| _Roll_RA | 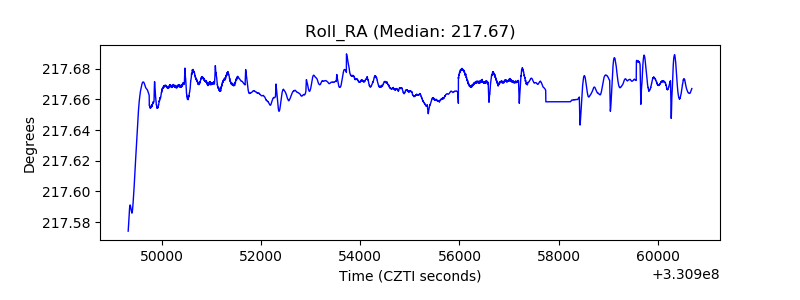 |
| Veto Counter | 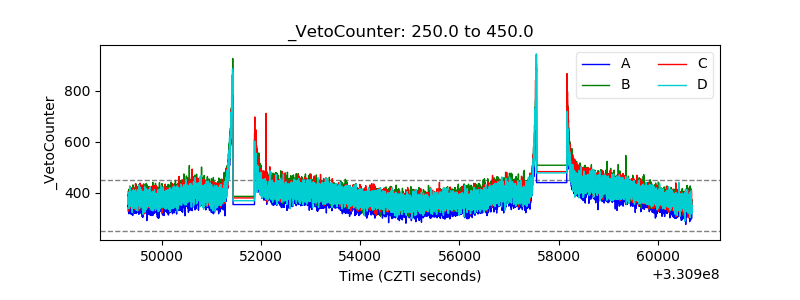 |