| Param | Original file | Final file |
|---|---|---|
| Filename | modeM0/AS1A09_043T01_9000003744cztM0_level2.fits | modeM0/AS1A09_043T01_9000003744cztM0_level2_quad_clean.evt |
| Size (bytes) | 762,125,760 | 601,439,040 |
| Size | 726.8 MB | 573.6 MB |
| Events in quadrant A | 4,723,594 | 3,421,698 |
| Events in quadrant B | 4,569,168 | 3,427,469 |
| Events in quadrant C | 4,581,810 | 3,207,724 |
| Events in quadrant D | 3,958,128 | 2,907,772 |
| Mode SS | |||
|---|---|---|---|
| Quadrant | BADHDUFLAG | Total packets | Discarded packets |
| A | 0 | 1562 | 0 |
| B | 0 | 1562 | 0 |
| C | 0 | 1562 | 0 |
| D | 0 | 1562 | 0 |
| Mode M9 | |||
|---|---|---|---|
| Quadrant | BADHDUFLAG | Total packets | Discarded packets |
| A | 0 | 117 | 0 |
| B | 0 | 118 | 0 |
| C | 0 | 118 | 0 |
| D | 0 | 118 | 0 |
| Mode M0 | |||
|---|---|---|---|
| Quadrant | BADHDUFLAG | Total packets | Discarded packets |
| A | 0 | 169083 | 0 |
| B | 0 | 161449 | 0 |
| C | 0 | 159143 | 0 |
| D | 0 | 211819 | 0 |
| Quadrant | Total seconds | Saturated seconds | Saturation percentage |
|---|---|---|---|
| A | 76525 | 1103 | 1.441359% |
| B | 76525 | 994 | 1.298922% |
| C | 76525 | 1238 | 1.617772% |
| D | 76525 | 2209 | 2.886638% |
Noise dominated data is calculated using 1-second bins in cleaned event files. If a bin has >2000 counts, and if more than 50% of those come from <1% of pixels, then it is considered to be noise-dominated and hence unusable.
| Quadrant | # 1 sec bins | Bins with >0 counts | Bins with >2000 counts | High rate bins dominated by noise | Noise dominated (total time) | Noise dominated (detector-on time) | Marked lightcurve |
|---|---|---|---|---|---|---|---|
| A | 93357 | 76514 | 0 | 0 | 0.00% | 0.00% |  |
| B | 93357 | 76519 | 0 | 0 | 0.00% | 0.00% |  |
| C | 93357 | 76519 | 0 | 0 | 0.00% | 0.00% |  |
| D | 93357 | 76494 | 0 | 0 | 0.00% | 0.00% |  |
Top three noisy pixels from each quadrant. If the there are fewer than three noisy pixels in the level2.evt file, extra rows are filled as -1
| Pixel properties | Quadrant properties | ||||||
|---|---|---|---|---|---|---|---|
| Quadrant | DetID | PixID | Counts | Sigma | Mean | Median | Sigma |
| A | 0 | 29 | 4022 | 9.55 | 1229 | 1155 | 300.3 |
| A | 7 | 110 | 3908 | 9.17 | 1229 | 1155 | 300.3 |
| A | 0 | 30 | 3476 | 7.73 | 1229 | 1155 | 300.3 |
| B | 2 | 9 | 3576 | 10.34 | 1206 | 1152 | 234.4 |
| B | 2 | 8 | 3040 | 8.05 | 1206 | 1152 | 234.4 |
| B | 3 | 80 | 3019 | 7.96 | 1206 | 1152 | 234.4 |
| C | 1 | 81 | 3559 | 7.92 | 1208 | 1127 | 307.0 |
| C | 1 | 80 | 3507 | 7.75 | 1208 | 1127 | 307.0 |
| C | 12 | 241 | 3200 | 6.75 | 1208 | 1127 | 307.0 |
| D | 3 | 14 | 2842 | 6.0 | 1128 | 1025 | 302.7 |
| D | 6 | 67 | 2773 | 5.77 | 1128 | 1025 | 302.7 |
| D | 6 | 231 | 2757 | 5.72 | 1128 | 1025 | 302.7 |
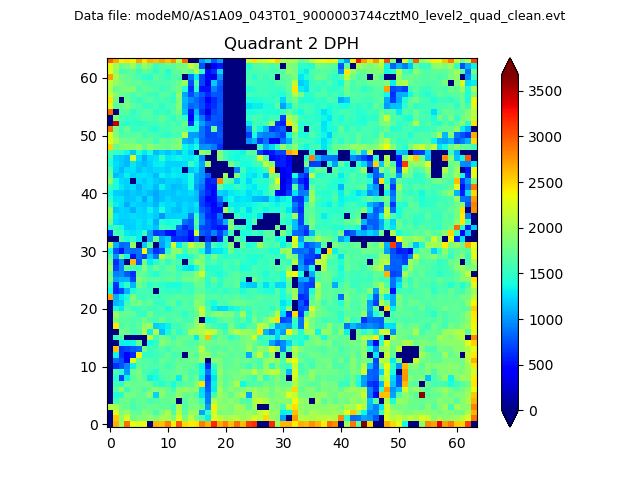
Histogram calculated using DETX and DETY for each event in the final _common_clean file
| Quadrant A |  |
 |
Quadrant B |
|---|---|---|---|
| Quadrant D | 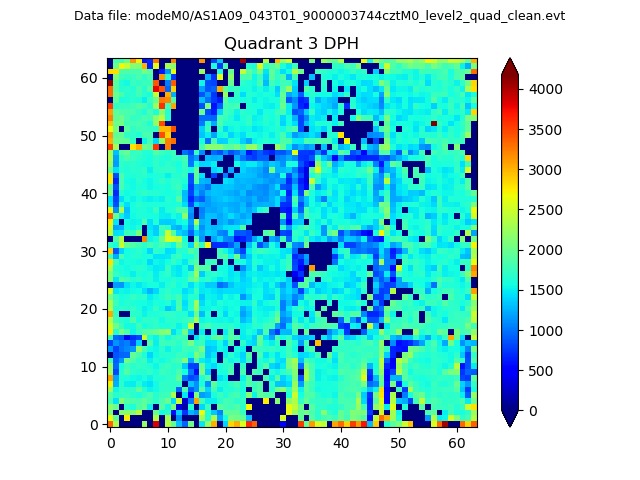 |
 |
Quadrant C |
| Plot type | Count rate plots | Images |
|---|---|---|
| Comparison with Poisson distribution Blue bars denote a histogram of data divided into 1 sec bins. Red curve is a Poisson curve with rate = median count rate of data. |
 |
 |
| Quadrant-wise count rates Data is divided into 100 sec bins |
 |
|
| Module-wise count rates for Quadrant A Data is divided into 100 sec bins |
 |
 |
| Module-wise count rates for Quadrant B Data is divided into 100 sec bins |
 |
 |
| Module-wise count rates for Quadrant C Data is divided into 100 sec bins |
 |
 |
| Module-wise count rates for Quadrant D Data is divided into 100 sec bins |
 |
 |
| Parameter | Plot |
|---|---|
| CZT HV Monitor |  |
| D_VDD |  |
| Temperature 1 |  |
| Veto HV Monitor |  |
| Veto LLD |  |
| Alpha Counter |  |
| _CPM_Rate |  |
| CZT Counter |  |
| +2.5 Volts monitor |  |
| +5 Volts monitor |  |
| _ROLL_ROT | 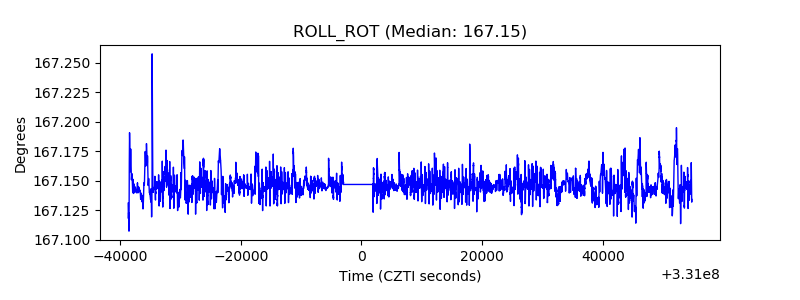 |
| _Roll_DEC |  |
| _Roll_RA |  |
| Veto Counter |  |