| Param | Original file | Final file |
|---|---|---|
| Filename | modeM0/AS1A09_043T01_9000003744_25672cztM0_level2.evt | modeM0/AS1A09_043T01_9000003744_25672cztM0_level2_quad_clean.evt |
| Size (bytes) | 295,784,640 | 42,382,080 |
| Size | 282.1 MB | 40.4 MB |
| Events in quadrant A | 2,509,658 | 259,886 |
| Events in quadrant B | 1,917,675 | 263,626 |
| Events in quadrant C | 1,887,945 | 248,049 |
| Events in quadrant D | 2,385,396 | 244,835 |
| Mode M9 | |||
|---|---|---|---|
| Quadrant | BADHDUFLAG | Total packets | Discarded packets |
| A | 0 | 9 | 0 |
| B | 0 | 9 | 0 |
| C | 0 | 9 | 0 |
| D | 0 | 9 | 0 |
| Mode M0 | |||
|---|---|---|---|
| Quadrant | BADHDUFLAG | Total packets | Discarded packets |
| A | 0 | 10719 | 0 |
| B | 0 | 7943 | 0 |
| C | 0 | 7867 | 0 |
| D | 0 | 9808 | 0 |
| Quadrant | Total seconds | Saturated seconds | Saturation percentage |
|---|---|---|---|
| A | 3776 | 43 | 1.138771% |
| B | 3776 | 40 | 1.059322% |
| C | 3775 | 65 | 1.721854% |
| D | 3775 | 31 | 0.821192% |
Noise dominated data is calculated using 1-second bins in cleaned event files. If a bin has >2000 counts, and if more than 50% of those come from <1% of pixels, then it is considered to be noise-dominated and hence unusable.
| Quadrant | # 1 sec bins | Bins with >0 counts | Bins with >2000 counts | High rate bins dominated by noise | Noise dominated (total time) | Noise dominated (detector-on time) | Marked lightcurve |
|---|---|---|---|---|---|---|---|
| A | 4611 | 3776 | 0 | 0 | 0.00% | 0.00% | 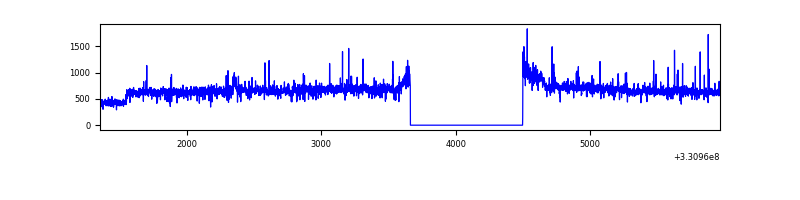 |
| B | 4611 | 3777 | 2 | 2 | 0.04% | 0.05% | 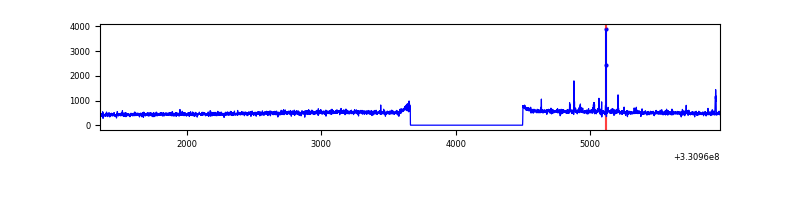 |
| C | 4610 | 3776 | 0 | 0 | 0.00% | 0.00% | 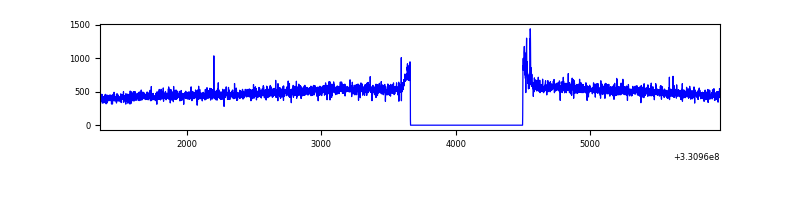 |
| D | 4610 | 3776 | 7 | 7 | 0.15% | 0.19% | 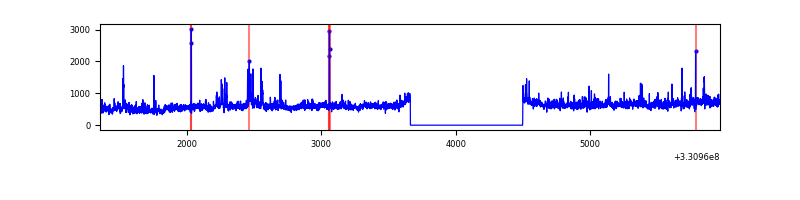 |
Top three noisy pixels from each quadrant. If the there are fewer than three noisy pixels in the level2.evt file, extra rows are filled as -1
| Pixel properties | Quadrant properties | ||||||
|---|---|---|---|---|---|---|---|
| Quadrant | DetID | PixID | Counts | Sigma | Mean | Median | Sigma |
| A | 8 | 192 | 644901 | 6480.99 | 483 | 472 | 99.4 |
| A | 13 | 254 | 5258 | 48.13 | 483 | 472 | 99.4 |
| A | 3 | 137 | 4562 | 41.13 | 483 | 472 | 99.4 |
| B | 0 | 190 | 12142 | 124.64 | 478 | 465 | 93.7 |
| B | 12 | 111 | 11559 | 118.41 | 478 | 465 | 93.7 |
| B | 0 | 245 | 11354 | 116.23 | 478 | 465 | 93.7 |
| C | 14 | 238 | 72788 | 658.36 | 461 | 464 | 109.9 |
| C | 3 | 233 | 16705 | 147.84 | 461 | 464 | 109.9 |
| C | 13 | 61 | 3213 | 25.02 | 461 | 464 | 109.9 |
| D | 8 | 195 | 425561 | 3720.77 | 466 | 453 | 114.3 |
| D | 2 | 244 | 90487 | 788.02 | 466 | 453 | 114.3 |
| D | 1 | 52 | 46213 | 400.52 | 466 | 453 | 114.3 |
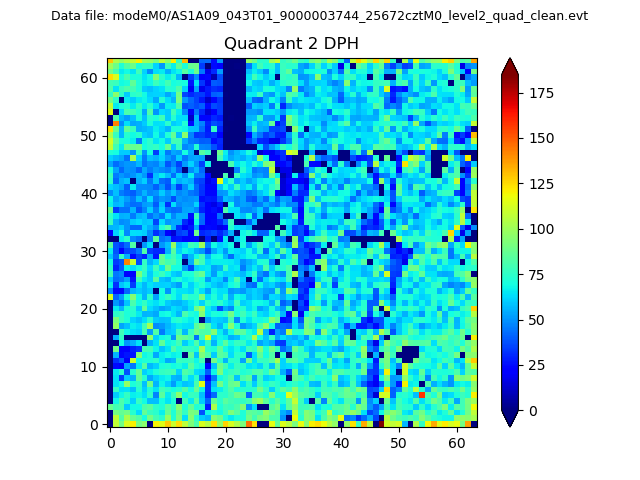
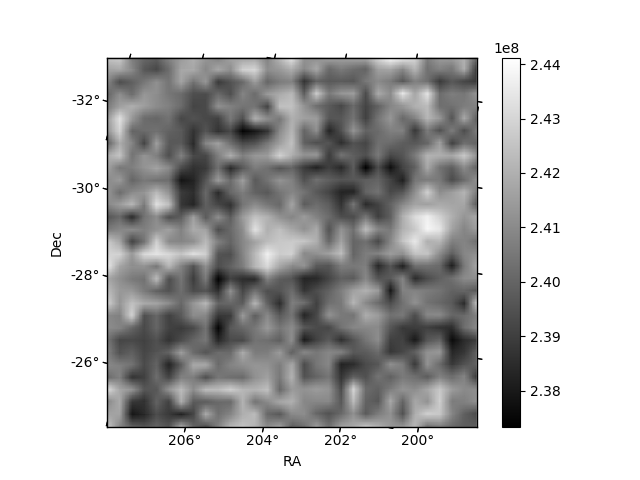
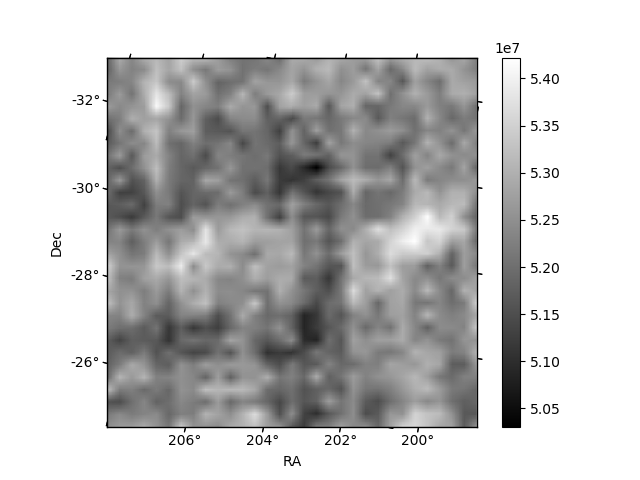
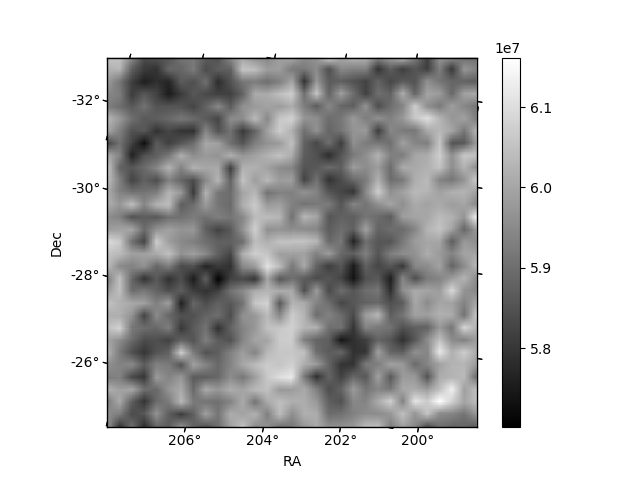
Histogram calculated using DETX and DETY for each event in the final _common_clean file
| Quadrant A | 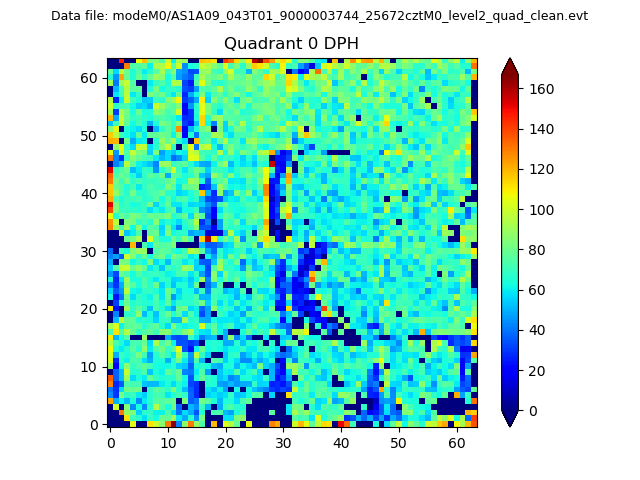 |
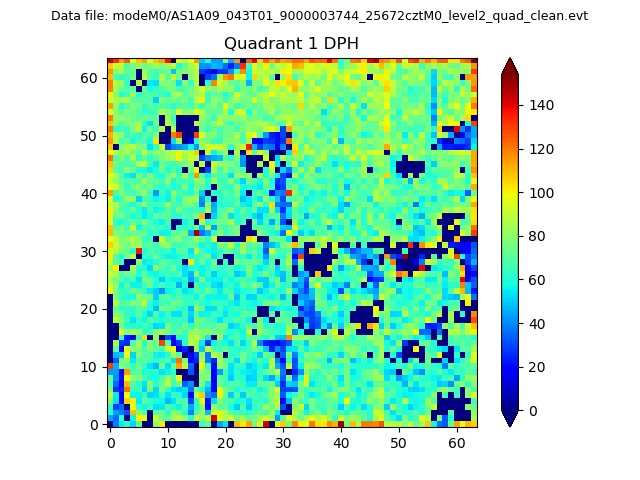 |
Quadrant B |
|---|---|---|---|
| Quadrant D | 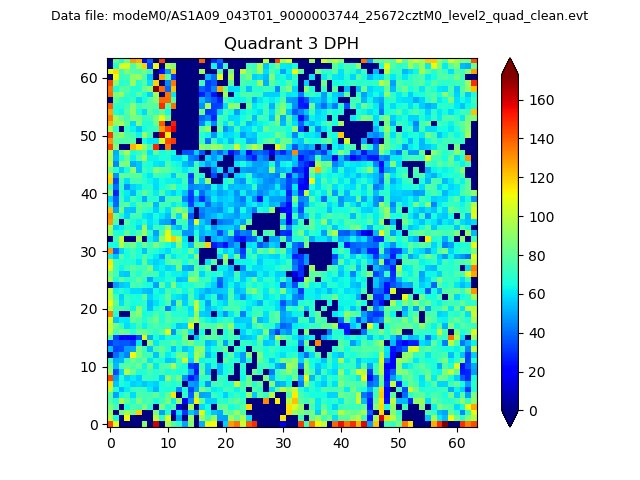 |
 |
Quadrant C |
| Plot type | Count rate plots | Images |
|---|---|---|
| Comparison with Poisson distribution Blue bars denote a histogram of data divided into 1 sec bins. Red curve is a Poisson curve with rate = median count rate of data. |
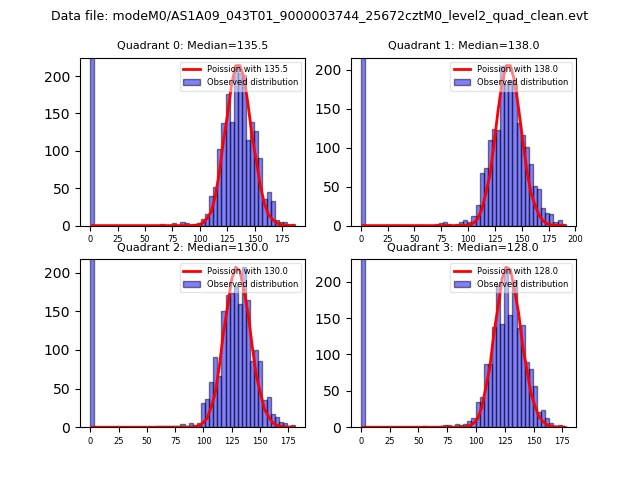 |
 |
| Quadrant-wise count rates Data is divided into 100 sec bins |
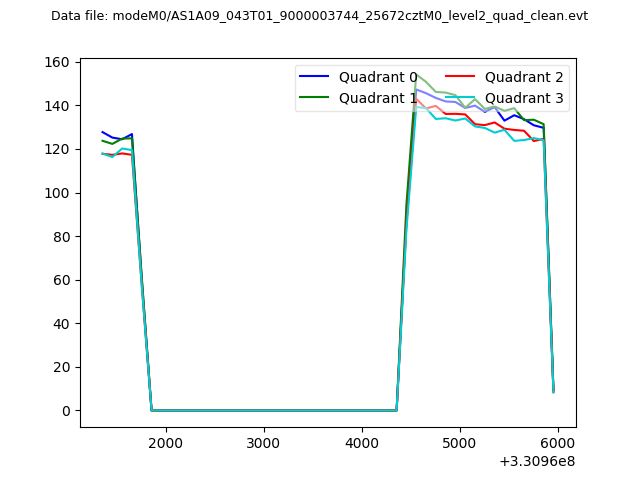 |
|
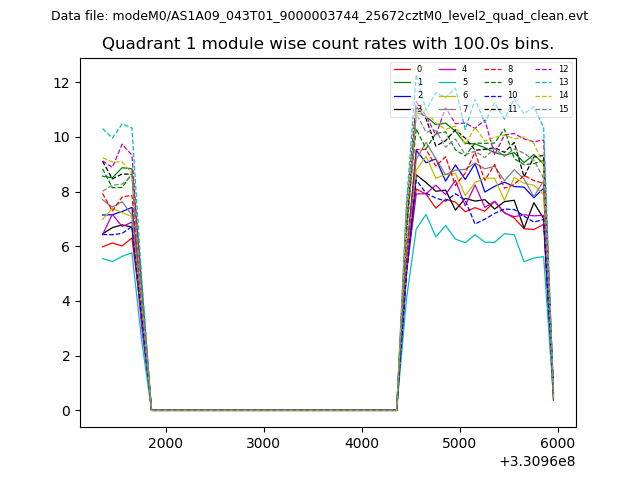
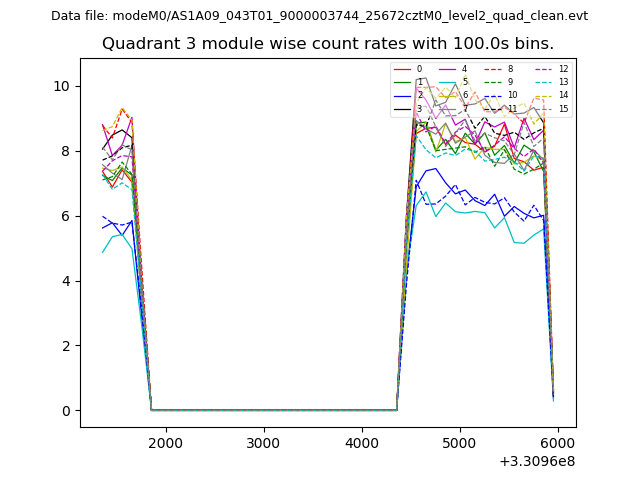
| Module-wise count rates for Quadrant A Data is divided into 100 sec bins |
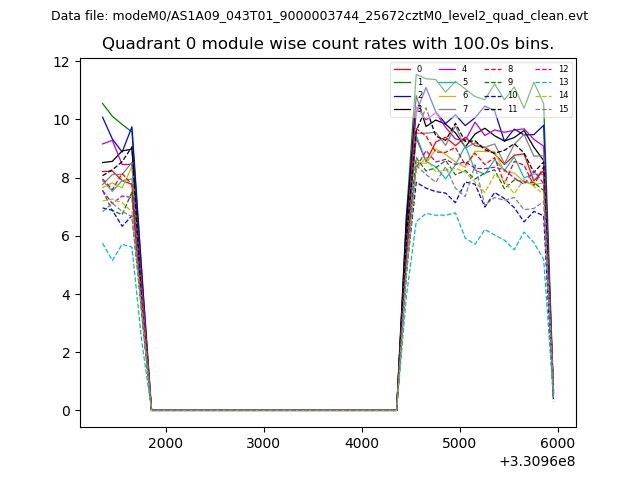 |
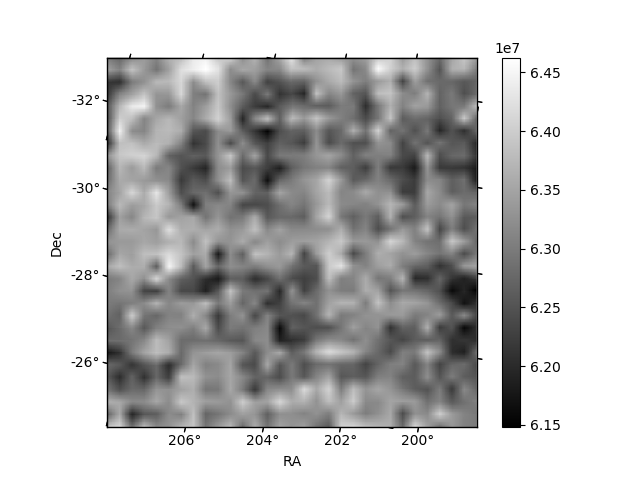 |
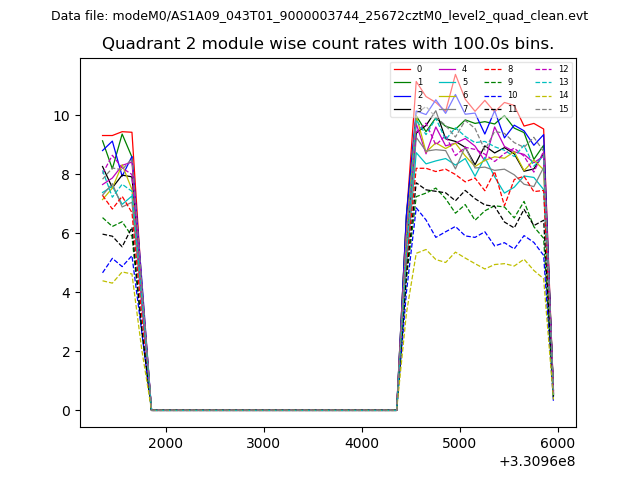
| Module-wise count rates for Quadrant B Data is divided into 100 sec bins |
 |
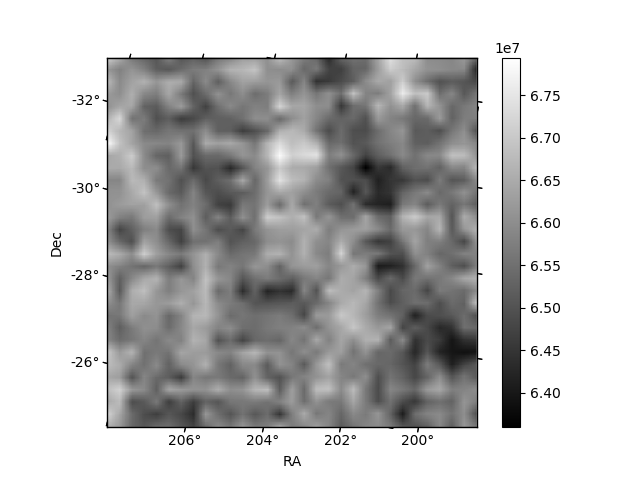 |
| Module-wise count rates for Quadrant C Data is divided into 100 sec bins |
 |
 |
| Module-wise count rates for Quadrant D Data is divided into 100 sec bins |
 |
 |
| Parameter | Plot |
|---|---|
| CZT HV Monitor | 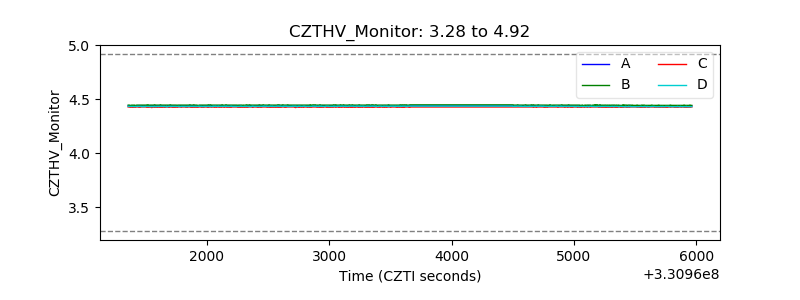 |
| D_VDD | 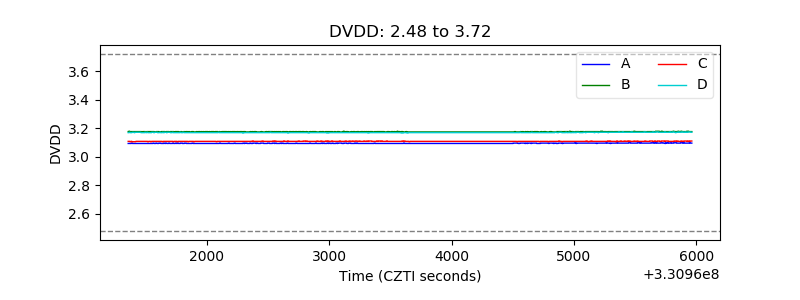 |
| Temperature 1 | 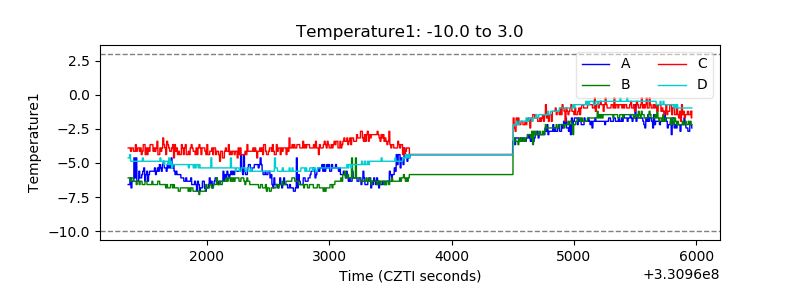 |
| Veto HV Monitor | 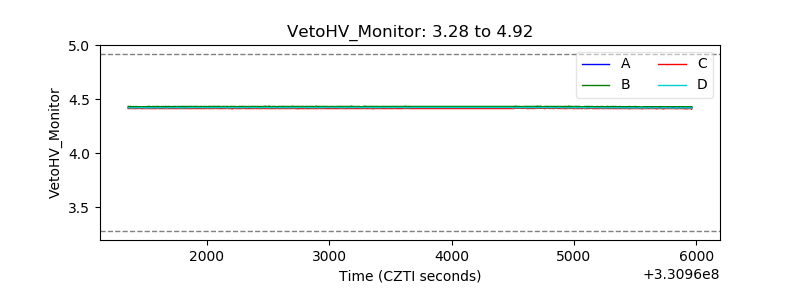 |
| Veto LLD | 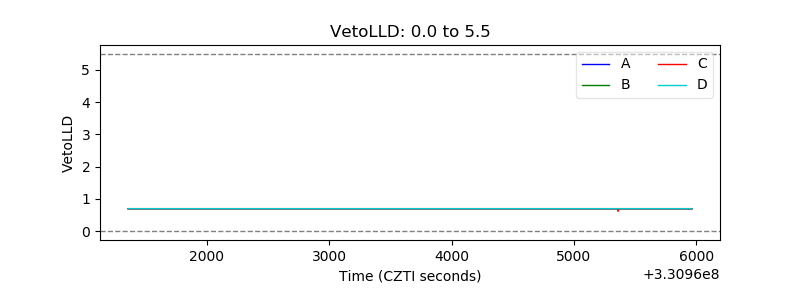 |
| Alpha Counter | 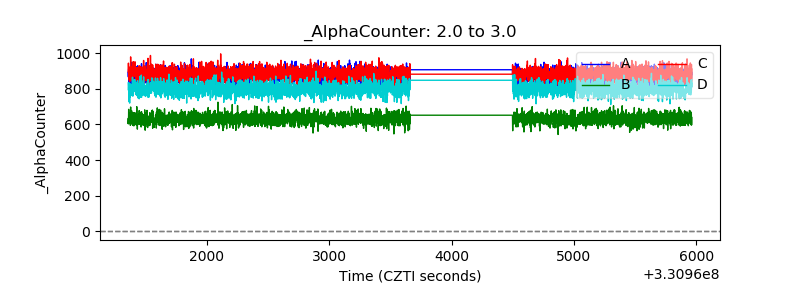 |
| _CPM_Rate | 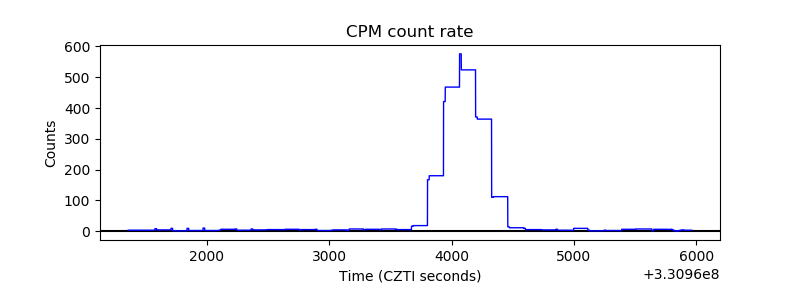 |
| CZT Counter | 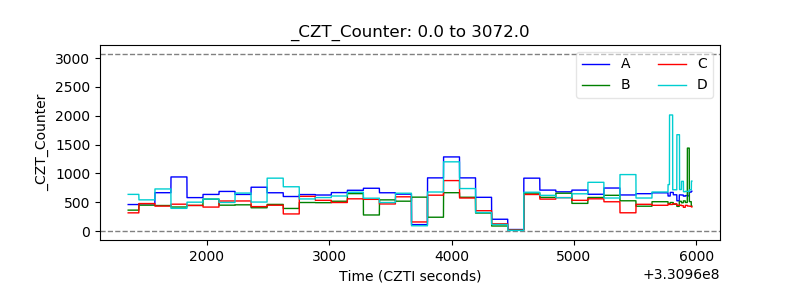 |
| +2.5 Volts monitor |  |
| +5 Volts monitor | 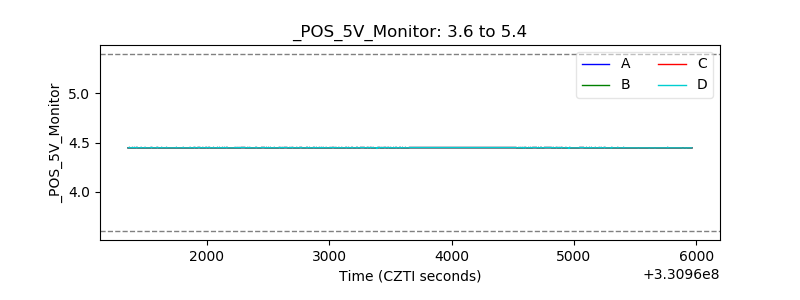 |
| _ROLL_ROT | 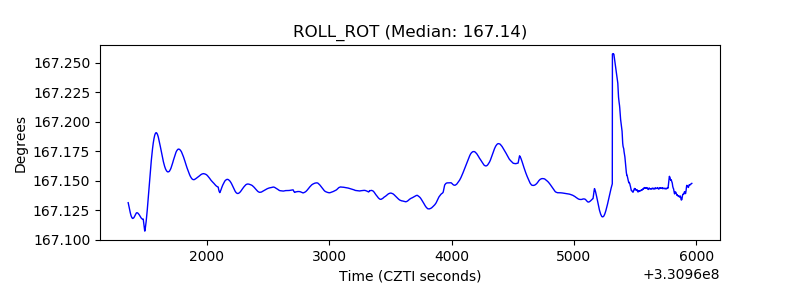 |
| _Roll_DEC | 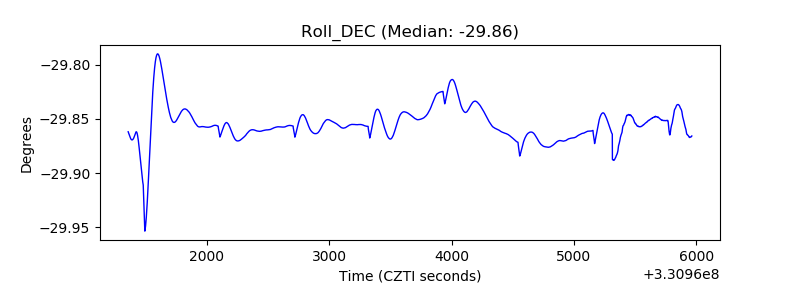 |
| _Roll_RA | 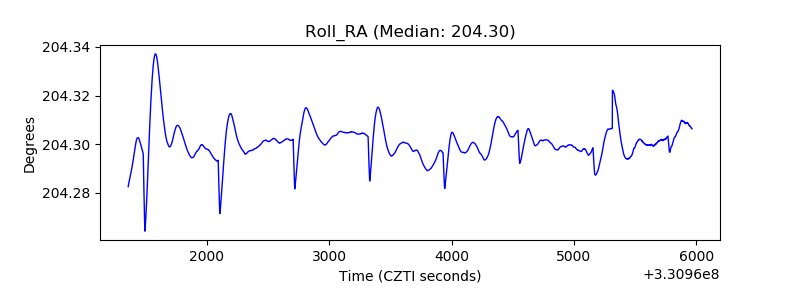 |
| Veto Counter | 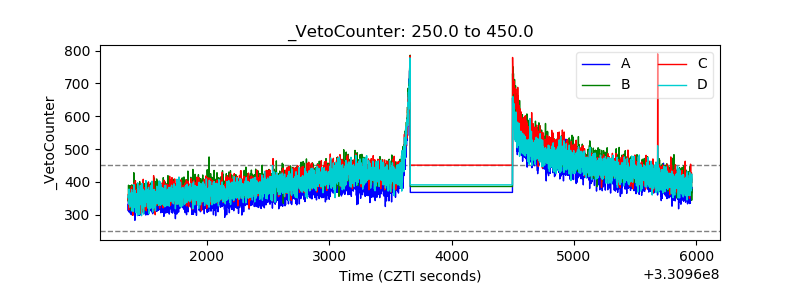 |