| Param | Original file | Final file |
|---|---|---|
| Filename | modeM0/AS1A09_043T01_9000003744_25673cztM0_level2.evt | modeM0/AS1A09_043T01_9000003744_25673cztM0_level2_quad_clean.evt |
| Size (bytes) | 447,298,560 | 84,340,800 |
| Size | 426.6 MB | 80.4 MB |
| Events in quadrant A | 3,227,288 | 549,179 |
| Events in quadrant B | 3,082,030 | 550,248 |
| Events in quadrant C | 2,945,546 | 517,056 |
| Events in quadrant D | 3,872,253 | 506,623 |
| Mode M9 | |||
|---|---|---|---|
| Quadrant | BADHDUFLAG | Total packets | Discarded packets |
| A | 0 | 10 | 0 |
| B | 0 | 10 | 0 |
| C | 0 | 10 | 0 |
| D | 0 | 10 | 0 |
| Mode M0 | |||
|---|---|---|---|
| Quadrant | BADHDUFLAG | Total packets | Discarded packets |
| A | 0 | 13829 | 0 |
| B | 0 | 13021 | 0 |
| C | 0 | 12722 | 0 |
| D | 0 | 15766 | 0 |
| Quadrant | Total seconds | Saturated seconds | Saturation percentage |
|---|---|---|---|
| A | 6171 | 34 | 0.550964% |
| B | 6171 | 37 | 0.599579% |
| C | 6172 | 65 | 1.053143% |
| D | 6171 | 88 | 1.426025% |
Noise dominated data is calculated using 1-second bins in cleaned event files. If a bin has >2000 counts, and if more than 50% of those come from <1% of pixels, then it is considered to be noise-dominated and hence unusable.
| Quadrant | # 1 sec bins | Bins with >0 counts | Bins with >2000 counts | High rate bins dominated by noise | Noise dominated (total time) | Noise dominated (detector-on time) | Marked lightcurve |
|---|---|---|---|---|---|---|---|
| A | 7166 | 6172 | 0 | 0 | 0.00% | 0.00% | 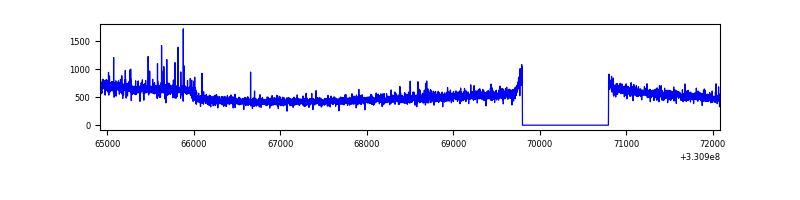 |
| B | 7166 | 6172 | 4 | 4 | 0.06% | 0.06% | 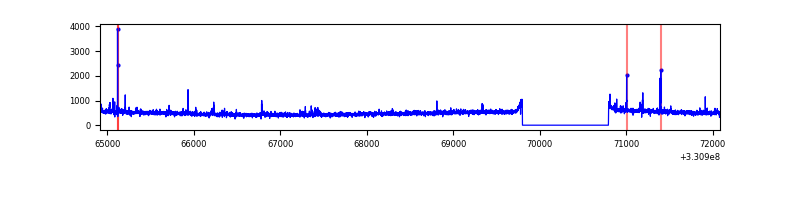 |
| C | 7167 | 6173 | 0 | 0 | 0.00% | 0.00% | 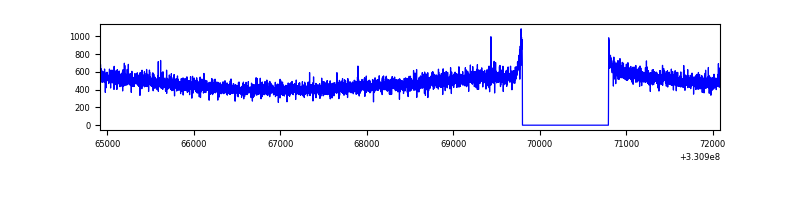 |
| D | 7166 | 6172 | 57 | 57 | 0.80% | 0.92% | 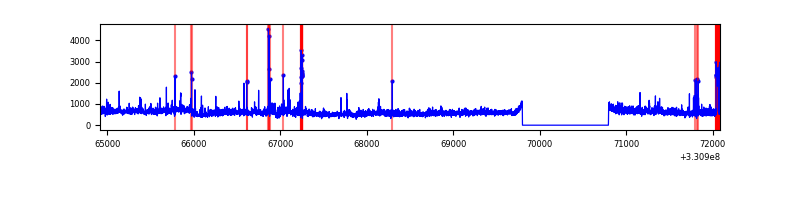 |
Top three noisy pixels from each quadrant. If the there are fewer than three noisy pixels in the level2.evt file, extra rows are filled as -1
| Pixel properties | Quadrant properties | ||||||
|---|---|---|---|---|---|---|---|
| Quadrant | DetID | PixID | Counts | Sigma | Mean | Median | Sigma |
| A | 8 | 192 | 263292 | 1679.95 | 767 | 751 | 156.3 |
| A | 13 | 254 | 9759 | 57.64 | 767 | 751 | 156.3 |
| A | 3 | 137 | 7003 | 40.01 | 767 | 751 | 156.3 |
| B | 3 | 112 | 43051 | 288.83 | 759 | 742 | 146.5 |
| B | 0 | 190 | 32581 | 217.36 | 759 | 742 | 146.5 |
| B | 0 | 245 | 22237 | 146.74 | 759 | 742 | 146.5 |
| C | 14 | 238 | 116213 | 676.74 | 724 | 728 | 170.6 |
| C | 3 | 233 | 7186 | 37.84 | 724 | 728 | 170.6 |
| C | 13 | 61 | 5077 | 25.49 | 724 | 728 | 170.6 |
| D | 8 | 195 | 752493 | 4202.79 | 735 | 715 | 178.9 |
| D | 1 | 52 | 86570 | 479.97 | 735 | 715 | 178.9 |
| D | 5 | 233 | 76453 | 423.41 | 735 | 715 | 178.9 |
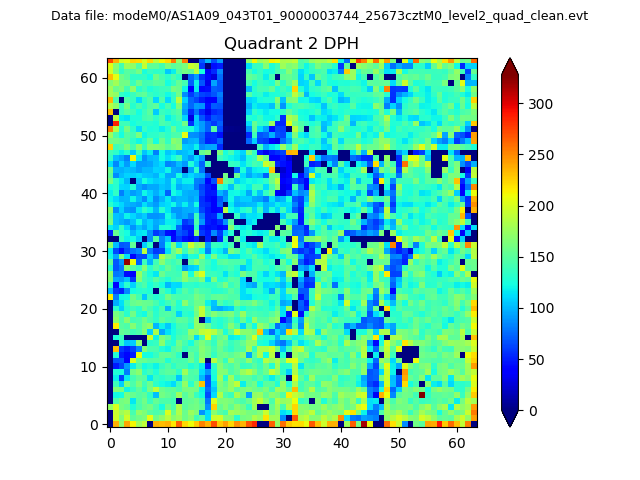
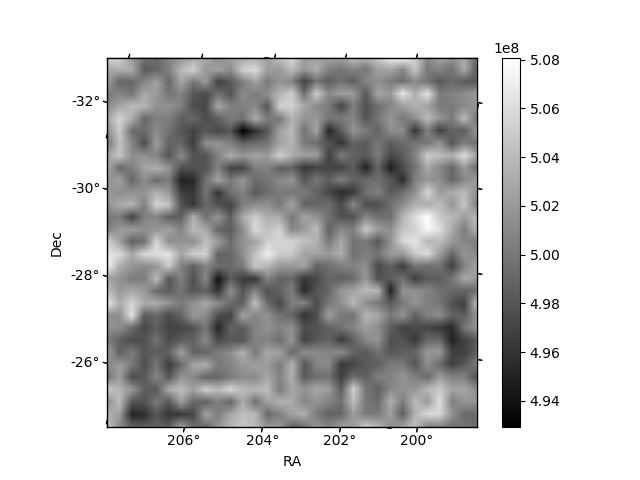
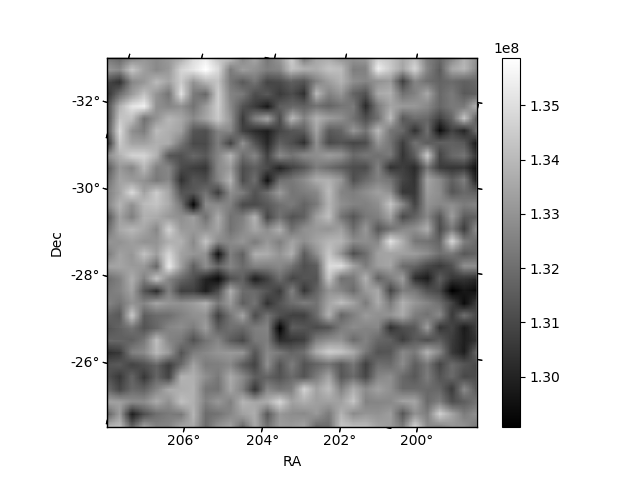
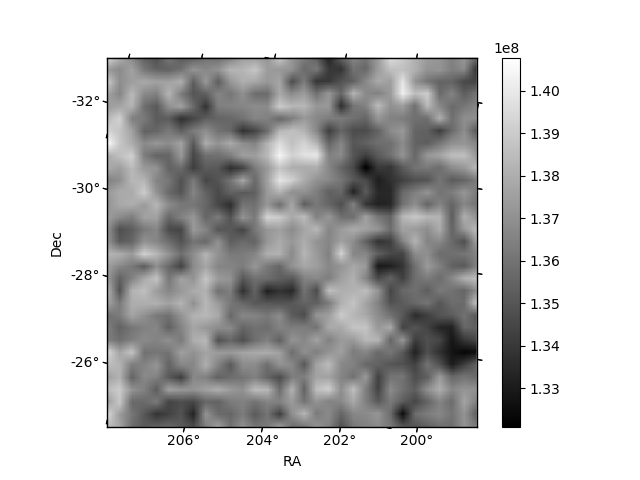
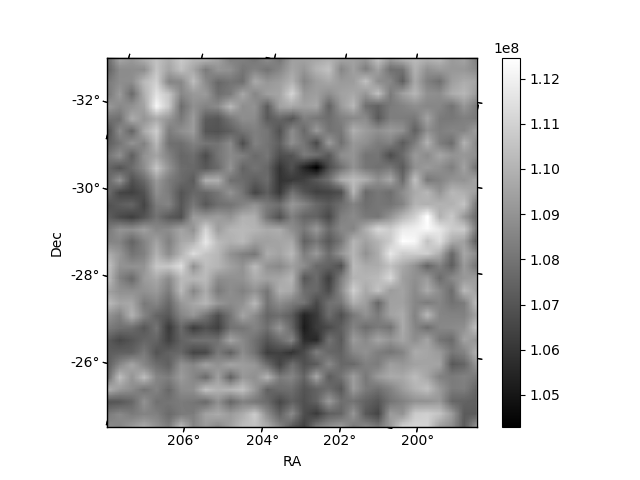
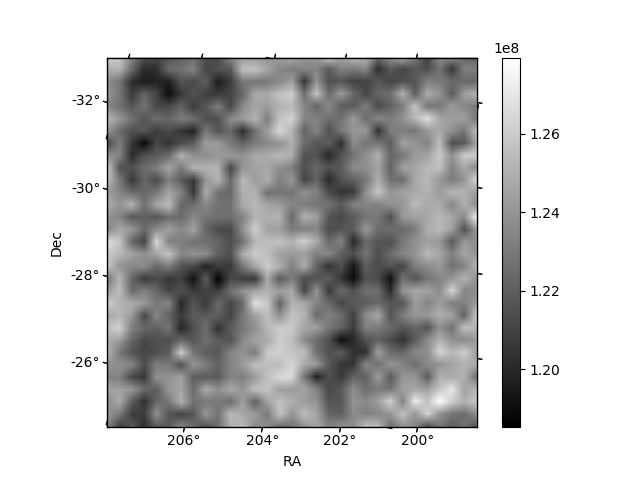
Histogram calculated using DETX and DETY for each event in the final _common_clean file
| Quadrant A | 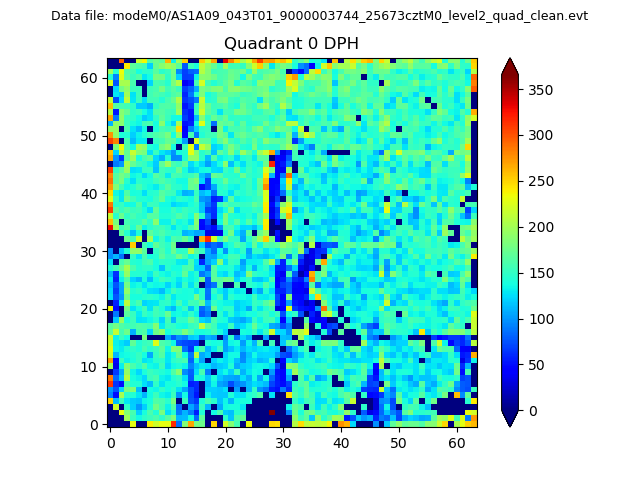 |
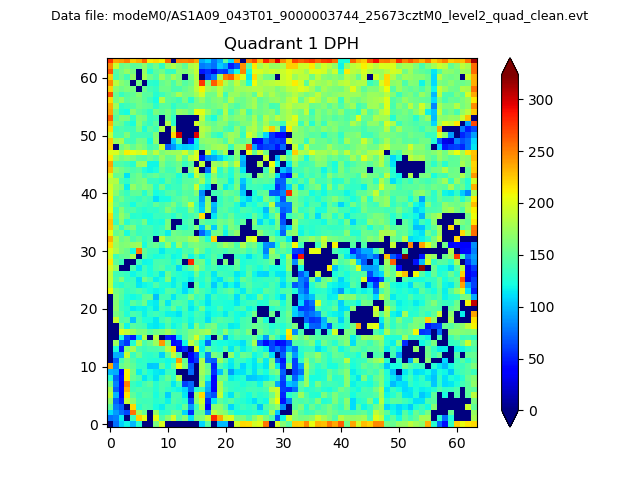 |
Quadrant B |
|---|---|---|---|
| Quadrant D | 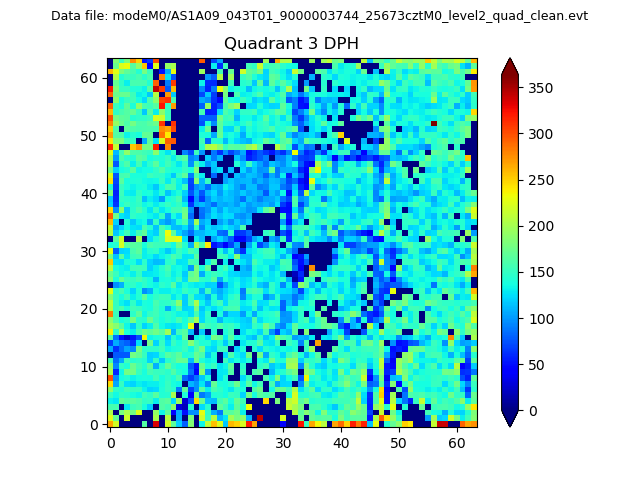 |
 |
Quadrant C |
| Plot type | Count rate plots | Images |
|---|---|---|
| Comparison with Poisson distribution Blue bars denote a histogram of data divided into 1 sec bins. Red curve is a Poisson curve with rate = median count rate of data. |
 |
 |
| Quadrant-wise count rates Data is divided into 100 sec bins |
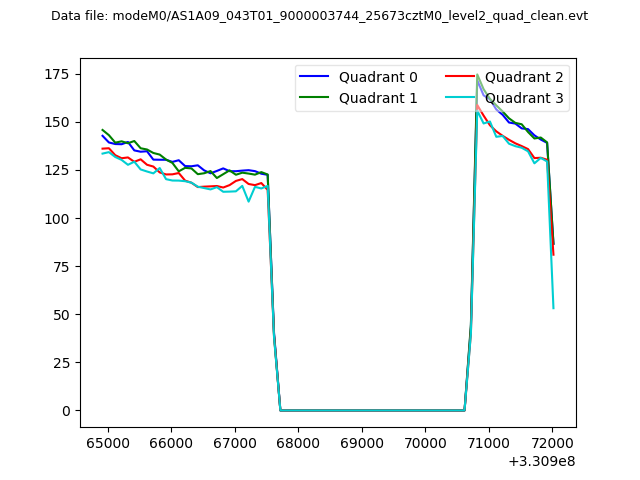 |
|
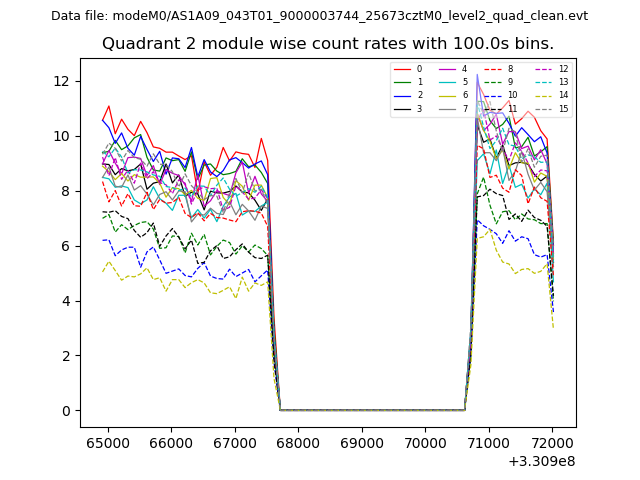
| Module-wise count rates for Quadrant A Data is divided into 100 sec bins |
 |
 |
| Module-wise count rates for Quadrant B Data is divided into 100 sec bins |
 |
 |
| Module-wise count rates for Quadrant C Data is divided into 100 sec bins |
 |
 |
| Module-wise count rates for Quadrant D Data is divided into 100 sec bins |
 |
 |
| Parameter | Plot |
|---|---|
| CZT HV Monitor | 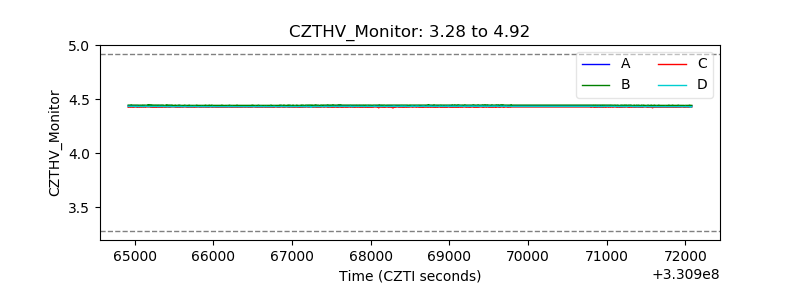 |
| D_VDD | 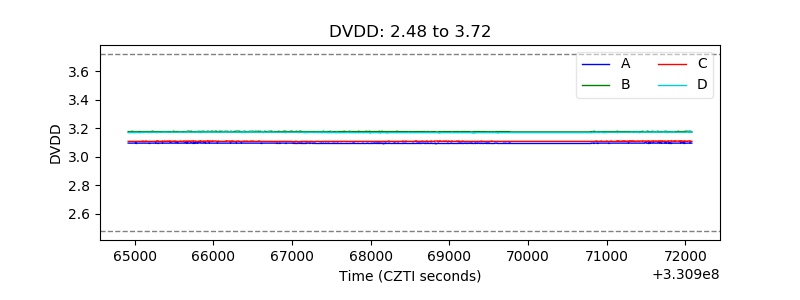 |
| Temperature 1 | 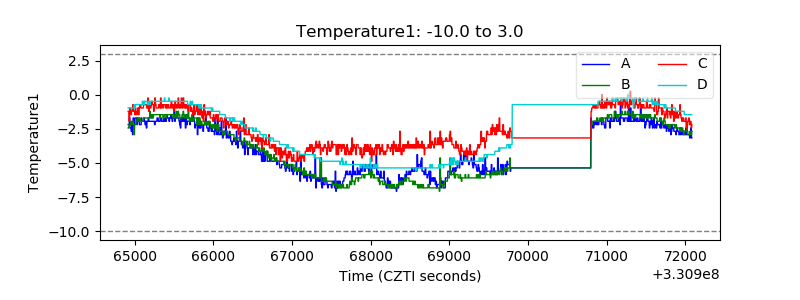 |
| Veto HV Monitor |  |
| Veto LLD | 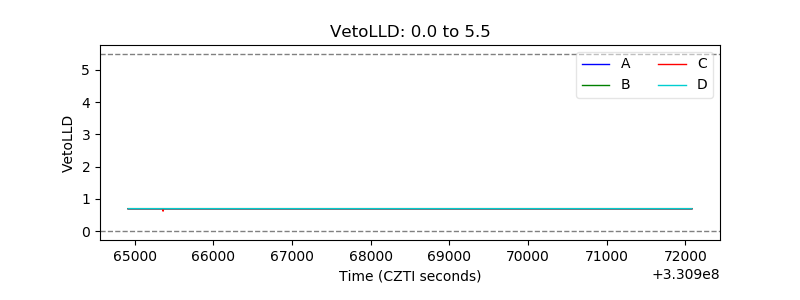 |
| Alpha Counter | 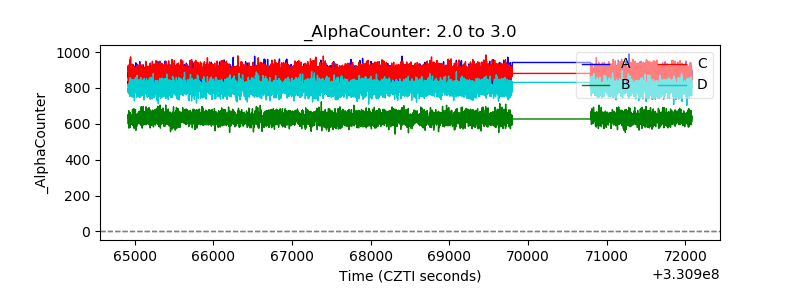 |
| _CPM_Rate | 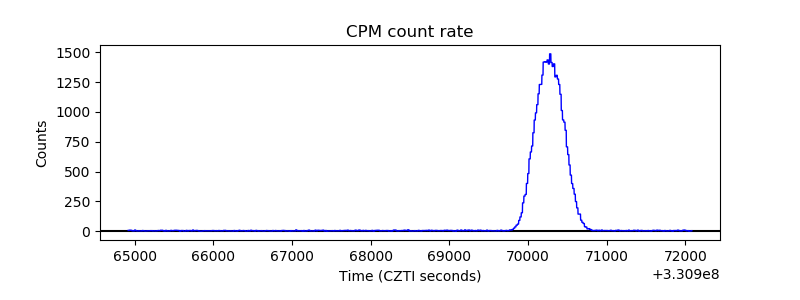 |
| CZT Counter | 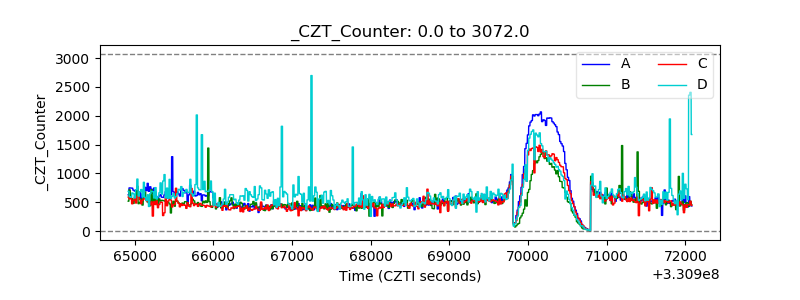 |
| +2.5 Volts monitor |  |
| +5 Volts monitor |  |
| _ROLL_ROT | 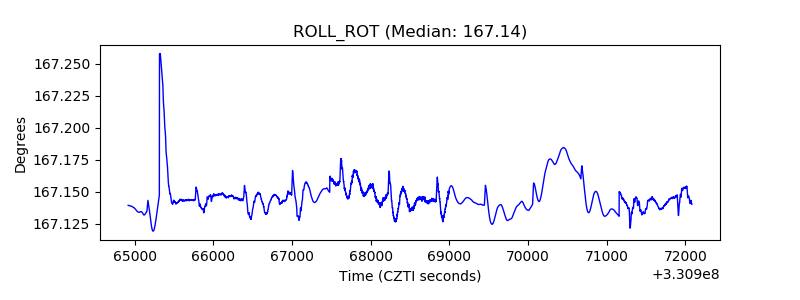 |
| _Roll_DEC |  |
| _Roll_RA | 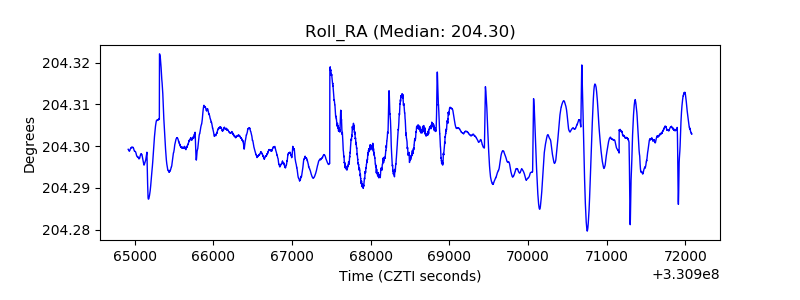 |
| Veto Counter |  |