| Param | Original file | Final file |
|---|---|---|
| Filename | modeM0/AS1A09_043T01_9000003744_25675cztM0_level2.evt | modeM0/AS1A09_043T01_9000003744_25675cztM0_level2_quad_clean.evt |
| Size (bytes) | 479,275,200 | 94,763,520 |
| Size | 457.1 MB | 90.4 MB |
| Events in quadrant A | 3,339,933 | 627,806 |
| Events in quadrant B | 3,355,233 | 630,621 |
| Events in quadrant C | 3,194,173 | 586,876 |
| Events in quadrant D | 4,184,544 | 571,467 |
| Mode M9 | |||
|---|---|---|---|
| Quadrant | BADHDUFLAG | Total packets | Discarded packets |
| A | 0 | 18 | 0 |
| B | 0 | 19 | 0 |
| C | 0 | 19 | 0 |
| D | 0 | 19 | 0 |
| Mode M0 | |||
|---|---|---|---|
| Quadrant | BADHDUFLAG | Total packets | Discarded packets |
| A | 0 | 14000 | 0 |
| B | 0 | 14102 | 0 |
| C | 0 | 13662 | 0 |
| D | 0 | 16901 | 0 |
| Quadrant | Total seconds | Saturated seconds | Saturation percentage |
|---|---|---|---|
| A | 6495 | 34 | 0.523480% |
| B | 6495 | 55 | 0.846805% |
| C | 6495 | 64 | 0.985373% |
| D | 6495 | 151 | 2.324865% |
Noise dominated data is calculated using 1-second bins in cleaned event files. If a bin has >2000 counts, and if more than 50% of those come from <1% of pixels, then it is considered to be noise-dominated and hence unusable.
| Quadrant | # 1 sec bins | Bins with >0 counts | Bins with >2000 counts | High rate bins dominated by noise | Noise dominated (total time) | Noise dominated (detector-on time) | Marked lightcurve |
|---|---|---|---|---|---|---|---|
| A | 7620 | 6495 | 0 | 0 | 0.00% | 0.00% | 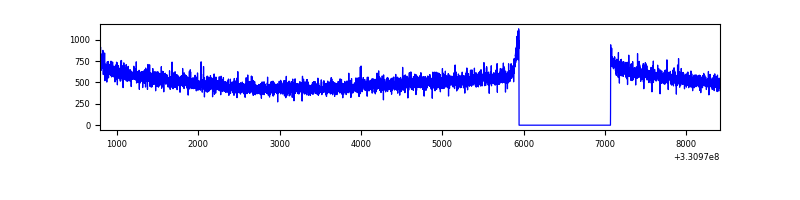 |
| B | 7620 | 6496 | 7 | 7 | 0.09% | 0.11% | 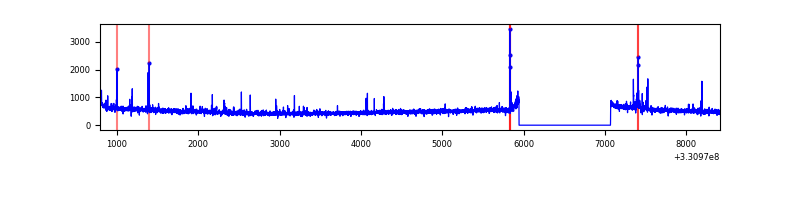 |
| C | 7620 | 6496 | 0 | 0 | 0.00% | 0.00% | 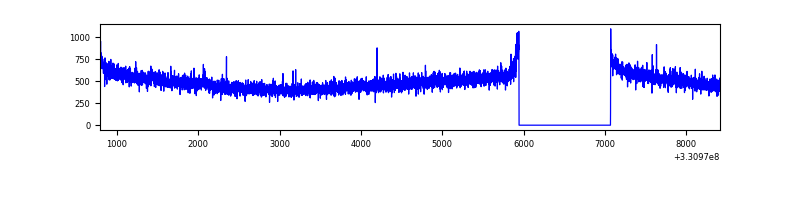 |
| D | 7620 | 6495 | 97 | 97 | 1.27% | 1.49% | 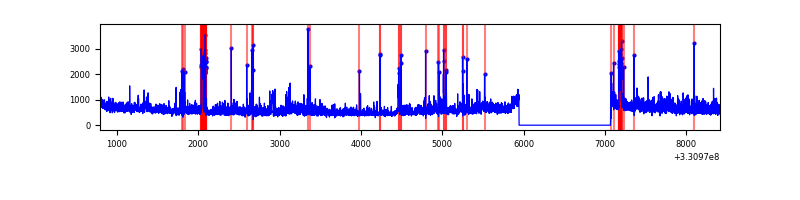 |
Top three noisy pixels from each quadrant. If the there are fewer than three noisy pixels in the level2.evt file, extra rows are filled as -1
| Pixel properties | Quadrant properties | ||||||
|---|---|---|---|---|---|---|---|
| Quadrant | DetID | PixID | Counts | Sigma | Mean | Median | Sigma |
| A | 8 | 192 | 120630 | 711.48 | 834 | 820 | 168.4 |
| A | 13 | 254 | 9884 | 53.83 | 834 | 820 | 168.4 |
| A | 3 | 137 | 7612 | 40.33 | 834 | 820 | 168.4 |
| B | 3 | 112 | 81936 | 520.39 | 825 | 808 | 155.9 |
| B | 12 | 111 | 18662 | 114.52 | 825 | 808 | 155.9 |
| B | 0 | 190 | 18501 | 113.49 | 825 | 808 | 155.9 |
| C | 14 | 238 | 125908 | 686.16 | 782 | 789 | 182.3 |
| C | 3 | 233 | 13872 | 71.75 | 782 | 789 | 182.3 |
| C | 13 | 61 | 5531 | 26.01 | 782 | 789 | 182.3 |
| D | 8 | 195 | 602508 | 3118.42 | 790 | 769 | 193.0 |
| D | 5 | 233 | 217216 | 1121.7 | 790 | 769 | 193.0 |
| D | 2 | 244 | 116748 | 601.04 | 790 | 769 | 193.0 |
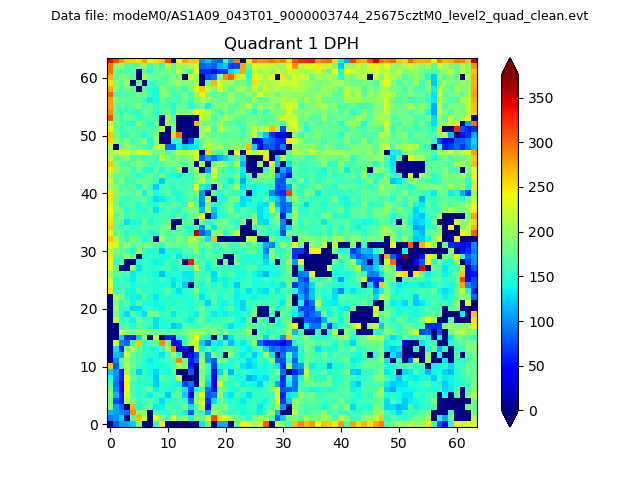
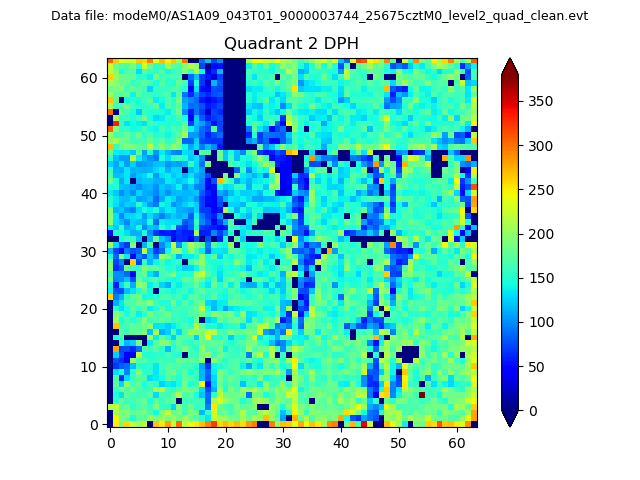
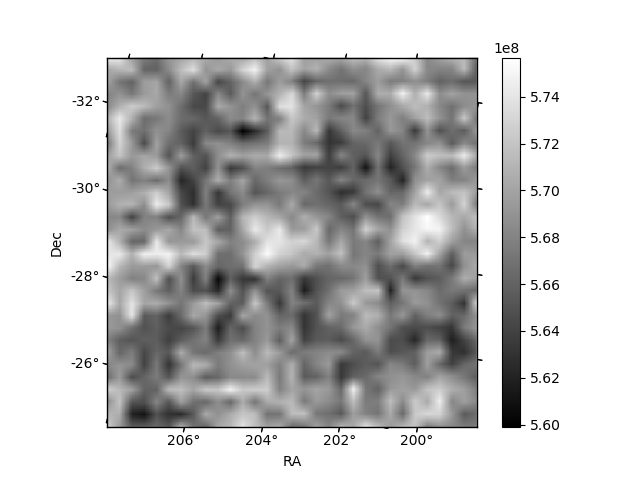
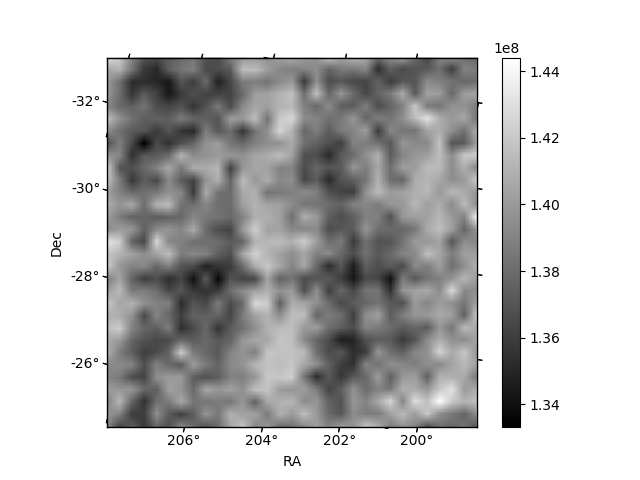
Histogram calculated using DETX and DETY for each event in the final _common_clean file
| Quadrant A |  |
 |
Quadrant B |
|---|---|---|---|
| Quadrant D | 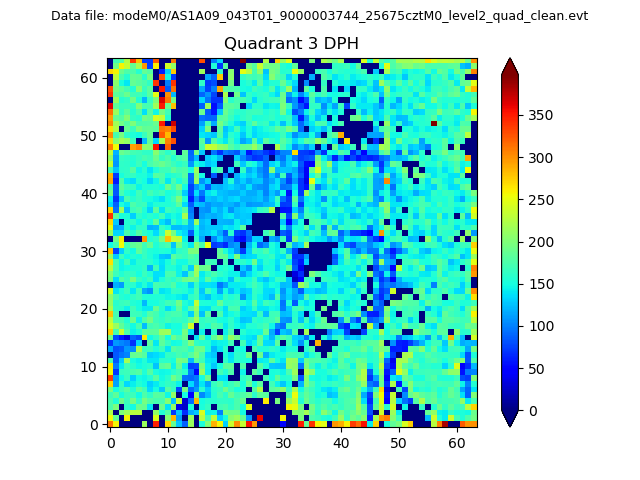 |
 |
Quadrant C |
| Plot type | Count rate plots | Images |
|---|---|---|
| Comparison with Poisson distribution Blue bars denote a histogram of data divided into 1 sec bins. Red curve is a Poisson curve with rate = median count rate of data. |
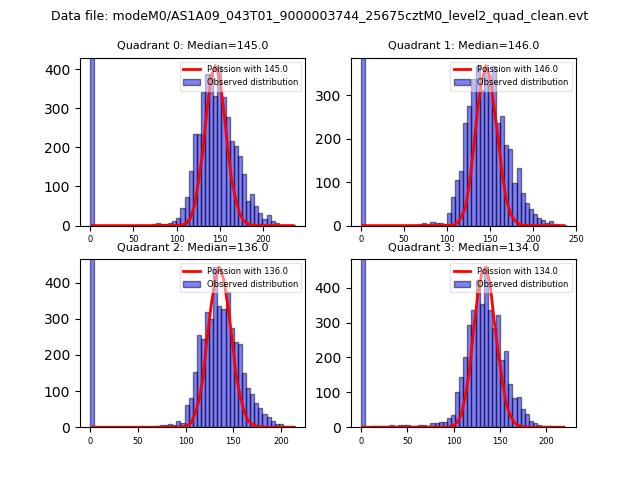 |
 |
| Quadrant-wise count rates Data is divided into 100 sec bins |
 |
|
| Module-wise count rates for Quadrant A Data is divided into 100 sec bins |
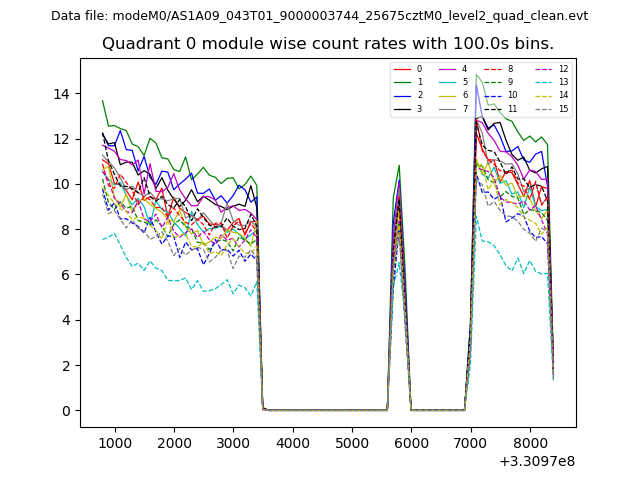 |
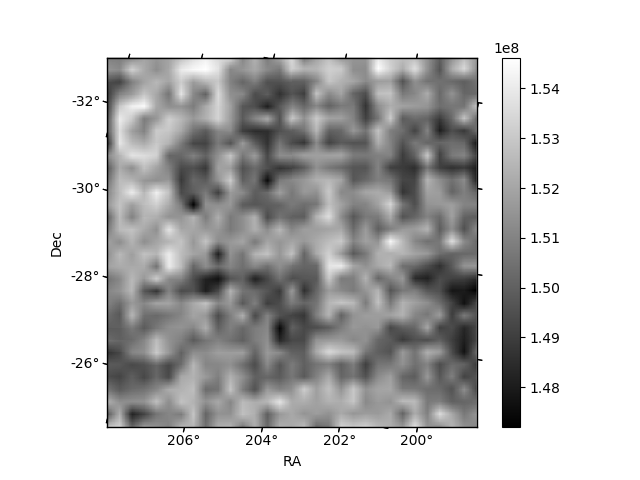 |
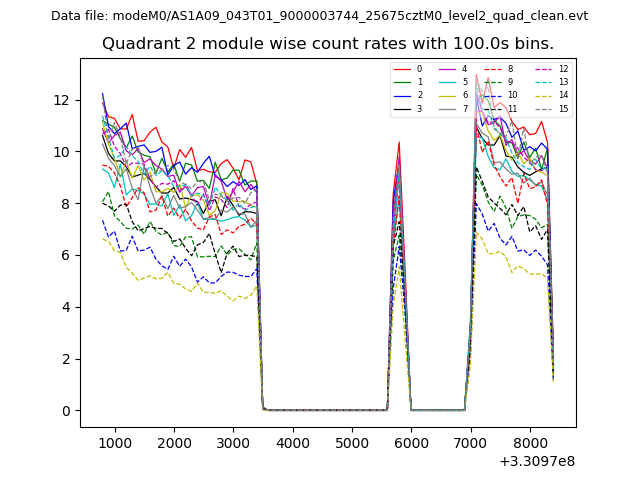
| Module-wise count rates for Quadrant B Data is divided into 100 sec bins |
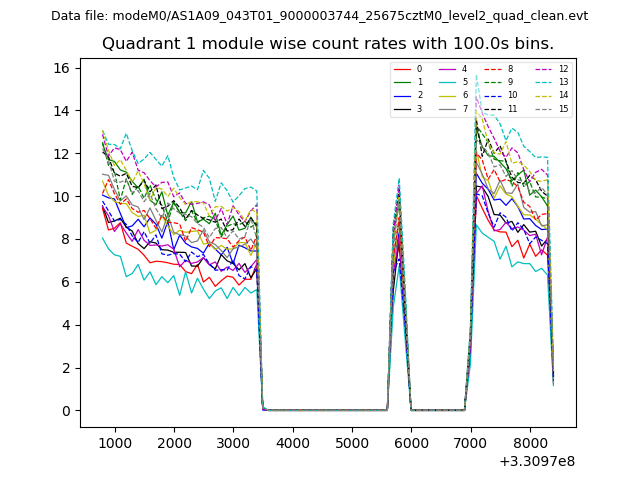 |
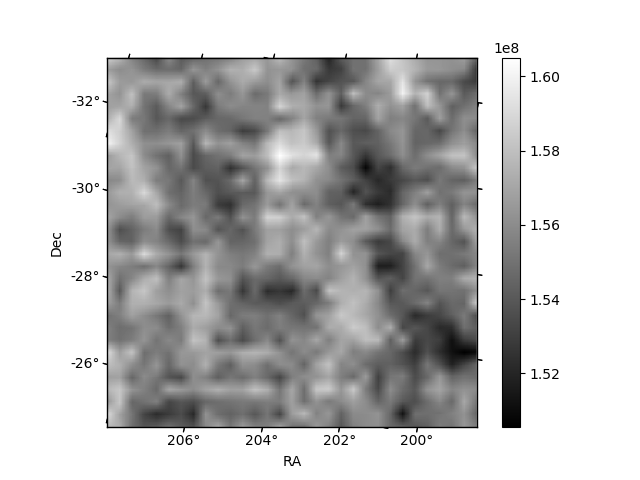 |
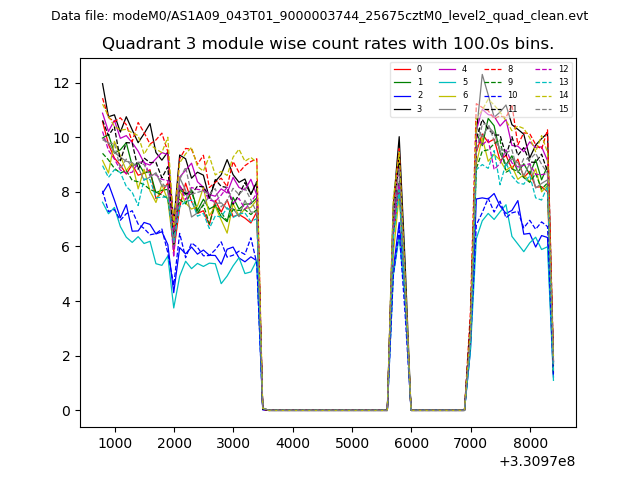
| Module-wise count rates for Quadrant C Data is divided into 100 sec bins |
 |
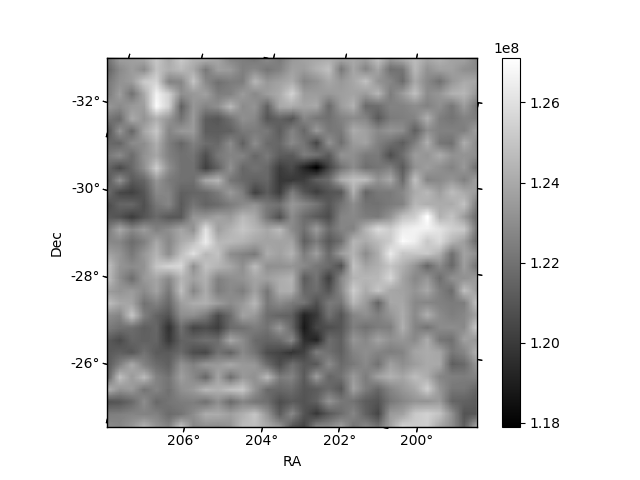 |
| Module-wise count rates for Quadrant D Data is divided into 100 sec bins |
 |
 |
| Parameter | Plot |
|---|---|
| CZT HV Monitor | 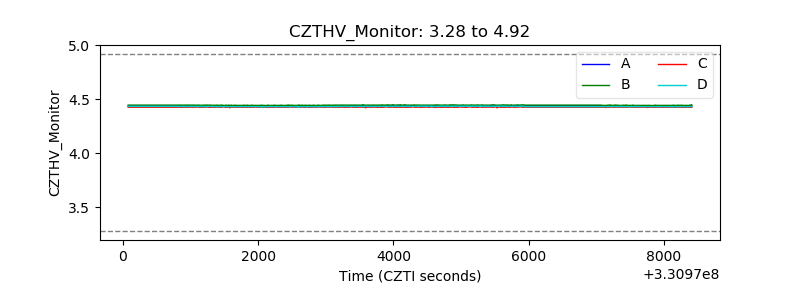 |
| D_VDD | 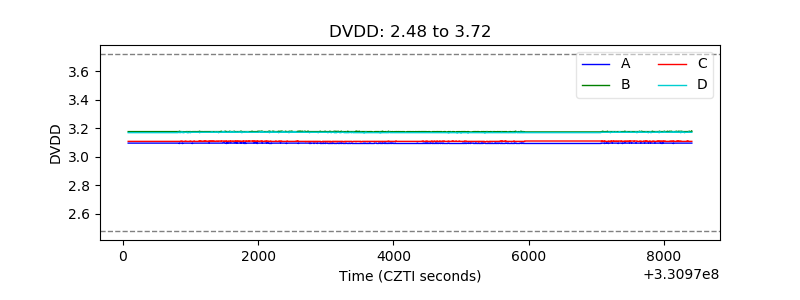 |
| Temperature 1 | 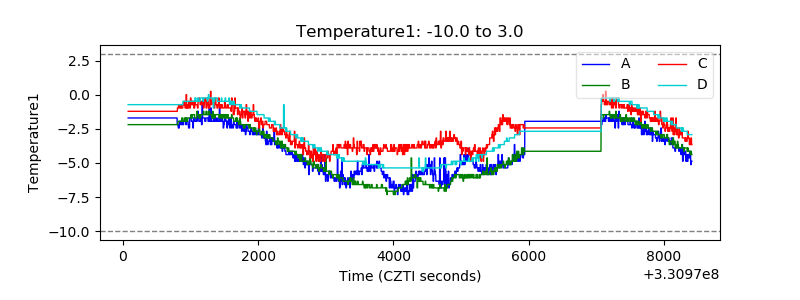 |
| Veto HV Monitor | 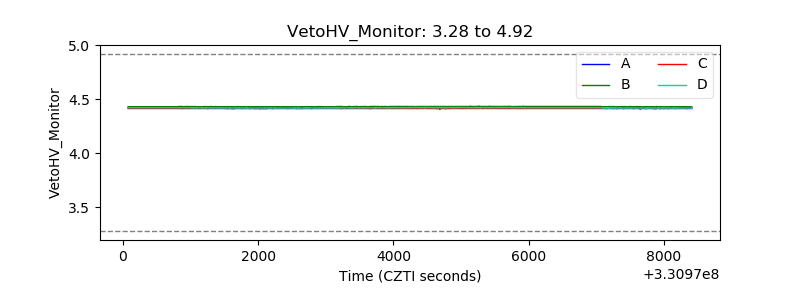 |
| Veto LLD | 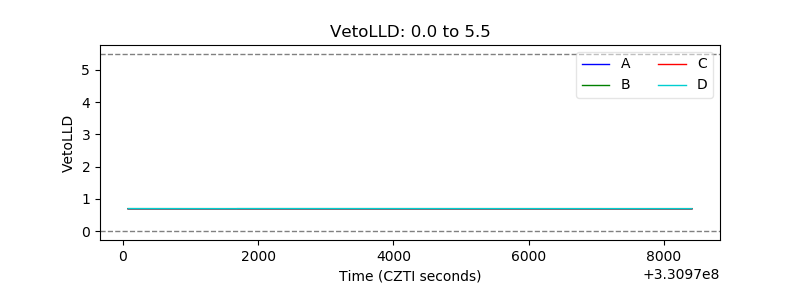 |
| Alpha Counter |  |
| _CPM_Rate | 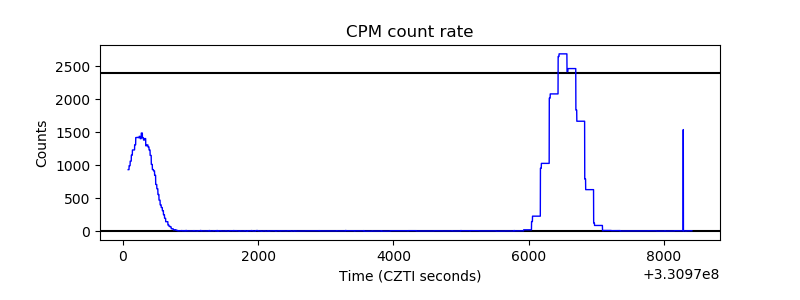 |
| CZT Counter | 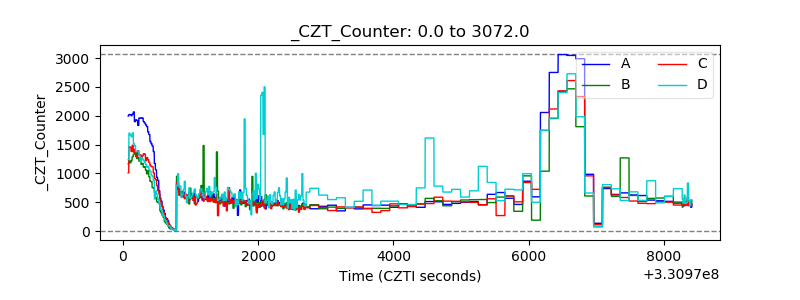 |
| +2.5 Volts monitor |  |
| +5 Volts monitor |  |
| _ROLL_ROT | 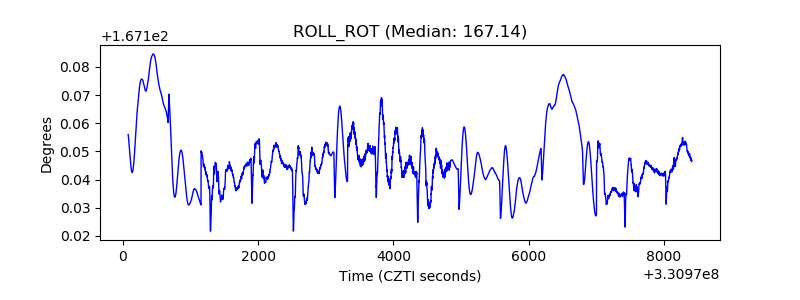 |
| _Roll_DEC |  |
| _Roll_RA | 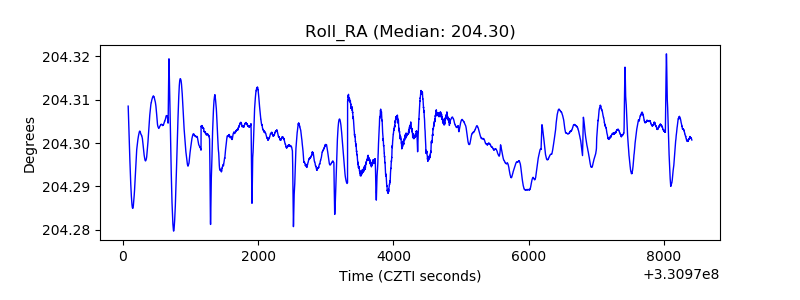 |
| Veto Counter | 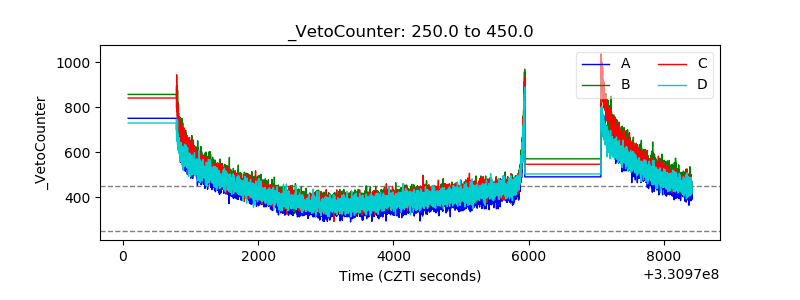 |