| Param | Original file | Final file |
|---|---|---|
| Filename | modeM0/AS1A09_043T01_9000003744_25676cztM0_level2.evt | modeM0/AS1A09_043T01_9000003744_25676cztM0_level2_quad_clean.evt |
| Size (bytes) | 490,210,560 | 96,471,360 |
| Size | 467.5 MB | 92.0 MB |
| Events in quadrant A | 3,333,614 | 642,237 |
| Events in quadrant B | 3,352,900 | 653,165 |
| Events in quadrant C | 3,197,529 | 604,560 |
| Events in quadrant D | 4,533,334 | 580,705 |
| Mode M9 | |||
|---|---|---|---|
| Quadrant | BADHDUFLAG | Total packets | Discarded packets |
| A | 0 | 21 | 0 |
| B | 0 | 22 | 0 |
| C | 0 | 22 | 0 |
| D | 0 | 22 | 0 |
| Mode M0 | |||
|---|---|---|---|
| Quadrant | BADHDUFLAG | Total packets | Discarded packets |
| A | 0 | 13816 | 0 |
| B | 0 | 13918 | 0 |
| C | 0 | 13457 | 0 |
| D | 0 | 17739 | 0 |
| Quadrant | Total seconds | Saturated seconds | Saturation percentage |
|---|---|---|---|
| A | 6313 | 49 | 0.776176% |
| B | 6313 | 59 | 0.934579% |
| C | 6313 | 73 | 1.156344% |
| D | 6313 | 160 | 2.534453% |
Noise dominated data is calculated using 1-second bins in cleaned event files. If a bin has >2000 counts, and if more than 50% of those come from <1% of pixels, then it is considered to be noise-dominated and hence unusable.
| Quadrant | # 1 sec bins | Bins with >0 counts | Bins with >2000 counts | High rate bins dominated by noise | Noise dominated (total time) | Noise dominated (detector-on time) | Marked lightcurve |
|---|---|---|---|---|---|---|---|
| A | 7553 | 6314 | 0 | 0 | 0.00% | 0.00% | 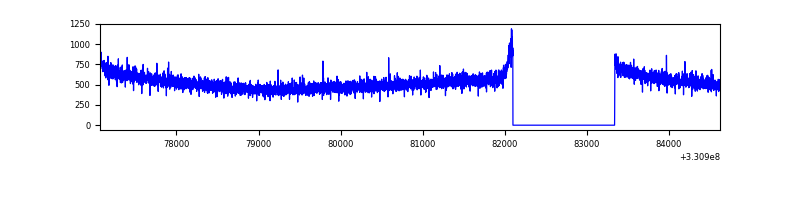 |
| B | 7553 | 6313 | 2 | 2 | 0.03% | 0.03% | 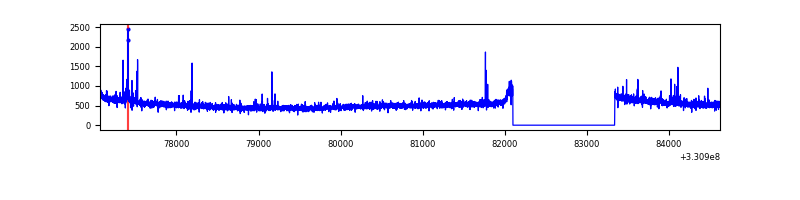 |
| C | 7553 | 6313 | 0 | 0 | 0.00% | 0.00% | 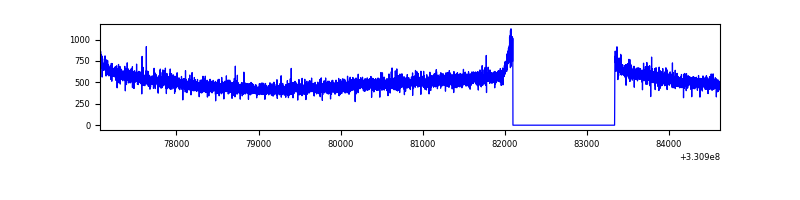 |
| D | 7553 | 6314 | 119 | 119 | 1.58% | 1.88% | 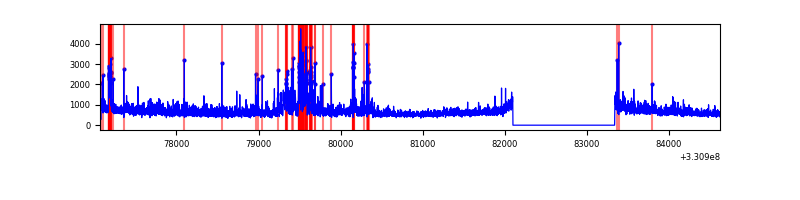 |
Top three noisy pixels from each quadrant. If the there are fewer than three noisy pixels in the level2.evt file, extra rows are filled as -1
| Pixel properties | Quadrant properties | ||||||
|---|---|---|---|---|---|---|---|
| Quadrant | DetID | PixID | Counts | Sigma | Mean | Median | Sigma |
| A | 8 | 192 | 122036 | 732.54 | 832 | 819 | 165.5 |
| A | 13 | 254 | 9557 | 52.81 | 832 | 819 | 165.5 |
| A | 3 | 137 | 7297 | 39.15 | 832 | 819 | 165.5 |
| B | 3 | 112 | 79532 | 501.77 | 830 | 814 | 156.9 |
| B | 12 | 111 | 18241 | 111.08 | 830 | 814 | 156.9 |
| B | 11 | 111 | 16414 | 99.44 | 830 | 814 | 156.9 |
| C | 14 | 238 | 126935 | 690.78 | 784 | 790 | 182.6 |
| C | 3 | 233 | 11553 | 58.94 | 784 | 790 | 182.6 |
| C | 13 | 61 | 5510 | 25.85 | 784 | 790 | 182.6 |
| D | 8 | 195 | 620535 | 3234.39 | 784 | 761 | 191.6 |
| D | 1 | 52 | 487052 | 2537.79 | 784 | 761 | 191.6 |
| D | 5 | 233 | 160132 | 831.7 | 784 | 761 | 191.6 |
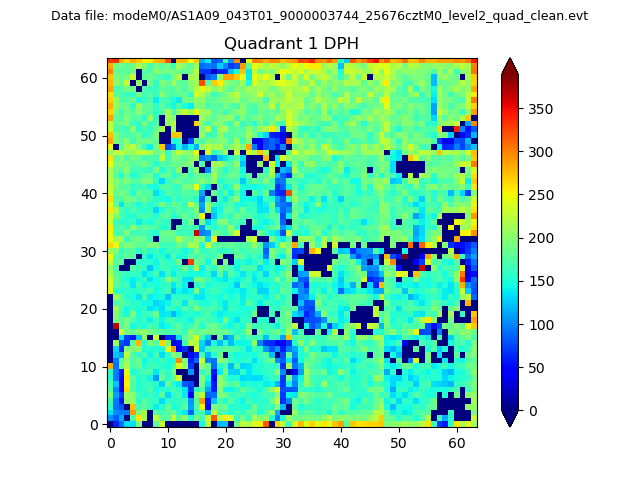
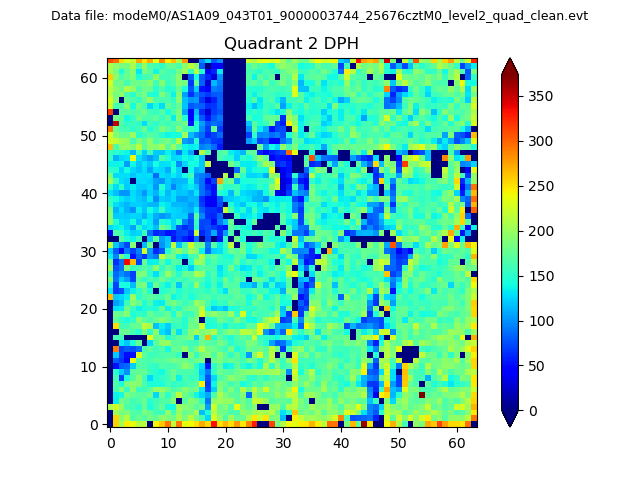
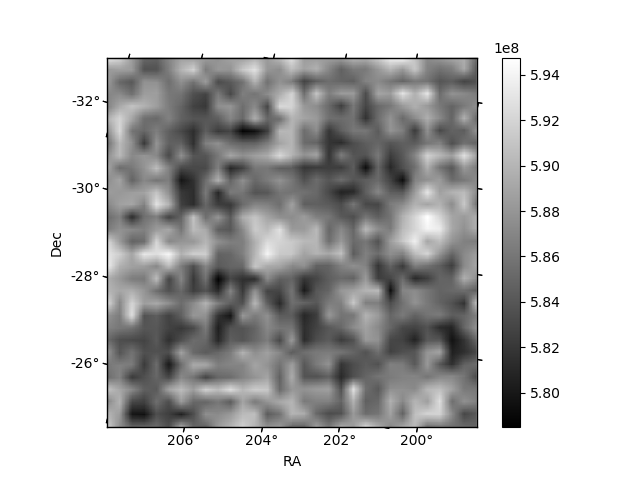
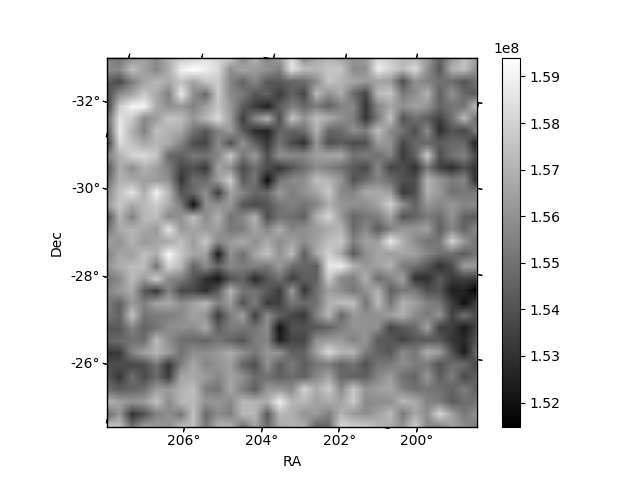
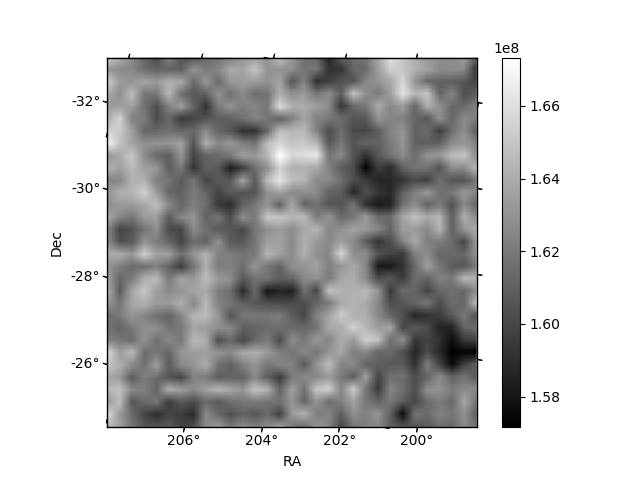
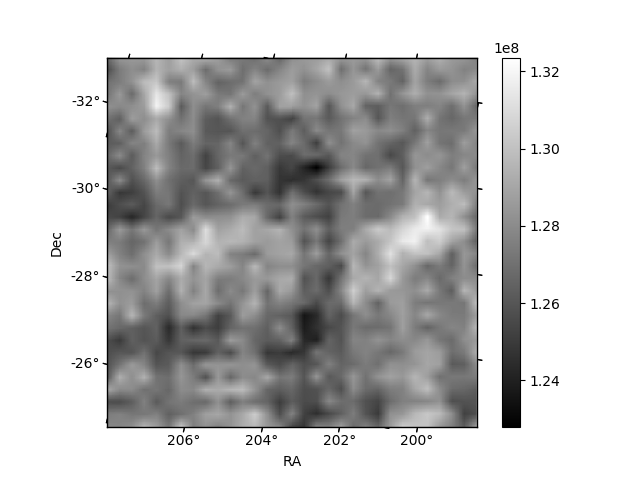
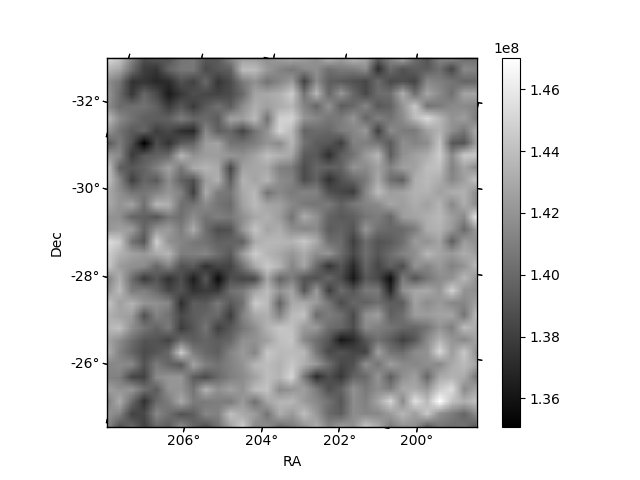
Histogram calculated using DETX and DETY for each event in the final _common_clean file
| Quadrant A |  |
 |
Quadrant B |
|---|---|---|---|
| Quadrant D | 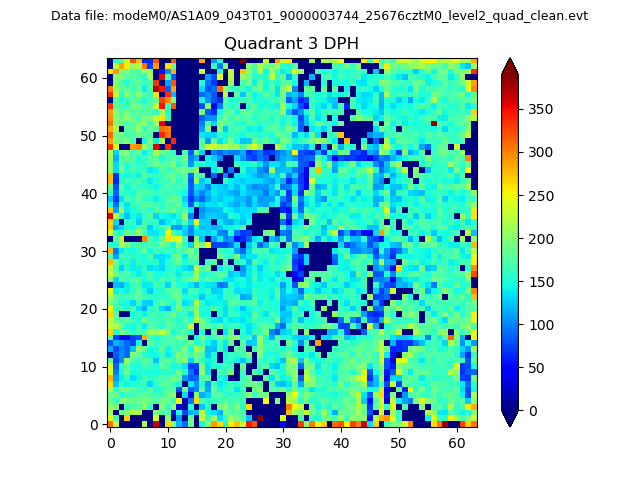 |
 |
Quadrant C |
| Plot type | Count rate plots | Images |
|---|---|---|
| Comparison with Poisson distribution Blue bars denote a histogram of data divided into 1 sec bins. Red curve is a Poisson curve with rate = median count rate of data. |
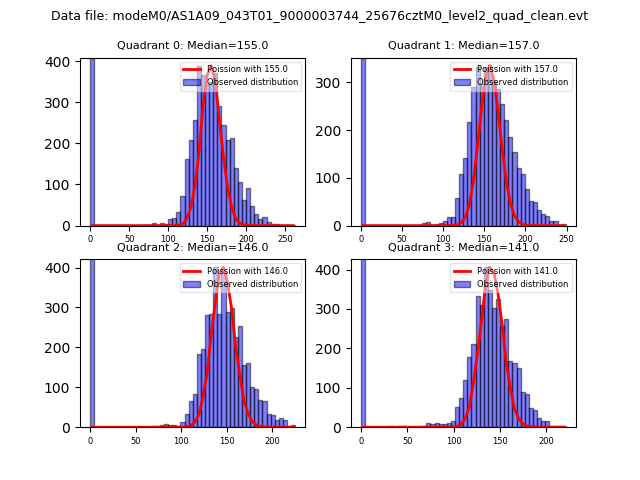 |
 |
| Quadrant-wise count rates Data is divided into 100 sec bins |
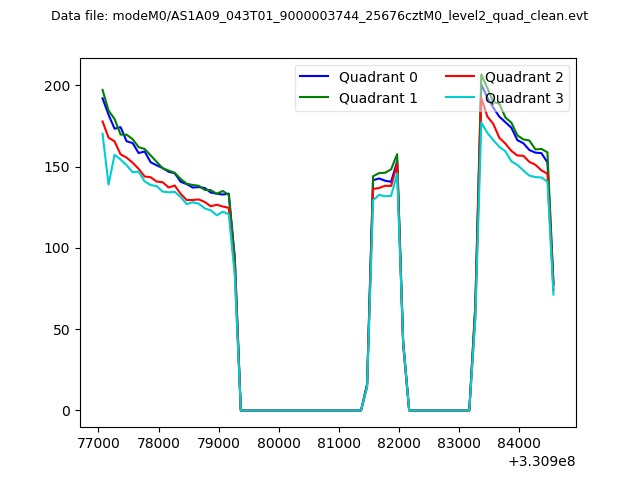 |
|
| Module-wise count rates for Quadrant A Data is divided into 100 sec bins |
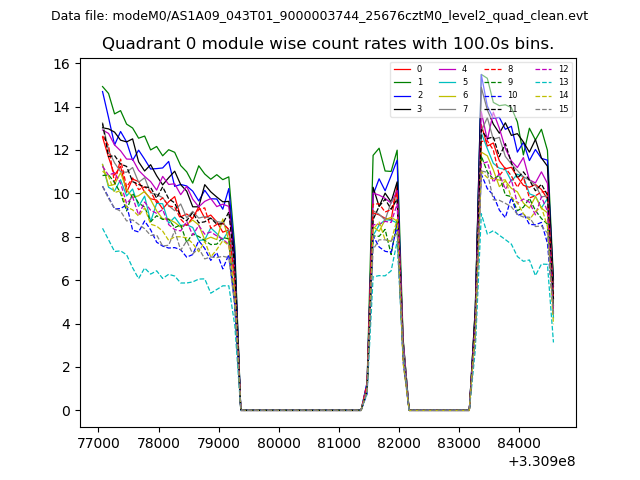 |
 |
| Module-wise count rates for Quadrant B Data is divided into 100 sec bins |
 |
 |
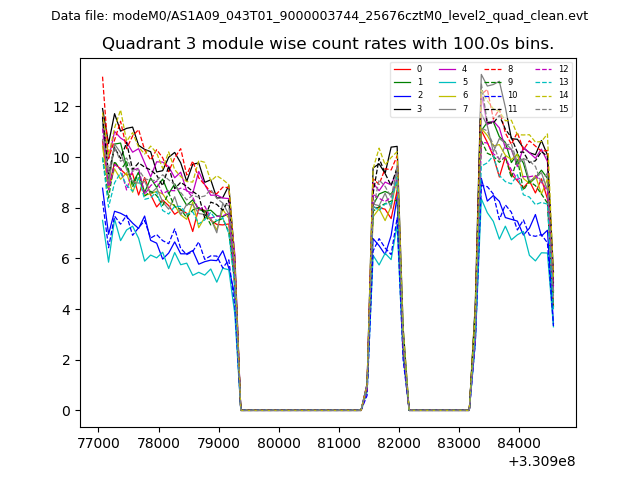
| Module-wise count rates for Quadrant C Data is divided into 100 sec bins |
 |
 |
| Module-wise count rates for Quadrant D Data is divided into 100 sec bins |
 |
 |
| Parameter | Plot |
|---|---|
| CZT HV Monitor |  |
| D_VDD | 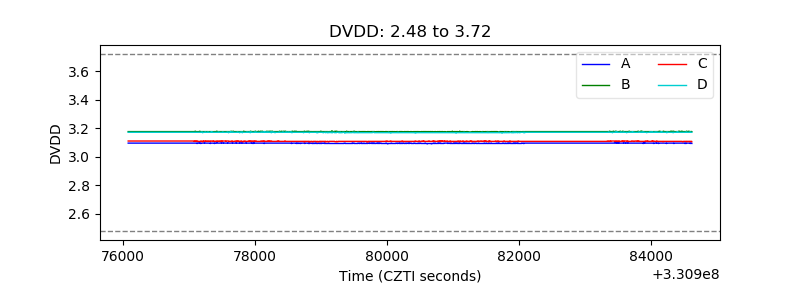 |
| Temperature 1 | 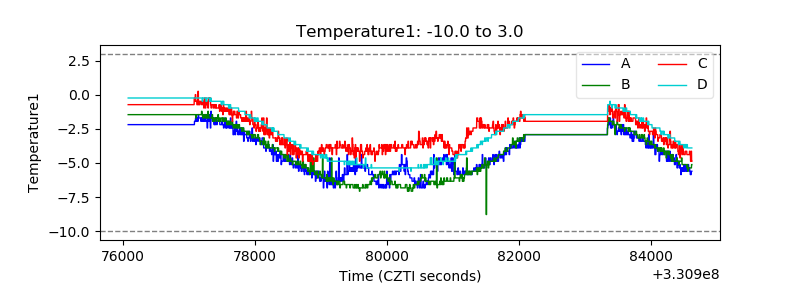 |
| Veto HV Monitor | 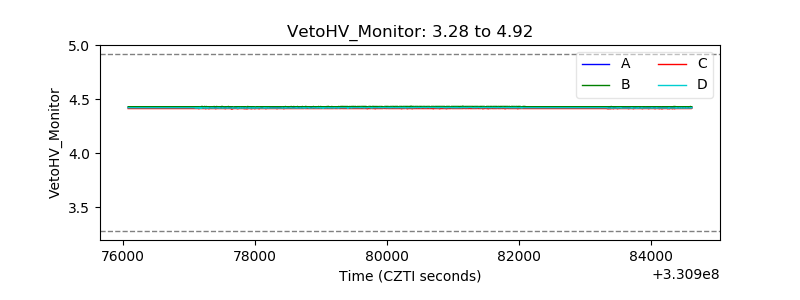 |
| Veto LLD | 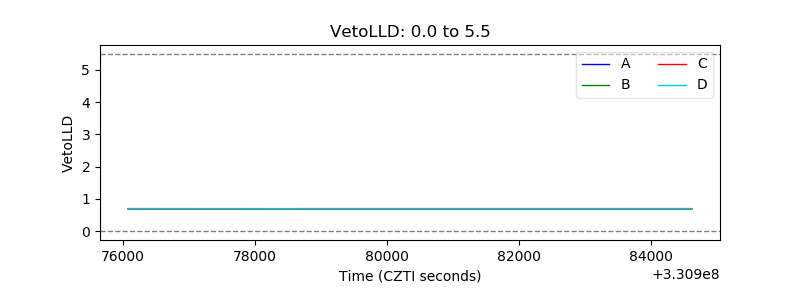 |
| Alpha Counter | 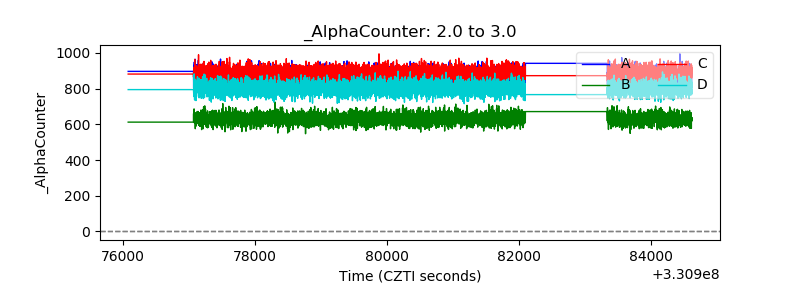 |
| _CPM_Rate | 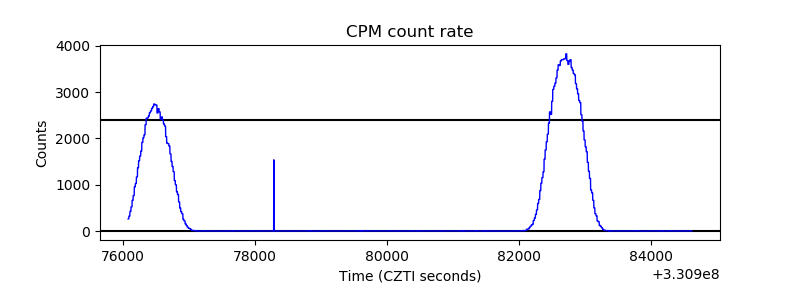 |
| CZT Counter | 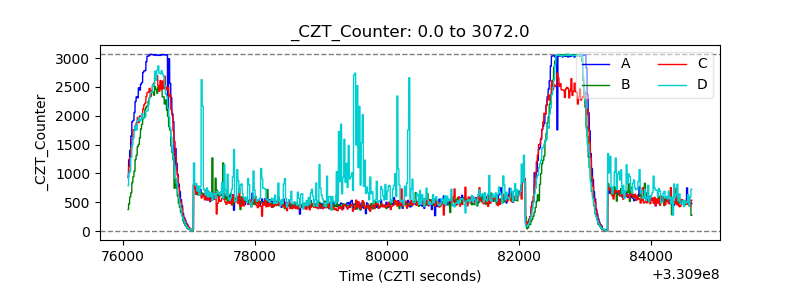 |
| +2.5 Volts monitor |  |
| +5 Volts monitor |  |
| _ROLL_ROT | 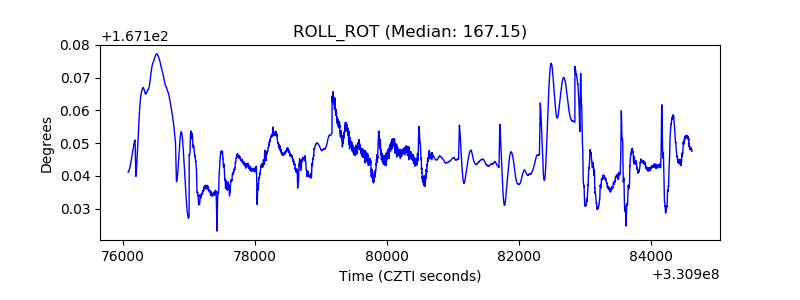 |
| _Roll_DEC | 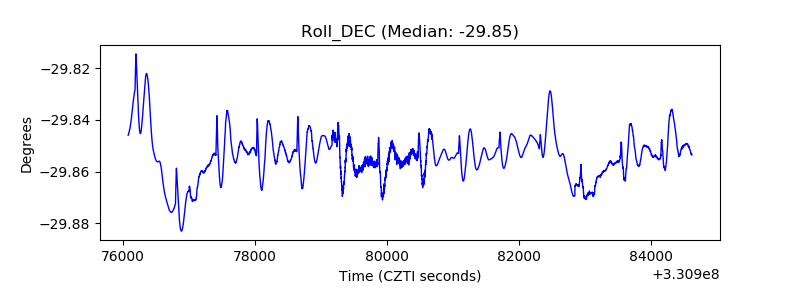 |
| _Roll_RA | 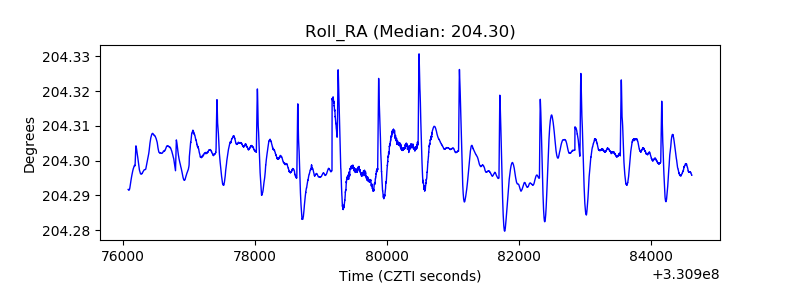 |
| Veto Counter | 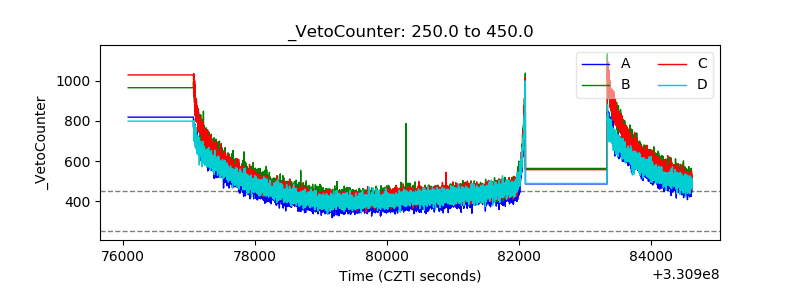 |