| Param | Original file | Final file |
|---|---|---|
| Filename | modeM0/AS1A09_043T01_9000003744_25677cztM0_level2.evt | modeM0/AS1A09_043T01_9000003744_25677cztM0_level2_quad_clean.evt |
| Size (bytes) | 478,494,720 | 98,161,920 |
| Size | 456.3 MB | 93.6 MB |
| Events in quadrant A | 3,342,198 | 655,400 |
| Events in quadrant B | 3,409,415 | 672,872 |
| Events in quadrant C | 3,230,838 | 620,985 |
| Events in quadrant D | 4,089,286 | 592,061 |
| Mode M9 | |||
|---|---|---|---|
| Quadrant | BADHDUFLAG | Total packets | Discarded packets |
| A | 0 | 24 | 0 |
| B | 0 | 25 | 0 |
| C | 0 | 25 | 0 |
| D | 0 | 25 | 0 |
| Mode M0 | |||
|---|---|---|---|
| Quadrant | BADHDUFLAG | Total packets | Discarded packets |
| A | 0 | 13650 | 0 |
| B | 0 | 13961 | 0 |
| C | 0 | 13340 | 0 |
| D | 0 | 16348 | 0 |
| Quadrant | Total seconds | Saturated seconds | Saturation percentage |
|---|---|---|---|
| A | 6182 | 20 | 0.323520% |
| B | 6181 | 46 | 0.744216% |
| C | 6181 | 62 | 1.003074% |
| D | 6181 | 50 | 0.808931% |
Noise dominated data is calculated using 1-second bins in cleaned event files. If a bin has >2000 counts, and if more than 50% of those come from <1% of pixels, then it is considered to be noise-dominated and hence unusable.
| Quadrant | # 1 sec bins | Bins with >0 counts | Bins with >2000 counts | High rate bins dominated by noise | Noise dominated (total time) | Noise dominated (detector-on time) | Marked lightcurve |
|---|---|---|---|---|---|---|---|
| A | 7517 | 6183 | 0 | 0 | 0.00% | 0.00% | 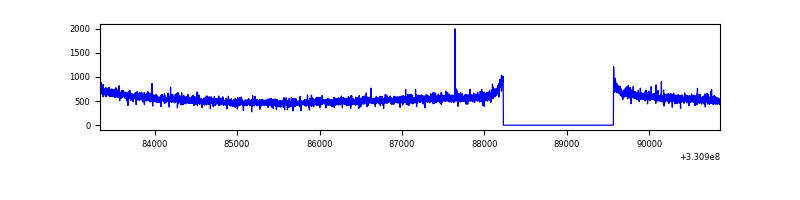 |
| B | 7516 | 6182 | 7 | 7 | 0.09% | 0.11% | 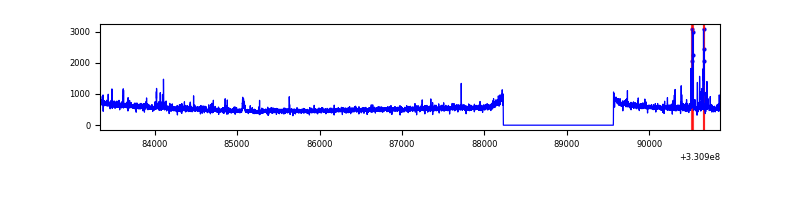 |
| C | 7516 | 6182 | 0 | 0 | 0.00% | 0.00% | 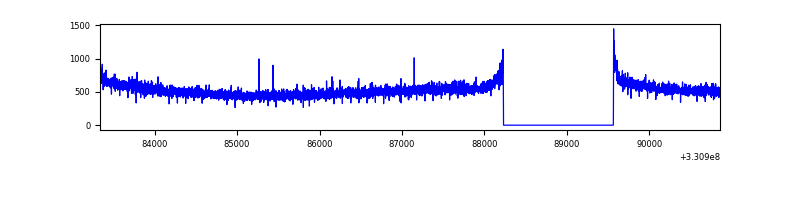 |
| D | 7516 | 6182 | 36 | 36 | 0.48% | 0.58% | 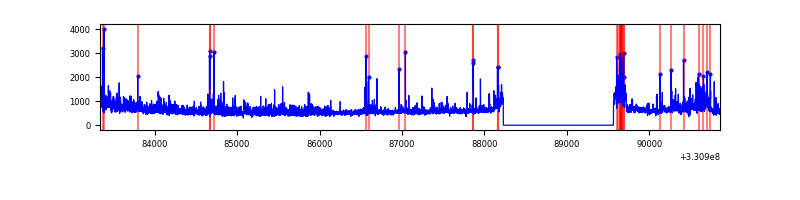 |
Top three noisy pixels from each quadrant. If the there are fewer than three noisy pixels in the level2.evt file, extra rows are filled as -1
| Pixel properties | Quadrant properties | ||||||
|---|---|---|---|---|---|---|---|
| Quadrant | DetID | PixID | Counts | Sigma | Mean | Median | Sigma |
| A | 8 | 192 | 116713 | 701.46 | 836 | 821 | 165.2 |
| A | 13 | 254 | 9216 | 50.81 | 836 | 821 | 165.2 |
| A | 0 | 226 | 7319 | 39.33 | 836 | 821 | 165.2 |
| B | 3 | 112 | 98350 | 620.98 | 836 | 820 | 157.1 |
| B | 12 | 111 | 18403 | 111.95 | 836 | 820 | 157.1 |
| B | 0 | 245 | 17048 | 103.32 | 836 | 820 | 157.1 |
| C | 14 | 238 | 128907 | 701.28 | 790 | 801 | 182.7 |
| C | 3 | 233 | 18146 | 94.95 | 790 | 801 | 182.7 |
| C | 13 | 61 | 5586 | 26.19 | 790 | 801 | 182.7 |
| D | 1 | 52 | 547026 | 2847.33 | 789 | 768 | 191.8 |
| D | 8 | 195 | 450499 | 2344.19 | 789 | 768 | 191.8 |
| D | 13 | 104 | 49749 | 255.31 | 789 | 768 | 191.8 |
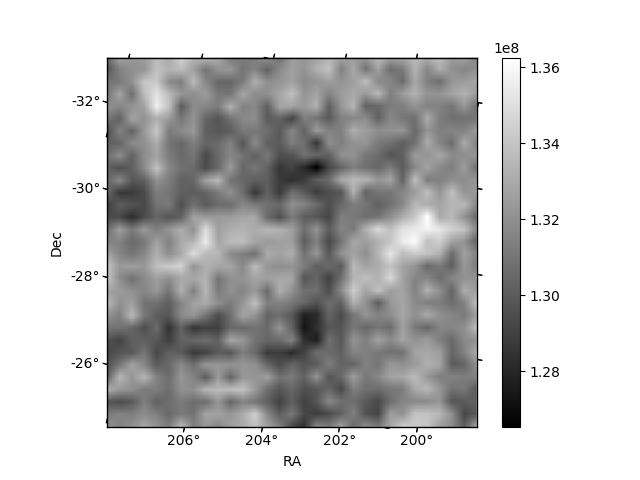
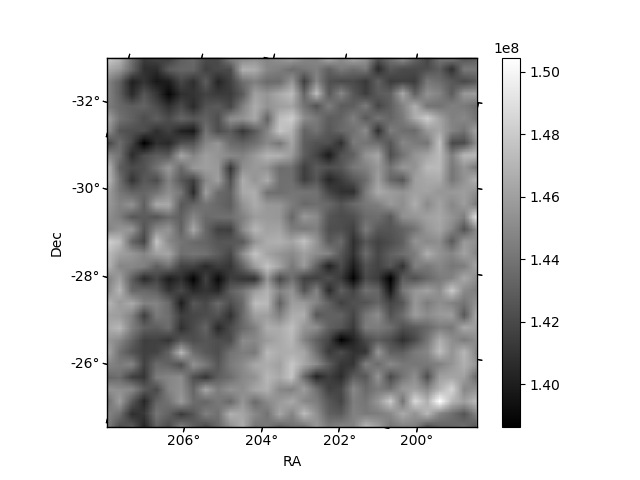
Histogram calculated using DETX and DETY for each event in the final _common_clean file
| Quadrant A | 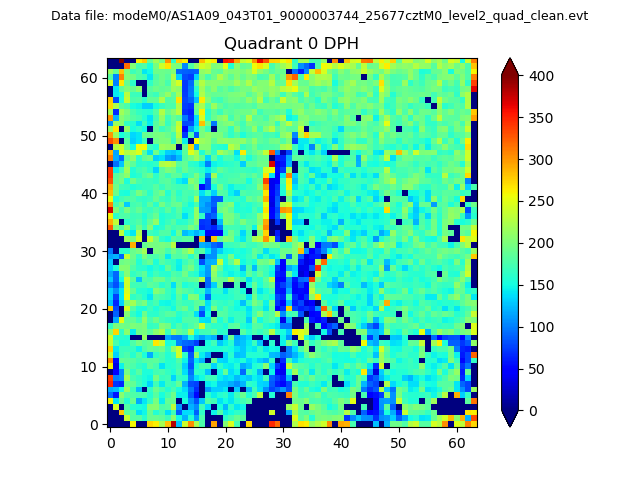 |
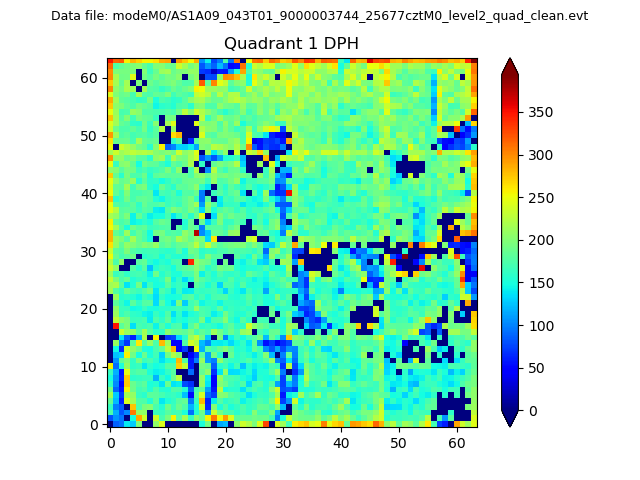 |
Quadrant B |
|---|---|---|---|
| Quadrant D | 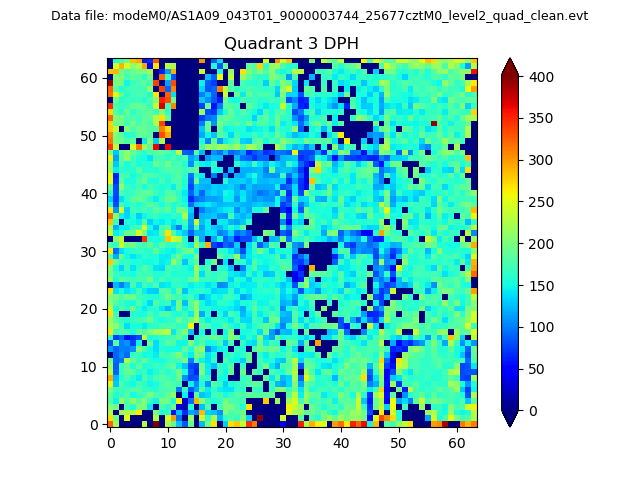 |
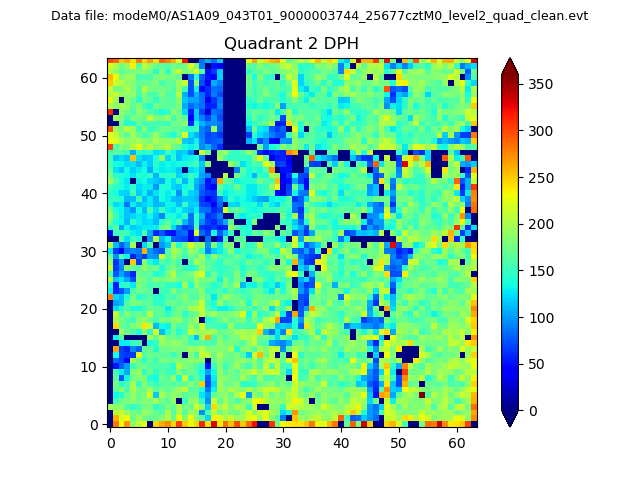 |
Quadrant C |
| Plot type | Count rate plots | Images |
|---|---|---|
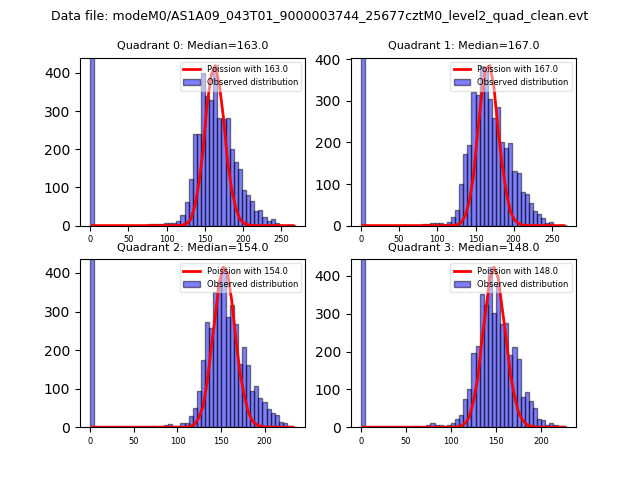
| Comparison with Poisson distribution Blue bars denote a histogram of data divided into 1 sec bins. Red curve is a Poisson curve with rate = median count rate of data. |
 |
 |
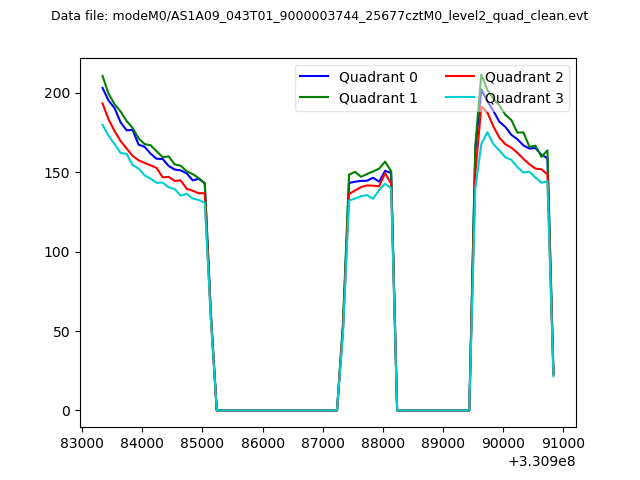
| Quadrant-wise count rates Data is divided into 100 sec bins |
 |
|
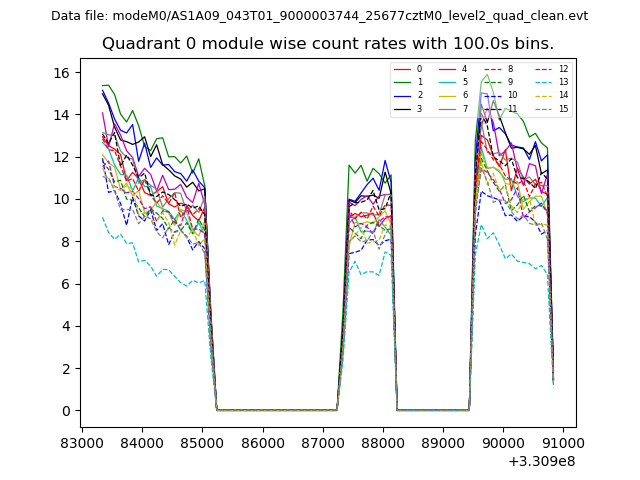
| Module-wise count rates for Quadrant A Data is divided into 100 sec bins |
 |
 |
| Module-wise count rates for Quadrant B Data is divided into 100 sec bins |
 |
 |
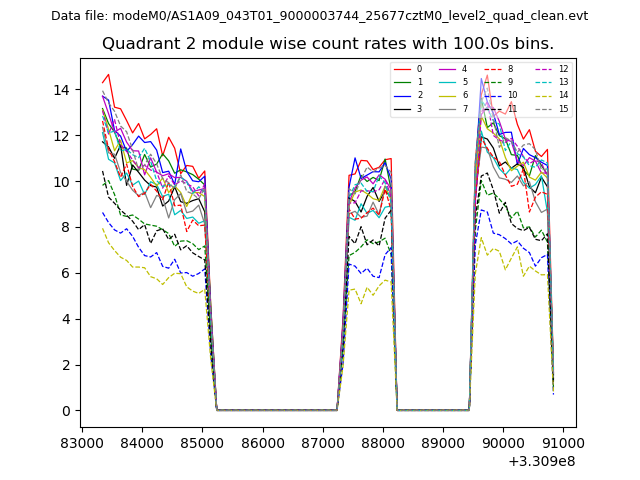
| Module-wise count rates for Quadrant C Data is divided into 100 sec bins |
 |
 |
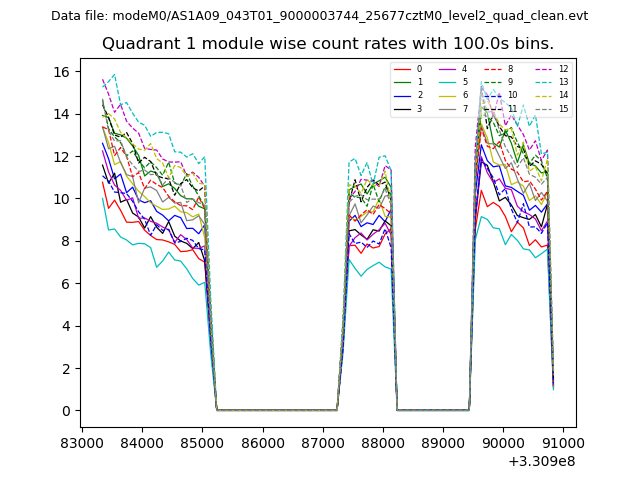
| Module-wise count rates for Quadrant D Data is divided into 100 sec bins |
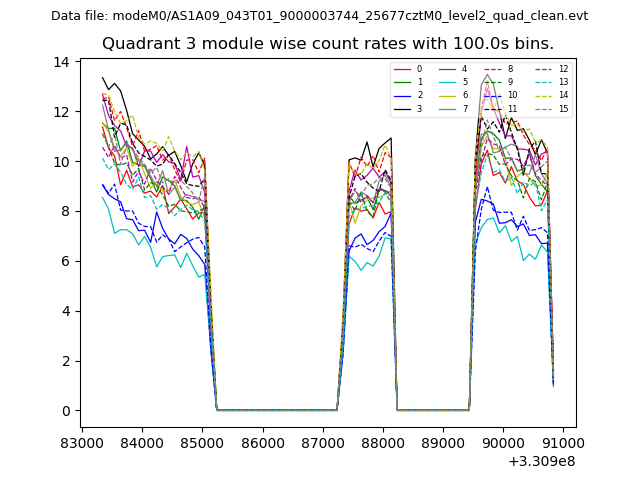 |
 |
| Parameter | Plot |
|---|---|
| CZT HV Monitor | 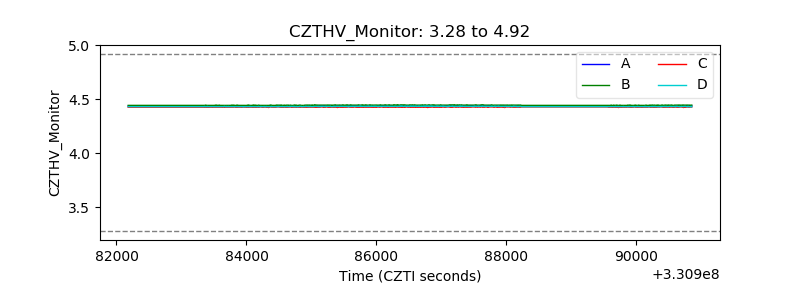 |
| D_VDD | 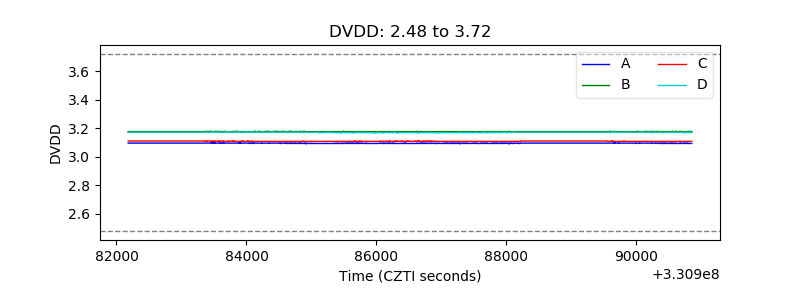 |
| Temperature 1 | 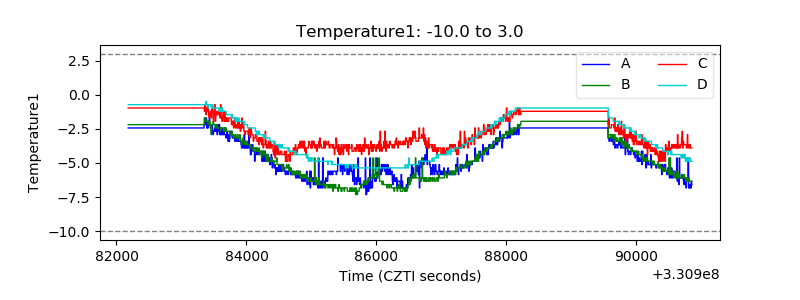 |
| Veto HV Monitor | 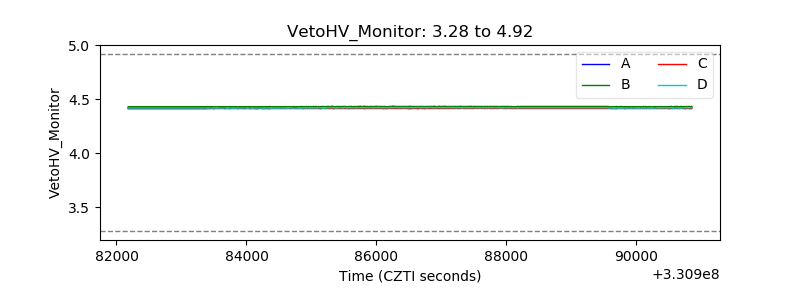 |
| Veto LLD | 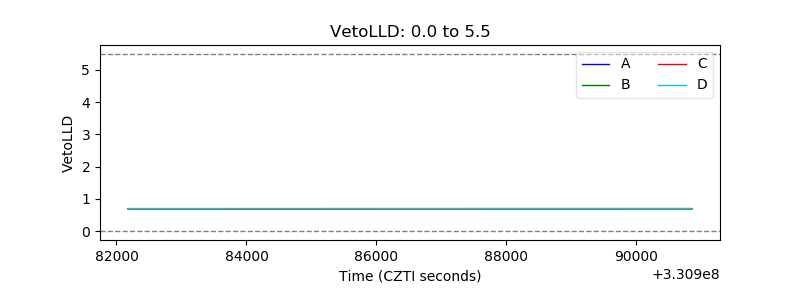 |
| Alpha Counter |  |
| _CPM_Rate |  |
| CZT Counter | 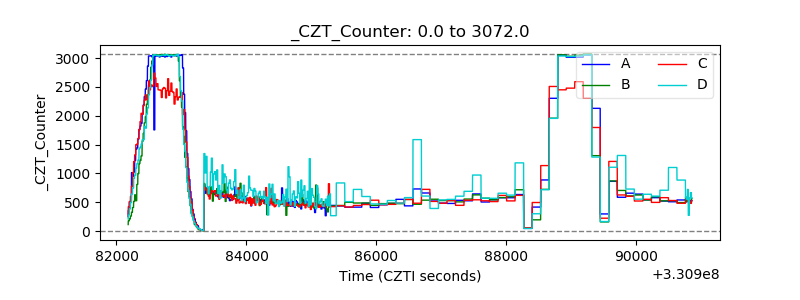 |
| +2.5 Volts monitor |  |
| +5 Volts monitor |  |
| _ROLL_ROT | 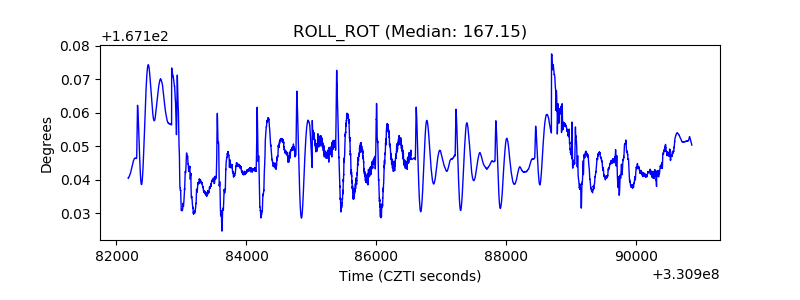 |
| _Roll_DEC | 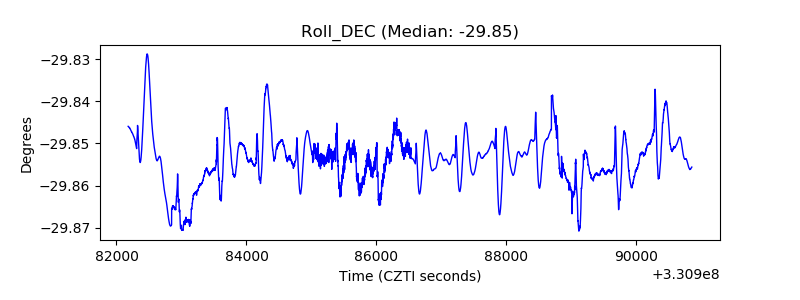 |
| _Roll_RA | 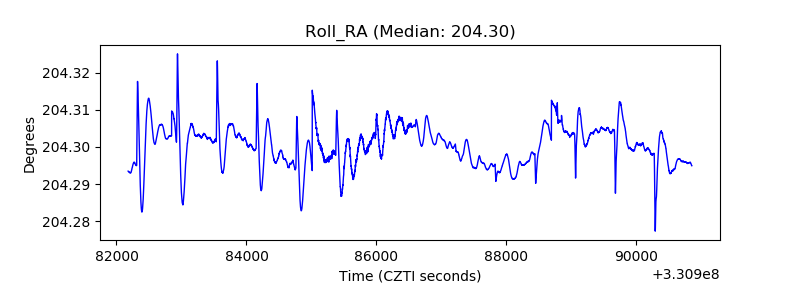 |
| Veto Counter | 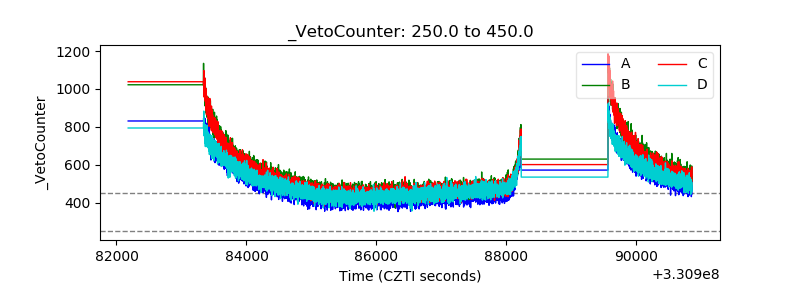 |