| Param | Original file | Final file |
|---|---|---|
| Filename | modeM0/AS1A09_043T01_9000003744_25678cztM0_level2.evt | modeM0/AS1A09_043T01_9000003744_25678cztM0_level2_quad_clean.evt |
| Size (bytes) | 494,510,400 | 93,574,080 |
| Size | 471.6 MB | 89.2 MB |
| Events in quadrant A | 3,310,664 | 621,753 |
| Events in quadrant B | 3,395,581 | 640,227 |
| Events in quadrant C | 3,233,515 | 592,266 |
| Events in quadrant D | 4,625,724 | 556,362 |
| Mode M9 | |||
|---|---|---|---|
| Quadrant | BADHDUFLAG | Total packets | Discarded packets |
| A | 0 | 16 | 0 |
| B | 0 | 17 | 0 |
| C | 0 | 17 | 0 |
| D | 0 | 17 | 0 |
| Mode M0 | |||
|---|---|---|---|
| Quadrant | BADHDUFLAG | Total packets | Discarded packets |
| A | 0 | 13407 | 0 |
| B | 0 | 13700 | 0 |
| C | 0 | 13128 | 0 |
| D | 0 | 17976 | 0 |
| Quadrant | Total seconds | Saturated seconds | Saturation percentage |
|---|---|---|---|
| A | 6058 | 14 | 0.231099% |
| B | 6058 | 35 | 0.577748% |
| C | 6058 | 67 | 1.105976% |
| D | 6058 | 196 | 3.235391% |
Noise dominated data is calculated using 1-second bins in cleaned event files. If a bin has >2000 counts, and if more than 50% of those come from <1% of pixels, then it is considered to be noise-dominated and hence unusable.
| Quadrant | # 1 sec bins | Bins with >0 counts | Bins with >2000 counts | High rate bins dominated by noise | Noise dominated (total time) | Noise dominated (detector-on time) | Marked lightcurve |
|---|---|---|---|---|---|---|---|
| A | 7443 | 6059 | 0 | 0 | 0.00% | 0.00% | 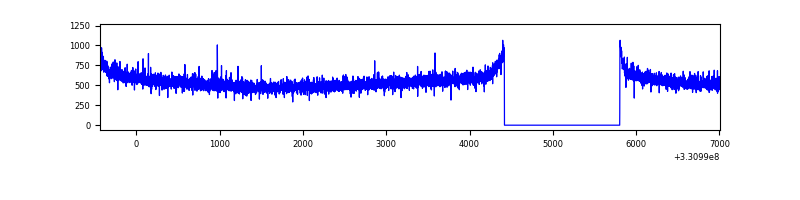 |
| B | 7443 | 6059 | 7 | 7 | 0.09% | 0.12% | 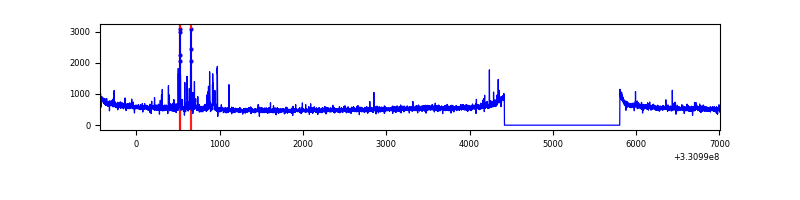 |
| C | 7443 | 6059 | 0 | 0 | 0.00% | 0.00% | 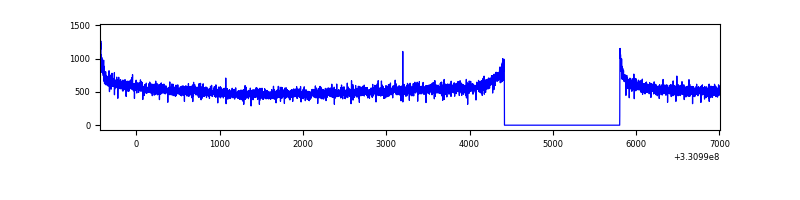 |
| D | 7443 | 6059 | 120 | 120 | 1.61% | 1.98% | 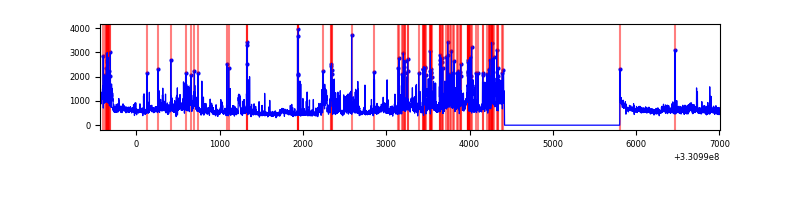 |
Top three noisy pixels from each quadrant. If the there are fewer than three noisy pixels in the level2.evt file, extra rows are filled as -1
| Pixel properties | Quadrant properties | ||||||
|---|---|---|---|---|---|---|---|
| Quadrant | DetID | PixID | Counts | Sigma | Mean | Median | Sigma |
| A | 8 | 192 | 103169 | 620.01 | 831 | 819 | 165.1 |
| A | 13 | 254 | 8730 | 47.92 | 831 | 819 | 165.1 |
| A | 0 | 226 | 7188 | 38.58 | 831 | 819 | 165.1 |
| B | 3 | 112 | 106425 | 681.99 | 833 | 816 | 154.9 |
| B | 0 | 245 | 22821 | 142.1 | 833 | 816 | 154.9 |
| B | 12 | 111 | 18121 | 111.75 | 833 | 816 | 154.9 |
| C | 14 | 238 | 130496 | 710.99 | 789 | 795 | 182.4 |
| C | 3 | 233 | 25778 | 136.95 | 789 | 795 | 182.4 |
| C | 13 | 61 | 5542 | 26.02 | 789 | 795 | 182.4 |
| D | 1 | 52 | 1215142 | 6431.96 | 779 | 757 | 188.8 |
| D | 8 | 195 | 365622 | 1932.5 | 779 | 757 | 188.8 |
| D | 13 | 104 | 65217 | 341.41 | 779 | 757 | 188.8 |
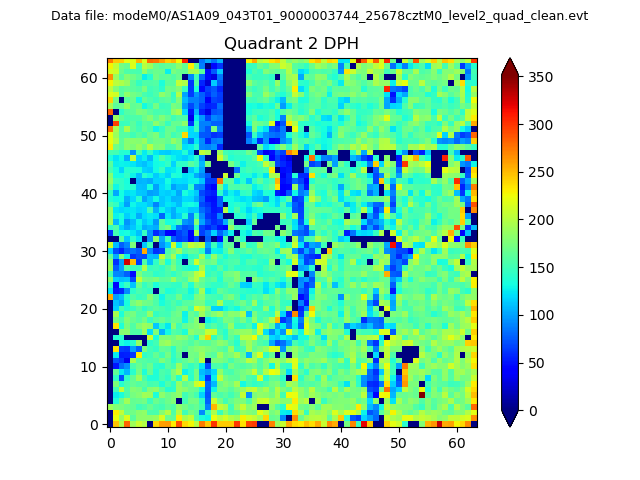
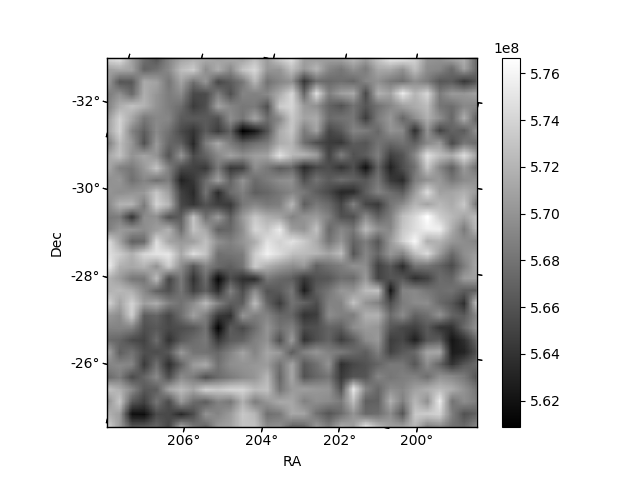
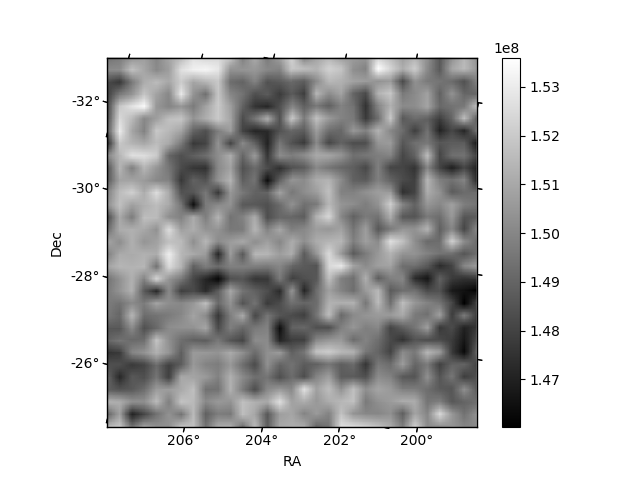
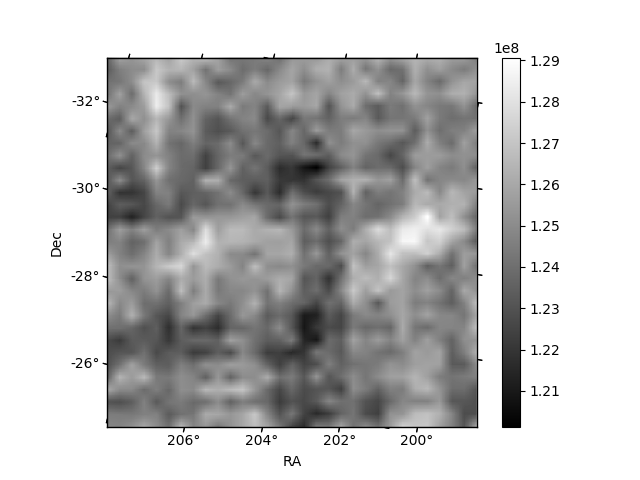
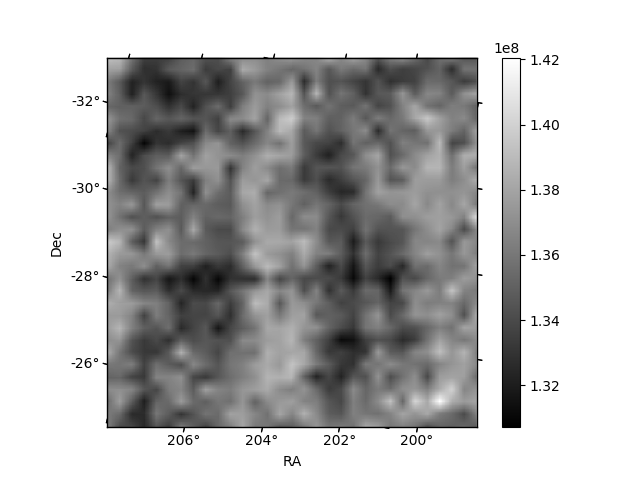
Histogram calculated using DETX and DETY for each event in the final _common_clean file
| Quadrant A | 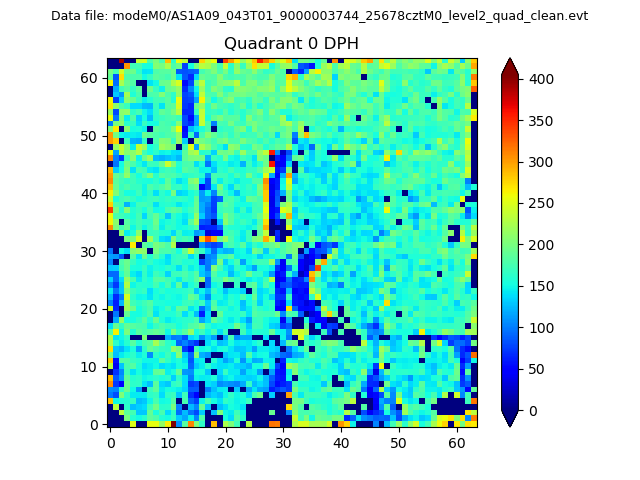 |
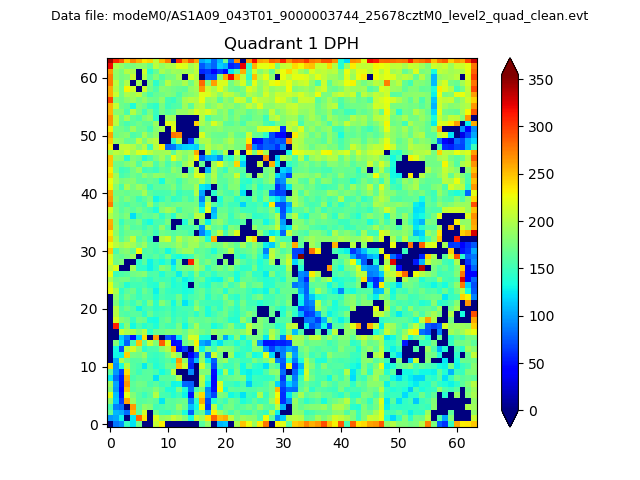 |
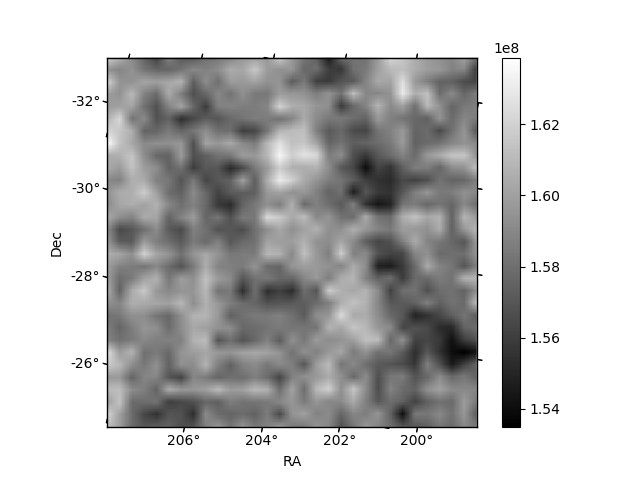
Quadrant B |
|---|---|---|---|
| Quadrant D | 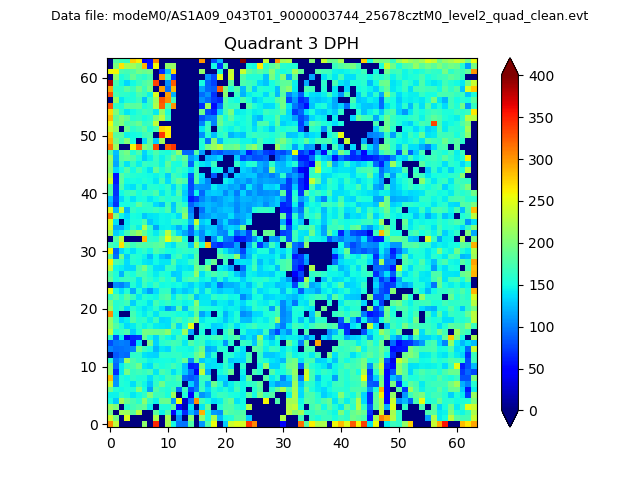 |
 |
Quadrant C |
| Plot type | Count rate plots | Images |
|---|---|---|
| Comparison with Poisson distribution Blue bars denote a histogram of data divided into 1 sec bins. Red curve is a Poisson curve with rate = median count rate of data. |
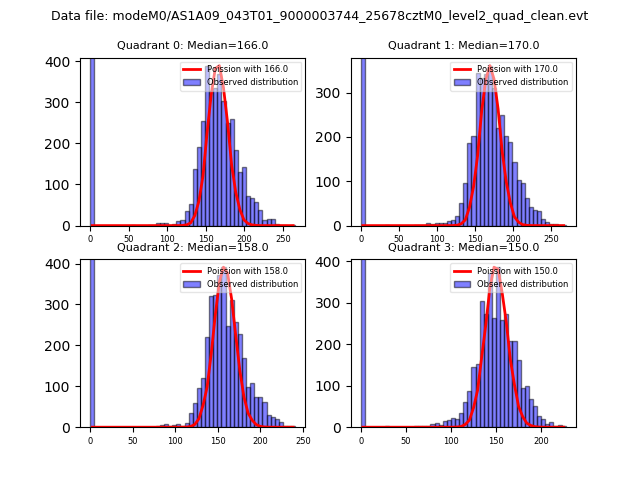 |
 |
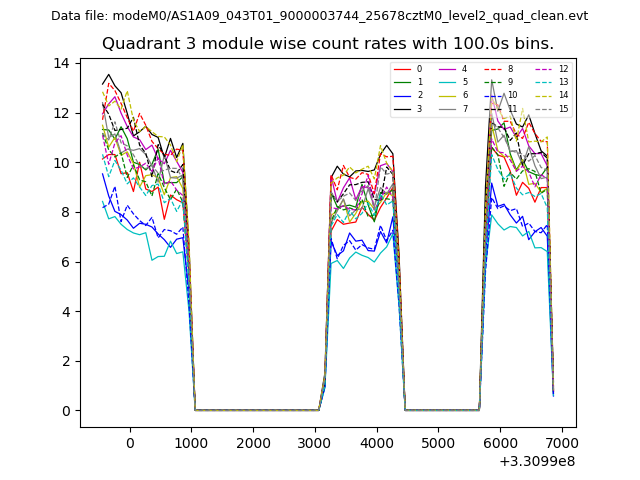
| Quadrant-wise count rates Data is divided into 100 sec bins |
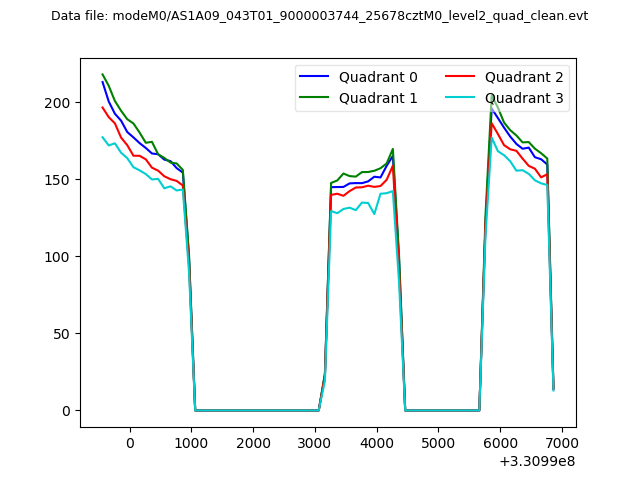 |
|
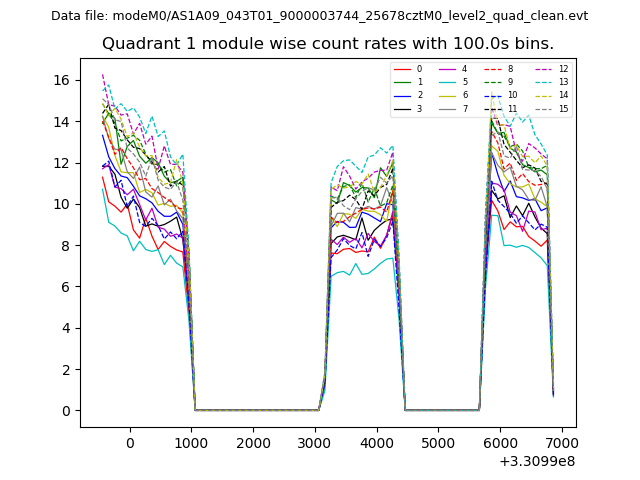
| Module-wise count rates for Quadrant A Data is divided into 100 sec bins |
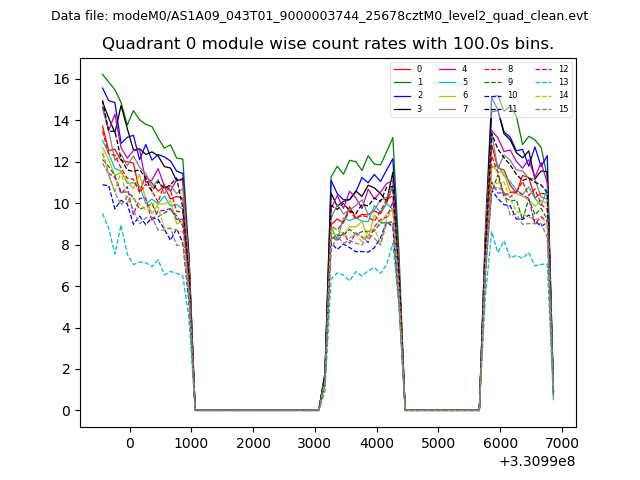 |
 |
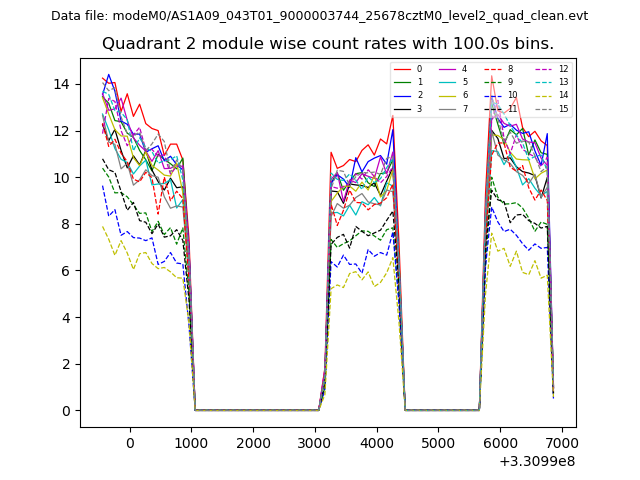
| Module-wise count rates for Quadrant B Data is divided into 100 sec bins |
 |
 |
| Module-wise count rates for Quadrant C Data is divided into 100 sec bins |
 |
 |
| Module-wise count rates for Quadrant D Data is divided into 100 sec bins |
 |
 |
| Parameter | Plot |
|---|---|
| CZT HV Monitor | 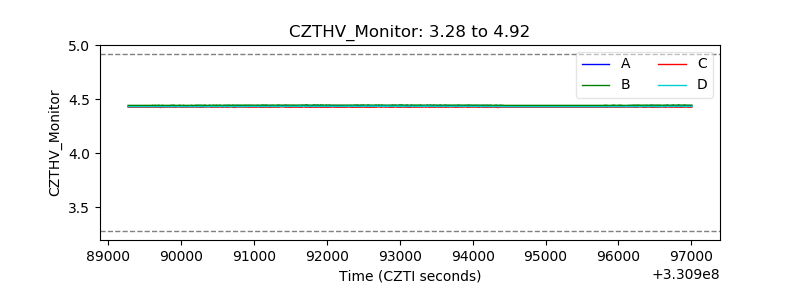 |
| D_VDD | 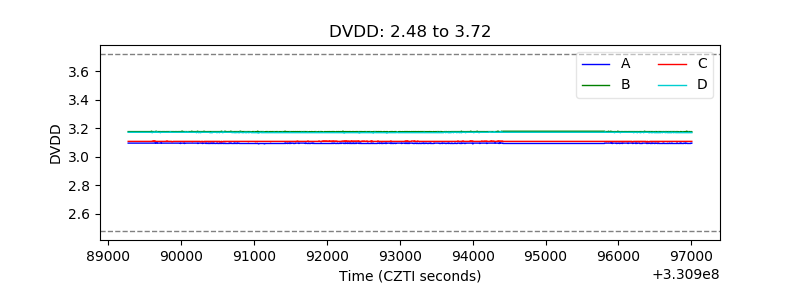 |
| Temperature 1 | 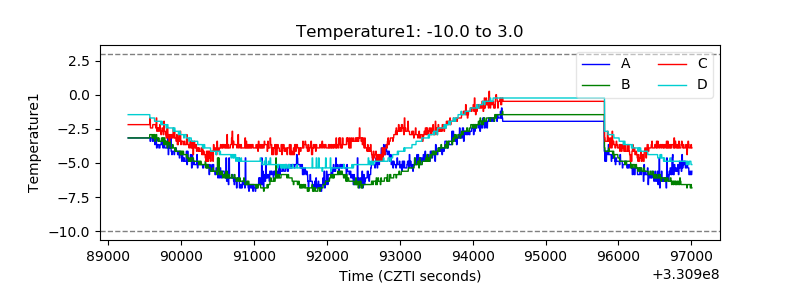 |
| Veto HV Monitor | 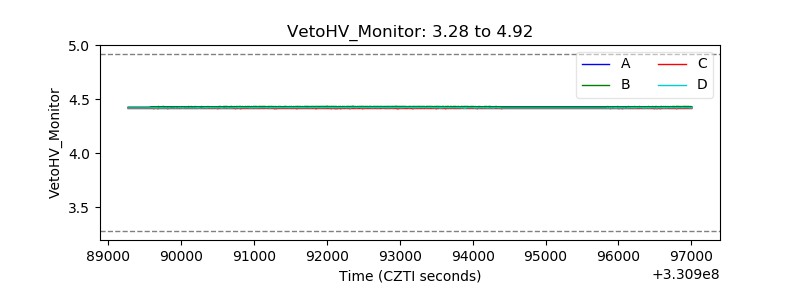 |
| Veto LLD | 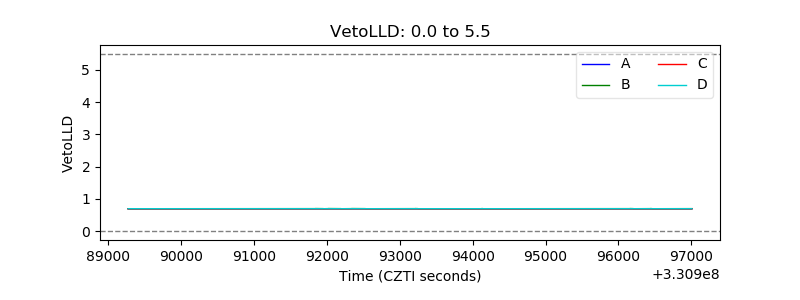 |
| Alpha Counter | 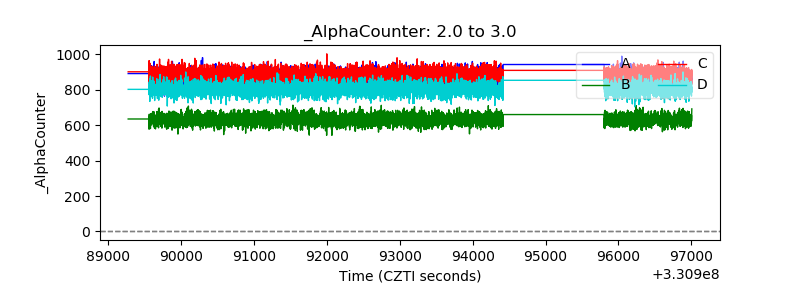 |
| _CPM_Rate | 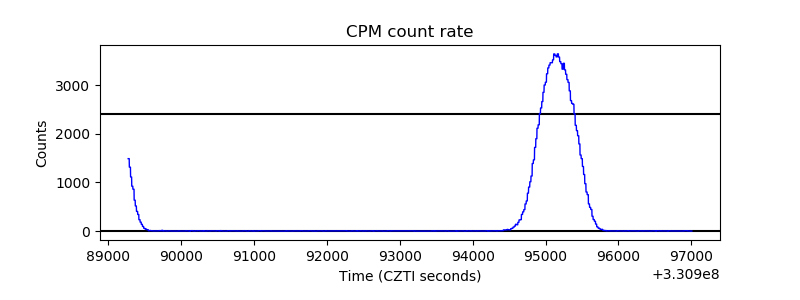 |
| CZT Counter | 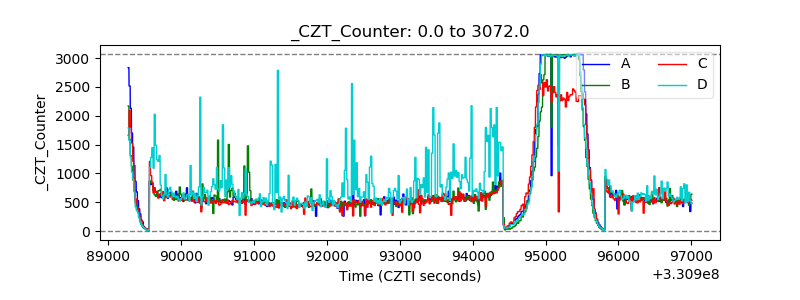 |
| +2.5 Volts monitor |  |
| +5 Volts monitor |  |
| _ROLL_ROT | 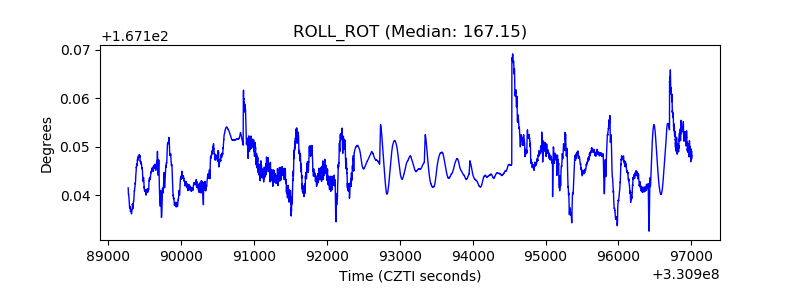 |
| _Roll_DEC | 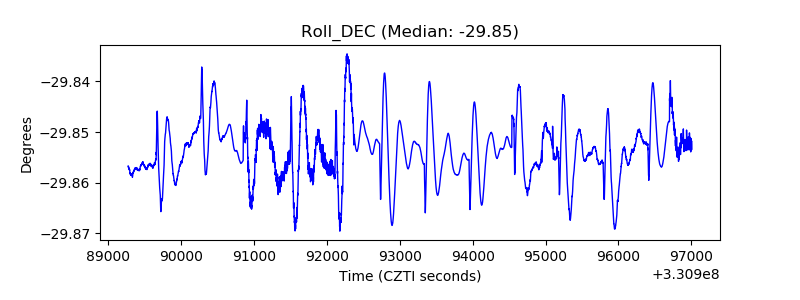 |
| _Roll_RA | 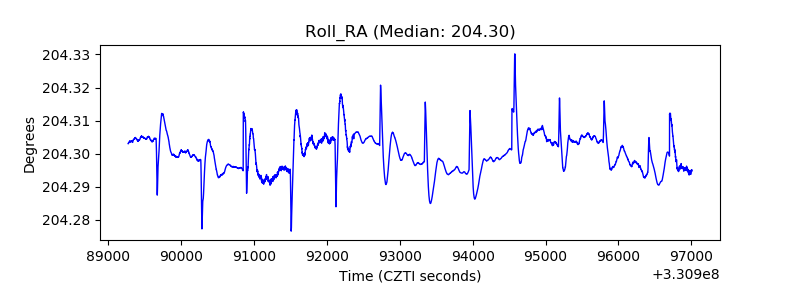 |
| Veto Counter | 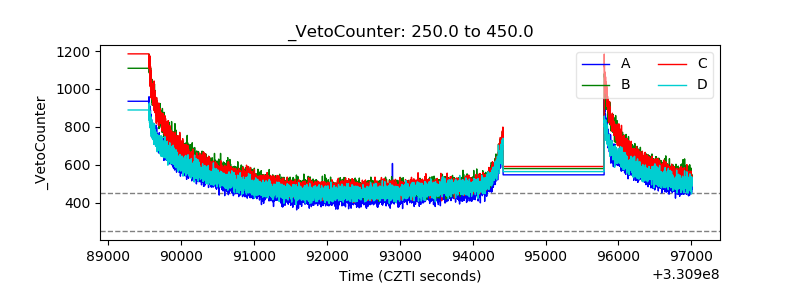 |