| Param | Original file | Final file |
|---|---|---|
| Filename | modeM0/AS1A09_043T01_9000003744_25680cztM0_level2.evt | modeM0/AS1A09_043T01_9000003744_25680cztM0_level2_quad_clean.evt |
| Size (bytes) | 470,871,360 | 74,856,960 |
| Size | 449.1 MB | 71.4 MB |
| Events in quadrant A | 3,387,303 | 470,824 |
| Events in quadrant B | 3,270,898 | 479,986 |
| Events in quadrant C | 3,243,728 | 448,778 |
| Events in quadrant D | 3,929,908 | 426,643 |
| Mode M9 | |||
|---|---|---|---|
| Quadrant | BADHDUFLAG | Total packets | Discarded packets |
| A | 0 | 13 | 0 |
| B | 0 | 14 | 0 |
| C | 0 | 14 | 0 |
| D | 0 | 14 | 0 |
| Mode M0 | |||
|---|---|---|---|
| Quadrant | BADHDUFLAG | Total packets | Discarded packets |
| A | 0 | 13694 | 0 |
| B | 0 | 13304 | 0 |
| C | 0 | 13203 | 0 |
| D | 0 | 15625 | 0 |
| Quadrant | Total seconds | Saturated seconds | Saturation percentage |
|---|---|---|---|
| A | 6312 | 18 | 0.285171% |
| B | 6312 | 34 | 0.538657% |
| C | 6312 | 63 | 0.998099% |
| D | 6312 | 142 | 2.249683% |
Noise dominated data is calculated using 1-second bins in cleaned event files. If a bin has >2000 counts, and if more than 50% of those come from <1% of pixels, then it is considered to be noise-dominated and hence unusable.
| Quadrant | # 1 sec bins | Bins with >0 counts | Bins with >2000 counts | High rate bins dominated by noise | Noise dominated (total time) | Noise dominated (detector-on time) | Marked lightcurve |
|---|---|---|---|---|---|---|---|
| A | 7487 | 6313 | 0 | 0 | 0.00% | 0.00% | 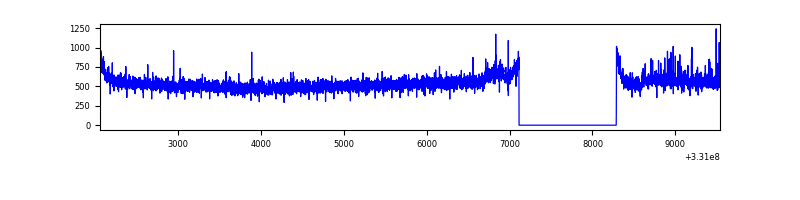 |
| B | 7487 | 6313 | 1 | 1 | 0.01% | 0.02% | 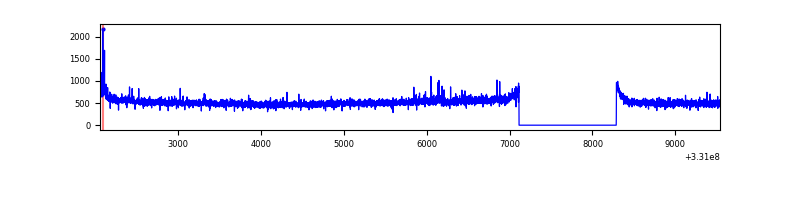 |
| C | 7487 | 6313 | 0 | 0 | 0.00% | 0.00% | 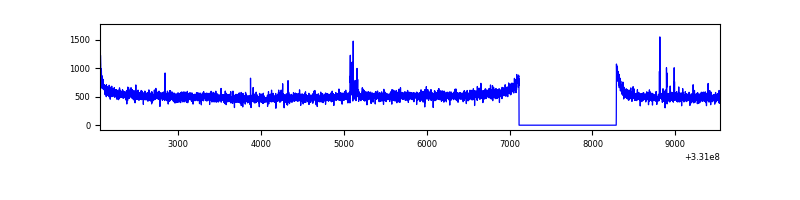 |
| D | 7487 | 6313 | 113 | 113 | 1.51% | 1.79% | 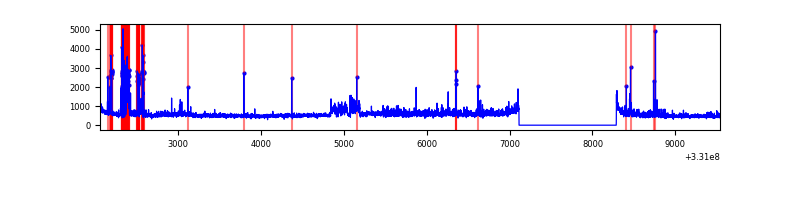 |
Top three noisy pixels from each quadrant. If the there are fewer than three noisy pixels in the level2.evt file, extra rows are filled as -1
| Pixel properties | Quadrant properties | ||||||
|---|---|---|---|---|---|---|---|
| Quadrant | DetID | PixID | Counts | Sigma | Mean | Median | Sigma |
| A | 8 | 192 | 213202 | 1297.36 | 823 | 810 | 163.7 |
| A | 13 | 254 | 9352 | 52.18 | 823 | 810 | 163.7 |
| A | 3 | 137 | 7249 | 39.33 | 823 | 810 | 163.7 |
| B | 12 | 111 | 18679 | 114.86 | 824 | 805 | 155.6 |
| B | 11 | 111 | 16805 | 102.82 | 824 | 805 | 155.6 |
| B | 14 | 111 | 15506 | 94.47 | 824 | 805 | 155.6 |
| C | 14 | 238 | 127290 | 693.11 | 787 | 794 | 182.5 |
| C | 14 | 225 | 26372 | 140.15 | 787 | 794 | 182.5 |
| C | 3 | 233 | 19396 | 101.93 | 787 | 794 | 182.5 |
| D | 1 | 52 | 453929 | 2374.79 | 781 | 760 | 190.8 |
| D | 8 | 195 | 428581 | 2241.96 | 781 | 760 | 190.8 |
| D | 13 | 104 | 86965 | 451.75 | 781 | 760 | 190.8 |
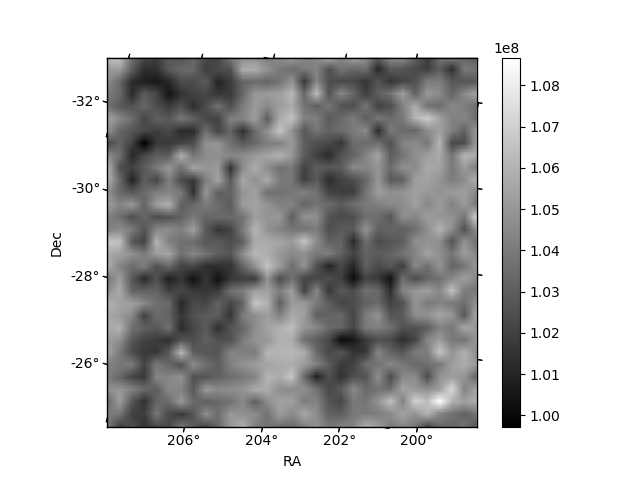
Histogram calculated using DETX and DETY for each event in the final _common_clean file
| Quadrant A |  |
 |
Quadrant B |
|---|---|---|---|
| Quadrant D | 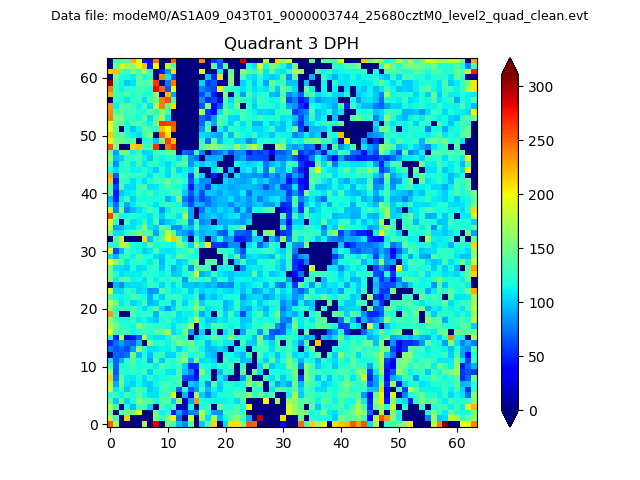 |
 |
Quadrant C |
| Plot type | Count rate plots | Images |
|---|---|---|
| Comparison with Poisson distribution Blue bars denote a histogram of data divided into 1 sec bins. Red curve is a Poisson curve with rate = median count rate of data. |
 |
 |
| Quadrant-wise count rates Data is divided into 100 sec bins |
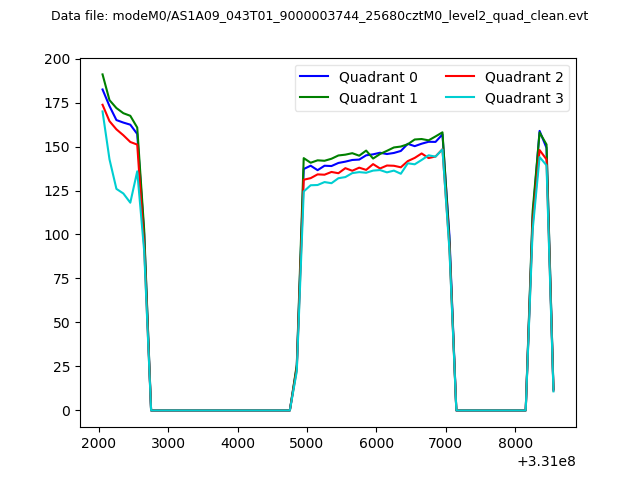 |
|
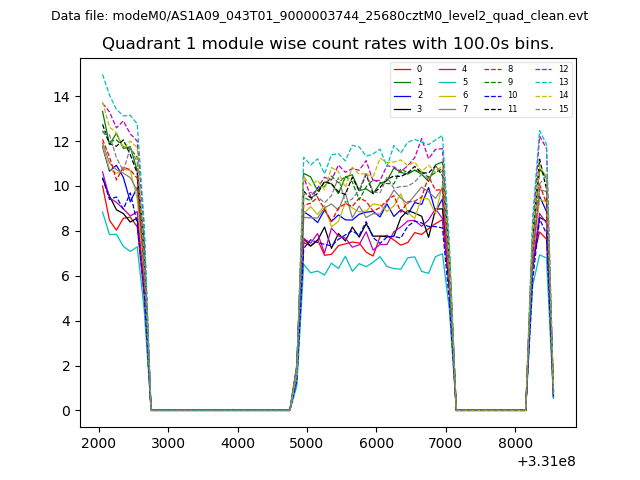
| Module-wise count rates for Quadrant A Data is divided into 100 sec bins |
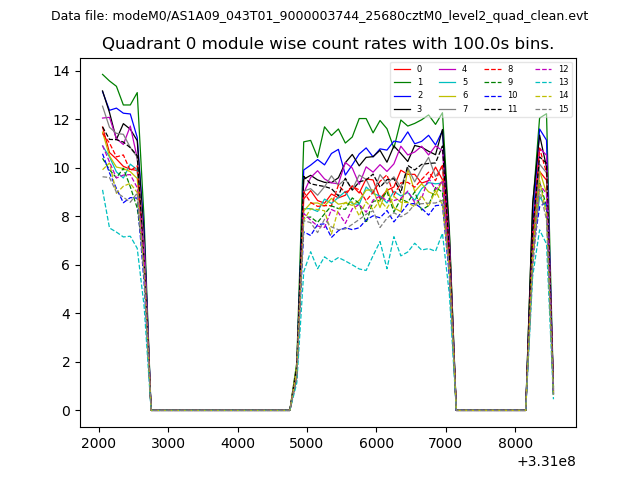 |
 |
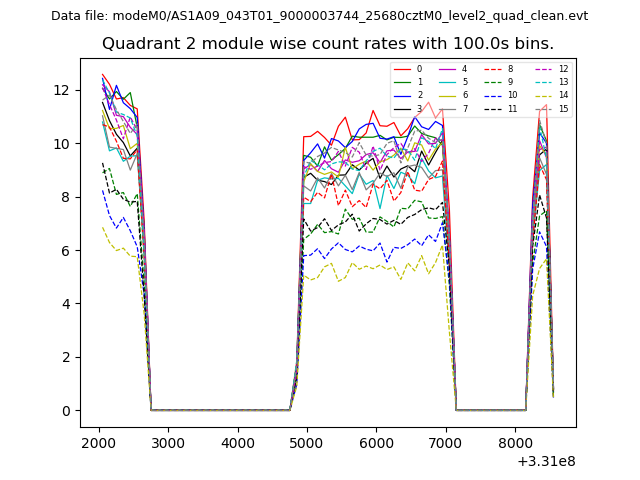
| Module-wise count rates for Quadrant B Data is divided into 100 sec bins |
 |
 |
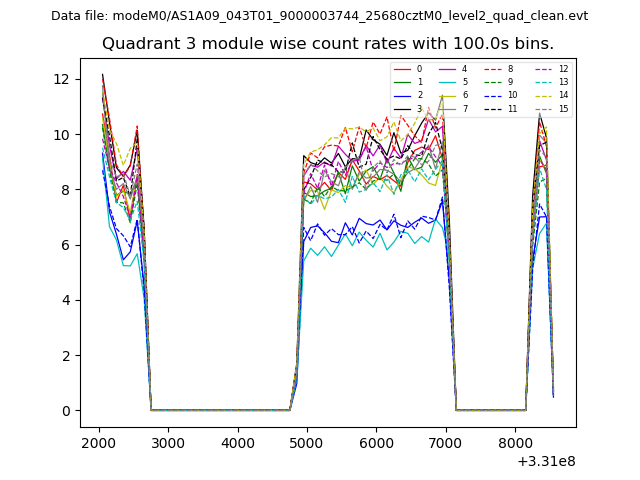
| Module-wise count rates for Quadrant C Data is divided into 100 sec bins |
 |
 |
| Module-wise count rates for Quadrant D Data is divided into 100 sec bins |
 |
 |
| Parameter | Plot |
|---|---|
| CZT HV Monitor | 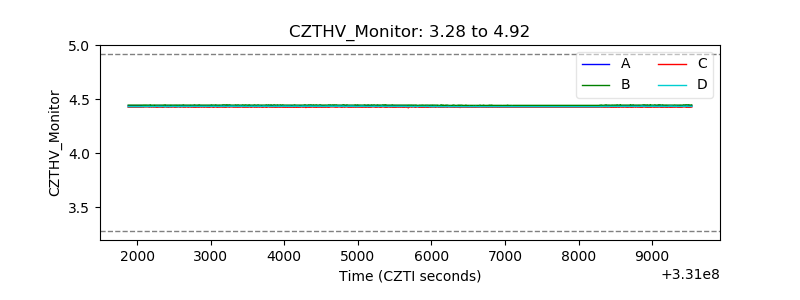 |
| D_VDD | 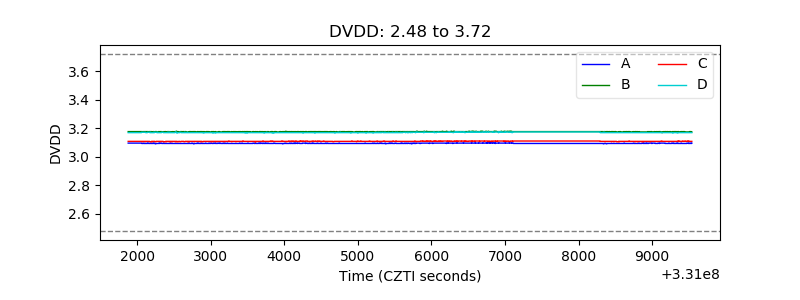 |
| Temperature 1 | 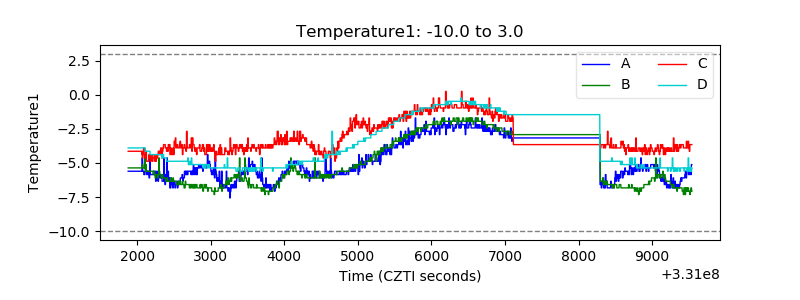 |
| Veto HV Monitor | 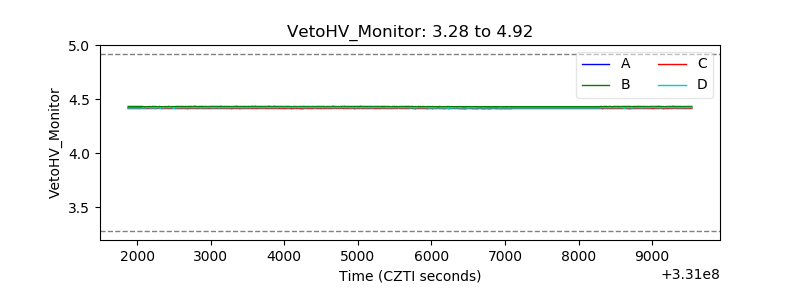 |
| Veto LLD | 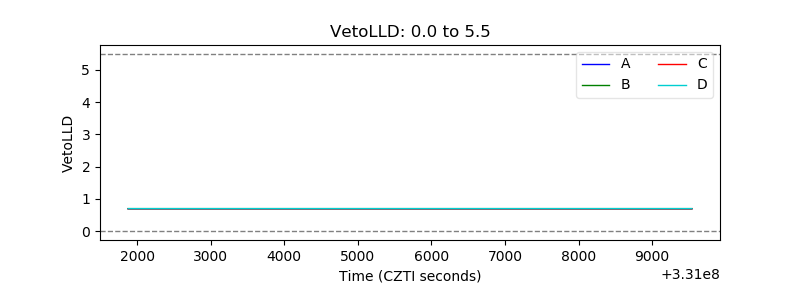 |
| Alpha Counter | 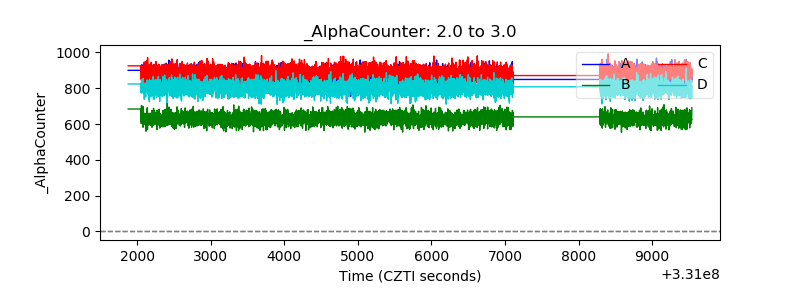 |
| _CPM_Rate | 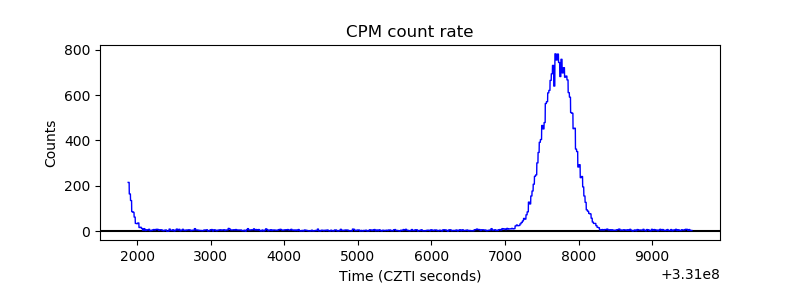 |
| CZT Counter |  |
| +2.5 Volts monitor |  |
| +5 Volts monitor | 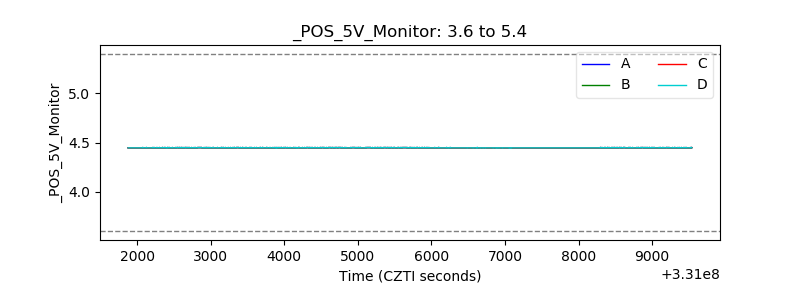 |
| _ROLL_ROT |  |
| _Roll_DEC |  |
| _Roll_RA |  |
| Veto Counter | 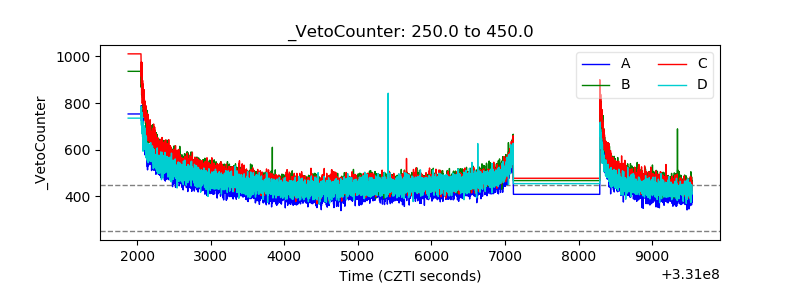 |