| Param | Original file | Final file |
|---|---|---|
| Filename | modeM0/AS1A09_043T01_9000003744_25681cztM0_level2.evt | modeM0/AS1A09_043T01_9000003744_25681cztM0_level2_quad_clean.evt |
| Size (bytes) | 524,522,880 | 74,067,840 |
| Size | 500.2 MB | 70.6 MB |
| Events in quadrant A | 4,061,688 | 445,455 |
| Events in quadrant B | 3,551,115 | 455,995 |
| Events in quadrant C | 3,514,843 | 431,263 |
| Events in quadrant D | 4,276,002 | 415,614 |
| Mode M9 | |||
|---|---|---|---|
| Quadrant | BADHDUFLAG | Total packets | Discarded packets |
| A | 0 | 10 | 0 |
| B | 0 | 11 | 0 |
| C | 0 | 11 | 0 |
| D | 0 | 11 | 0 |
| Mode M0 | |||
|---|---|---|---|
| Quadrant | BADHDUFLAG | Total packets | Discarded packets |
| A | 0 | 16380 | 0 |
| B | 0 | 14756 | 0 |
| C | 0 | 14706 | 0 |
| D | 0 | 17316 | 0 |
| Quadrant | Total seconds | Saturated seconds | Saturation percentage |
|---|---|---|---|
| A | 7104 | 107 | 1.506194% |
| B | 7104 | 92 | 1.295045% |
| C | 7104 | 115 | 1.618806% |
| D | 7104 | 172 | 2.421171% |
Noise dominated data is calculated using 1-second bins in cleaned event files. If a bin has >2000 counts, and if more than 50% of those come from <1% of pixels, then it is considered to be noise-dominated and hence unusable.
| Quadrant | # 1 sec bins | Bins with >0 counts | Bins with >2000 counts | High rate bins dominated by noise | Noise dominated (total time) | Noise dominated (detector-on time) | Marked lightcurve |
|---|---|---|---|---|---|---|---|
| A | 7879 | 7105 | 17 | 17 | 0.22% | 0.24% |  |
| B | 7879 | 7105 | 1 | 1 | 0.01% | 0.01% |  |
| C | 7879 | 7105 | 3 | 3 | 0.04% | 0.04% |  |
| D | 7879 | 7105 | 94 | 94 | 1.19% | 1.32% |  |
Top three noisy pixels from each quadrant. If the there are fewer than three noisy pixels in the level2.evt file, extra rows are filled as -1
| Pixel properties | Quadrant properties | ||||||
|---|---|---|---|---|---|---|---|
| Quadrant | DetID | PixID | Counts | Sigma | Mean | Median | Sigma |
| A | 8 | 192 | 469442 | 2613.63 | 893 | 876 | 179.3 |
| A | 0 | 13 | 148307 | 822.36 | 893 | 876 | 179.3 |
| A | 13 | 254 | 10134 | 51.64 | 893 | 876 | 179.3 |
| B | 12 | 111 | 21297 | 119.21 | 895 | 873 | 171.3 |
| B | 3 | 112 | 19726 | 110.04 | 895 | 873 | 171.3 |
| B | 11 | 111 | 19022 | 105.93 | 895 | 873 | 171.3 |
| C | 14 | 238 | 137549 | 680.45 | 858 | 863 | 200.9 |
| C | 14 | 225 | 26529 | 127.77 | 858 | 863 | 200.9 |
| C | 3 | 233 | 8333 | 37.19 | 858 | 863 | 200.9 |
| D | 8 | 195 | 502013 | 2408.67 | 858 | 835 | 208.1 |
| D | 1 | 52 | 248568 | 1190.61 | 858 | 835 | 208.1 |
| D | 13 | 104 | 206633 | 989.07 | 858 | 835 | 208.1 |
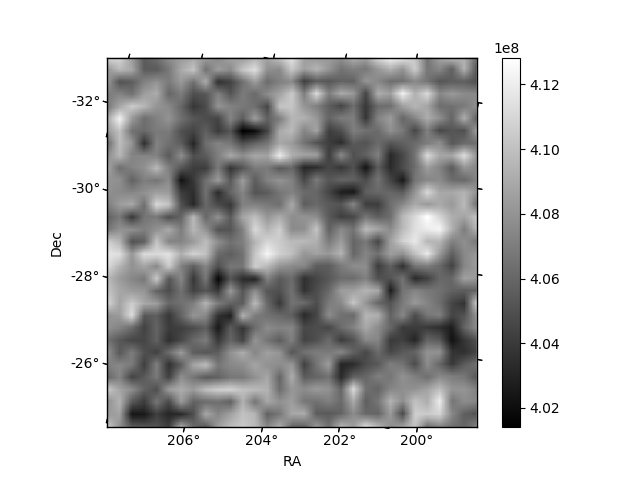
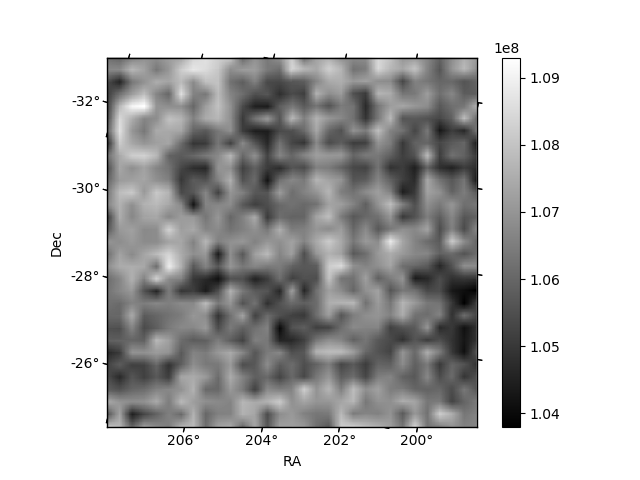
Histogram calculated using DETX and DETY for each event in the final _common_clean file
| Quadrant A | 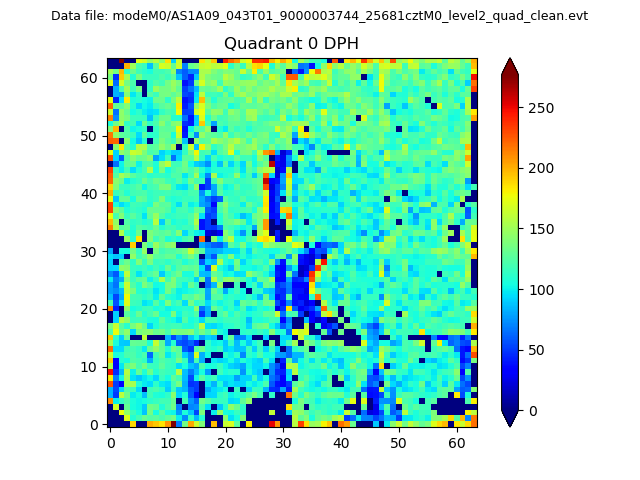 |
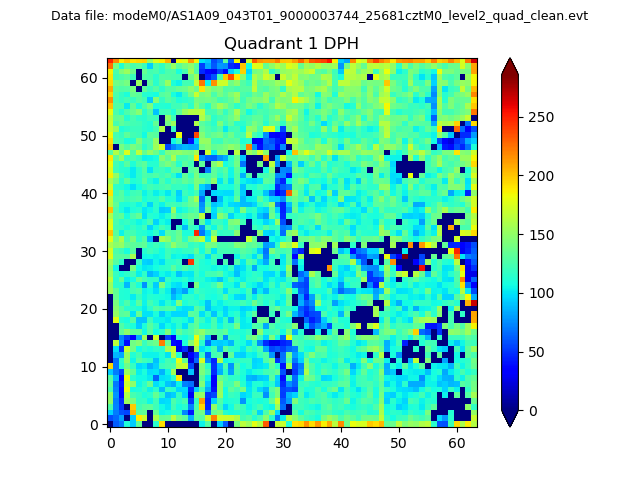 |
Quadrant B |
|---|---|---|---|
| Quadrant D | 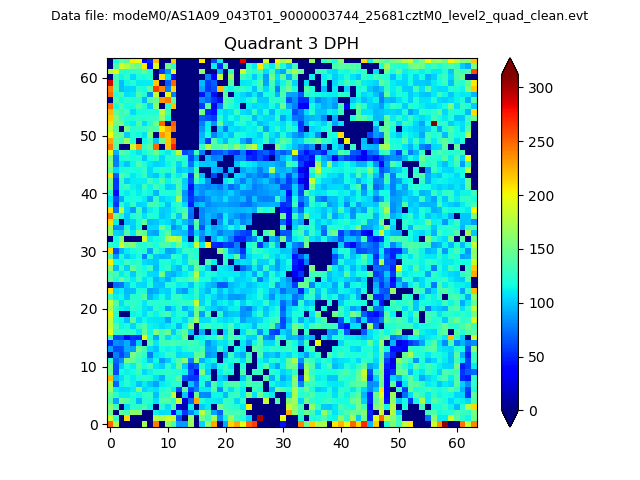 |
 |
Quadrant C |
| Plot type | Count rate plots | Images |
|---|---|---|
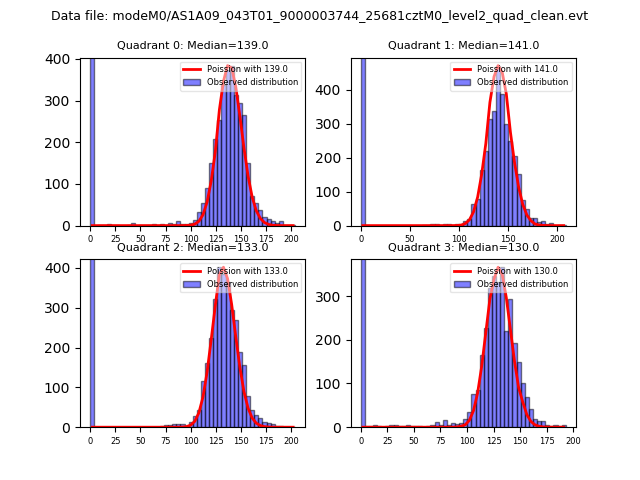
| Comparison with Poisson distribution Blue bars denote a histogram of data divided into 1 sec bins. Red curve is a Poisson curve with rate = median count rate of data. |
 |
 |
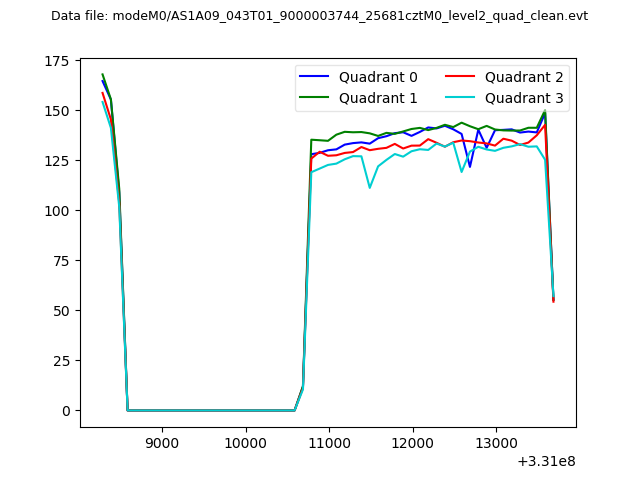
| Quadrant-wise count rates Data is divided into 100 sec bins |
 |
|
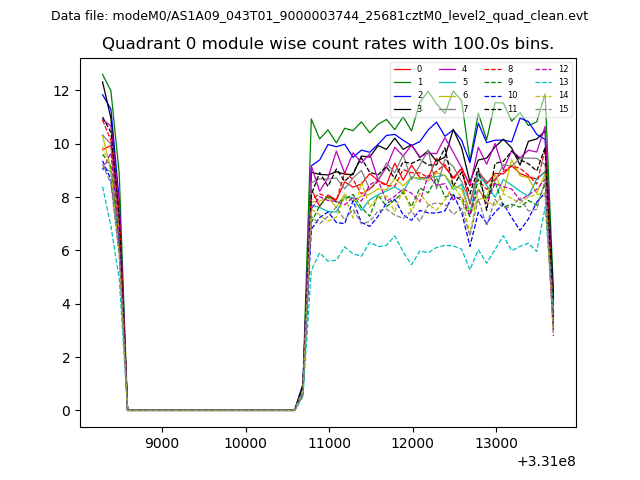
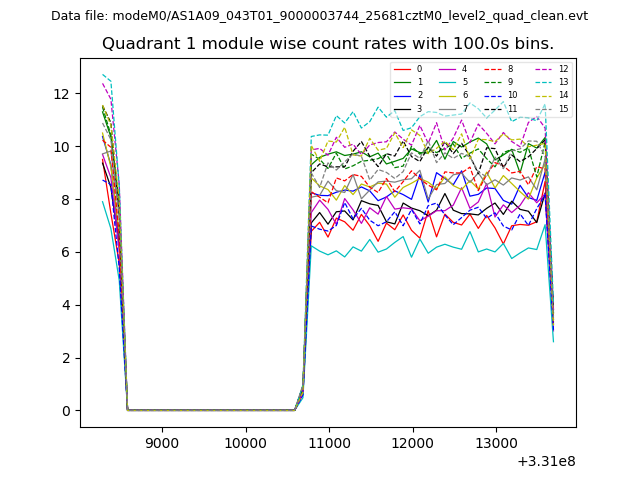
| Module-wise count rates for Quadrant A Data is divided into 100 sec bins |
 |
 |
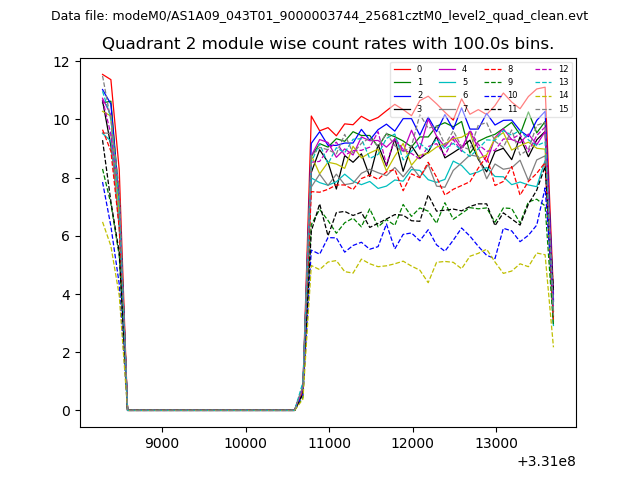
| Module-wise count rates for Quadrant B Data is divided into 100 sec bins |
 |
 |
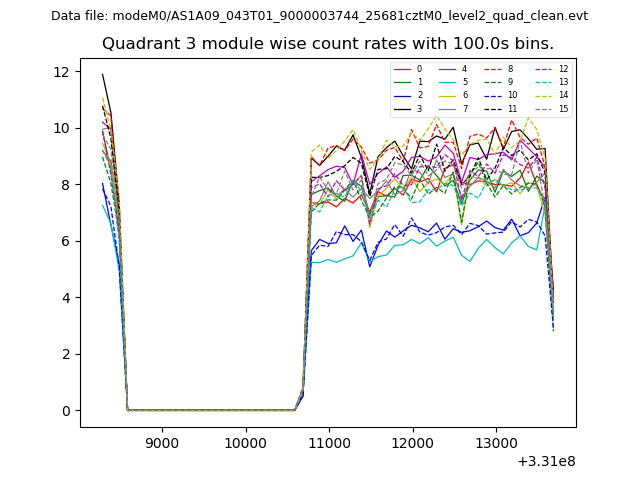
| Module-wise count rates for Quadrant C Data is divided into 100 sec bins |
 |
 |
| Module-wise count rates for Quadrant D Data is divided into 100 sec bins |
 |
 |
| Parameter | Plot |
|---|---|
| CZT HV Monitor |  |
| D_VDD | 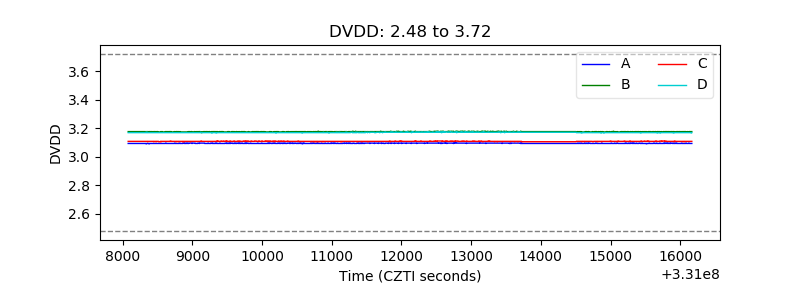 |
| Temperature 1 | 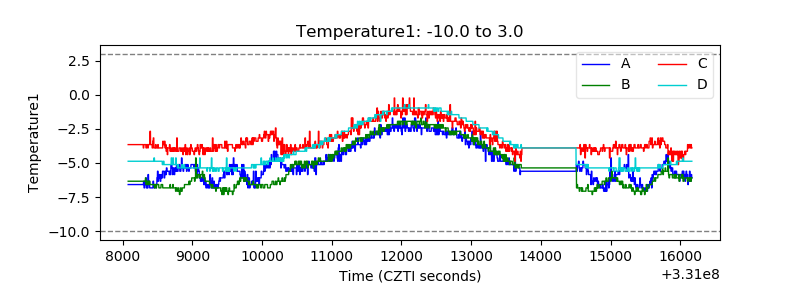 |
| Veto HV Monitor | 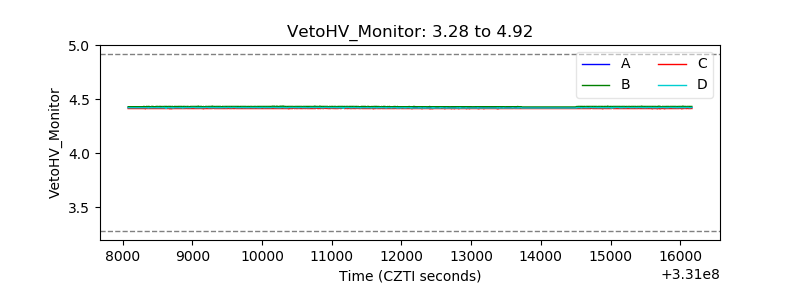 |
| Veto LLD | 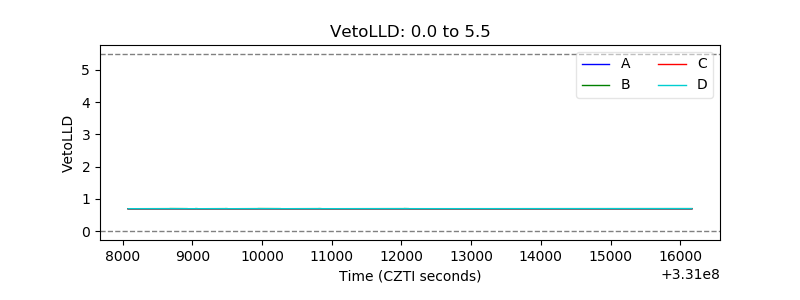 |
| Alpha Counter | 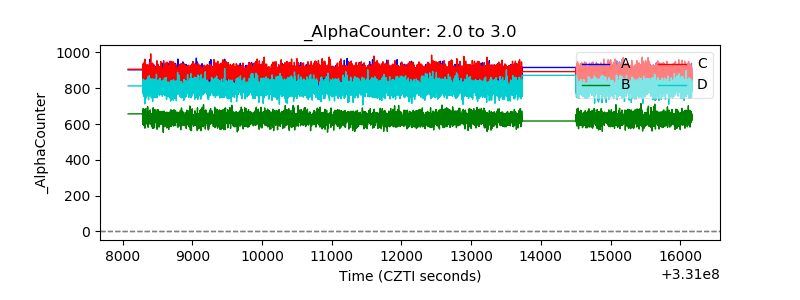 |
| _CPM_Rate | 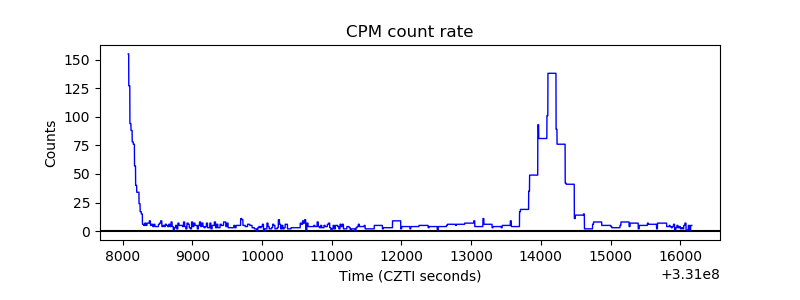 |
| CZT Counter | 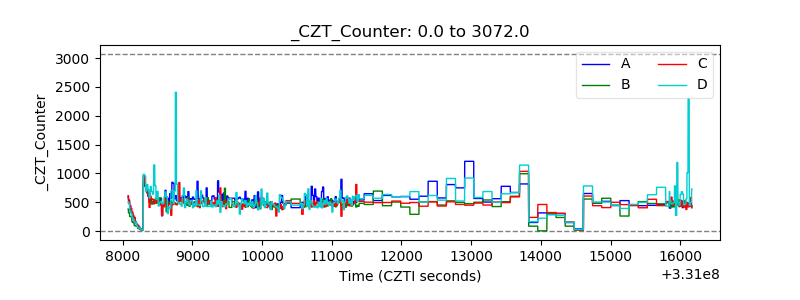 |
| +2.5 Volts monitor |  |
| +5 Volts monitor |  |
| _ROLL_ROT | 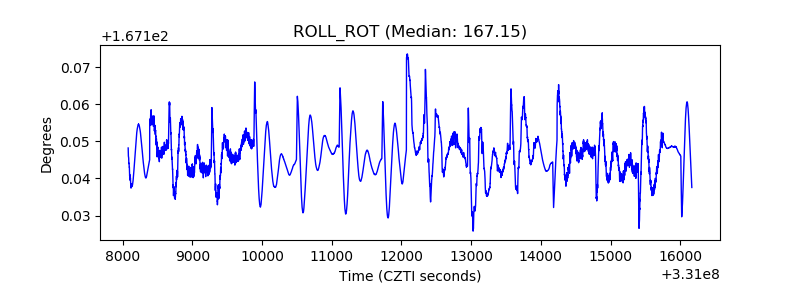 |
| _Roll_DEC | 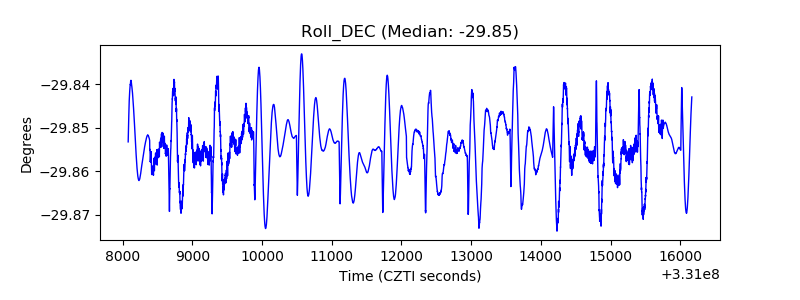 |
| _Roll_RA | 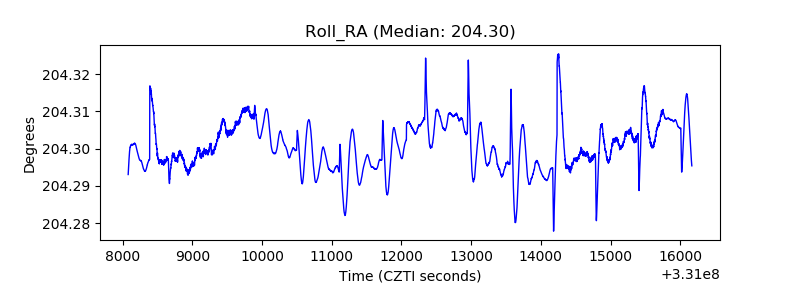 |
| Veto Counter | 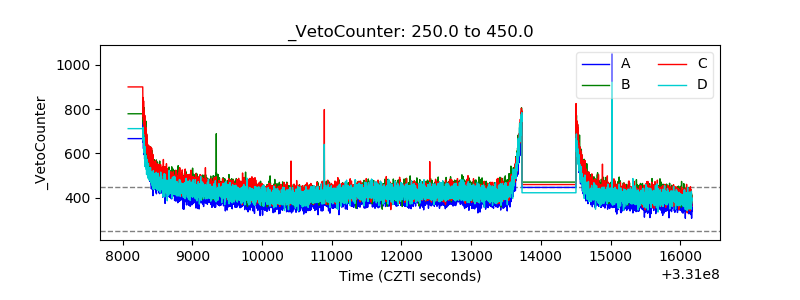 |