| Param | Original file | Final file |
|---|---|---|
| Filename | modeM0/AS1A09_043T01_9000003744_25682cztM0_level2.evt | modeM0/AS1A09_043T01_9000003744_25682cztM0_level2_quad_clean.evt |
| Size (bytes) | 580,913,280 | 80,360,640 |
| Size | 554.0 MB | 76.6 MB |
| Events in quadrant A | 4,108,385 | 486,538 |
| Events in quadrant B | 3,783,357 | 495,742 |
| Events in quadrant C | 3,739,270 | 468,845 |
| Events in quadrant D | 5,446,622 | 453,307 |
| Mode M9 | |||
|---|---|---|---|
| Quadrant | BADHDUFLAG | Total packets | Discarded packets |
| A | 0 | 11 | 0 |
| B | 0 | 11 | 0 |
| C | 0 | 11 | 0 |
| D | 0 | 11 | 0 |
| Mode M0 | |||
|---|---|---|---|
| Quadrant | BADHDUFLAG | Total packets | Discarded packets |
| A | 0 | 16685 | 0 |
| B | 0 | 15865 | 0 |
| C | 0 | 15848 | 0 |
| D | 0 | 21274 | 0 |
| Quadrant | Total seconds | Saturated seconds | Saturation percentage |
|---|---|---|---|
| A | 7594 | 194 | 2.554648% |
| B | 7595 | 188 | 2.475313% |
| C | 7595 | 205 | 2.699144% |
| D | 7595 | 278 | 3.660303% |
Noise dominated data is calculated using 1-second bins in cleaned event files. If a bin has >2000 counts, and if more than 50% of those come from <1% of pixels, then it is considered to be noise-dominated and hence unusable.
| Quadrant | # 1 sec bins | Bins with >0 counts | Bins with >2000 counts | High rate bins dominated by noise | Noise dominated (total time) | Noise dominated (detector-on time) | Marked lightcurve |
|---|---|---|---|---|---|---|---|
| A | 8714 | 7595 | 14 | 14 | 0.16% | 0.18% | 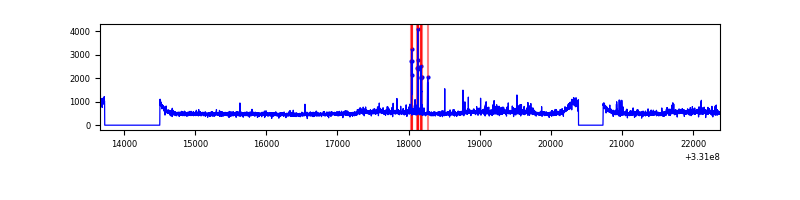 |
| B | 8715 | 7597 | 0 | 0 | 0.00% | 0.00% | 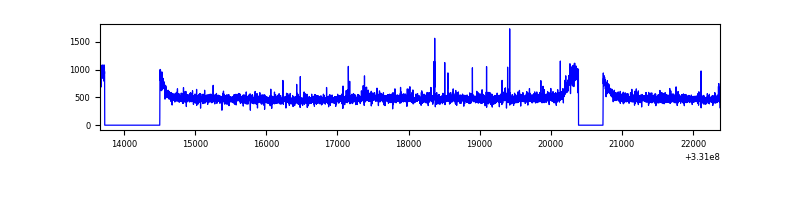 |
| C | 8715 | 7596 | 3 | 3 | 0.03% | 0.04% | 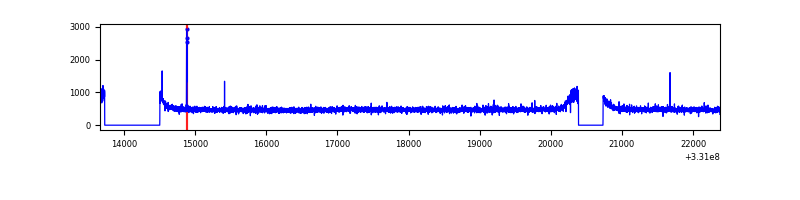 |
| D | 8715 | 7597 | 141 | 141 | 1.62% | 1.86% | 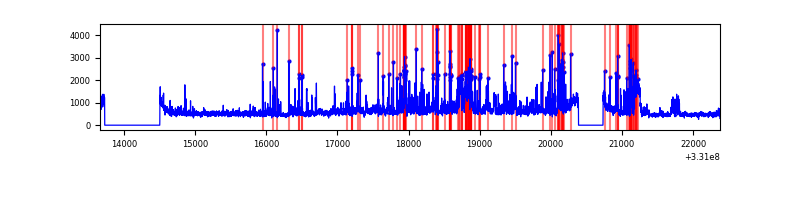 |
Top three noisy pixels from each quadrant. If the there are fewer than three noisy pixels in the level2.evt file, extra rows are filled as -1
| Pixel properties | Quadrant properties | ||||||
|---|---|---|---|---|---|---|---|
| Quadrant | DetID | PixID | Counts | Sigma | Mean | Median | Sigma |
| A | 8 | 192 | 332803 | 1719.7 | 956 | 937 | 193.0 |
| A | 0 | 13 | 88130 | 451.83 | 956 | 937 | 193.0 |
| A | 13 | 254 | 10549 | 49.81 | 956 | 937 | 193.0 |
| B | 3 | 112 | 25765 | 135.46 | 951 | 925 | 183.4 |
| B | 12 | 111 | 23039 | 120.6 | 951 | 925 | 183.4 |
| B | 11 | 111 | 20556 | 107.06 | 951 | 925 | 183.4 |
| C | 14 | 238 | 144100 | 662.57 | 914 | 920 | 216.1 |
| C | 14 | 225 | 22831 | 101.39 | 914 | 920 | 216.1 |
| C | 3 | 233 | 9195 | 38.29 | 914 | 920 | 216.1 |
| D | 1 | 52 | 1005841 | 4464.93 | 919 | 893 | 225.1 |
| D | 8 | 195 | 521624 | 2313.58 | 919 | 893 | 225.1 |
| D | 2 | 244 | 188321 | 832.73 | 919 | 893 | 225.1 |
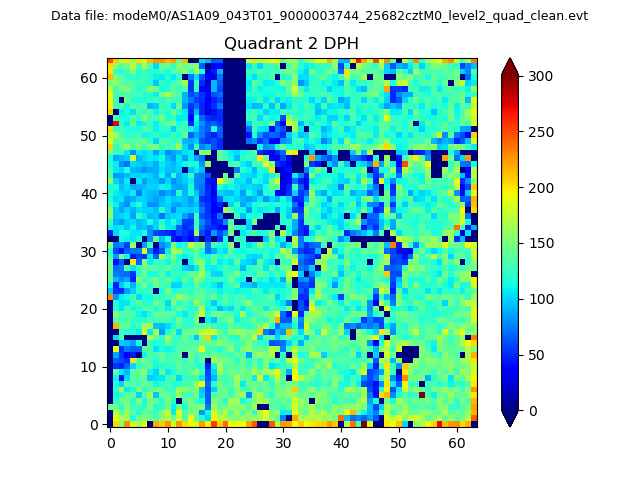
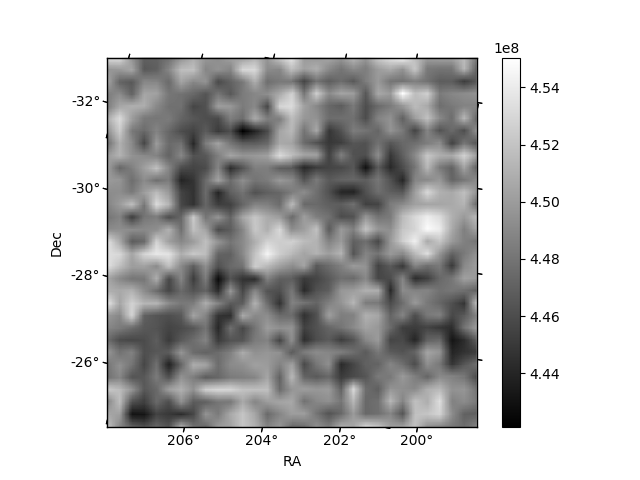
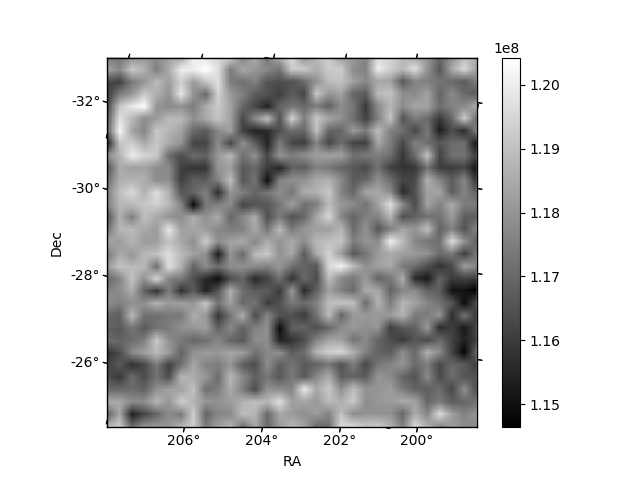
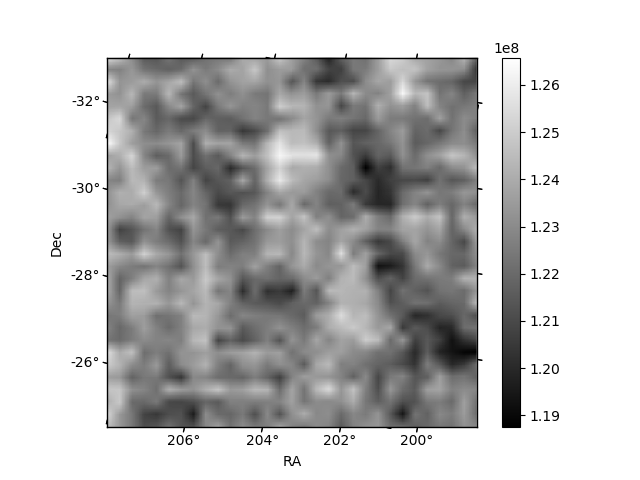
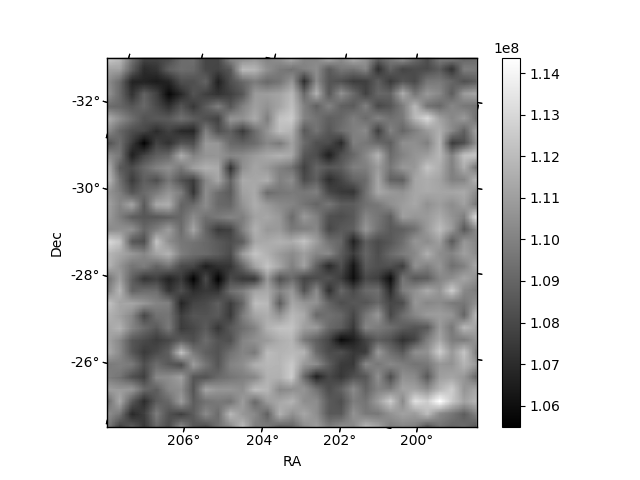
Histogram calculated using DETX and DETY for each event in the final _common_clean file
| Quadrant A | 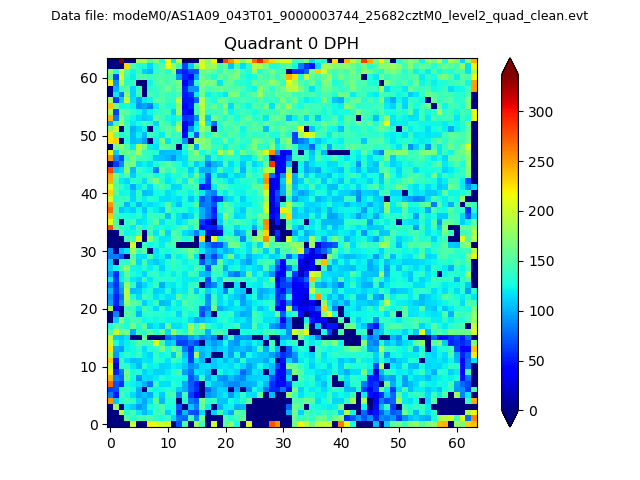 |
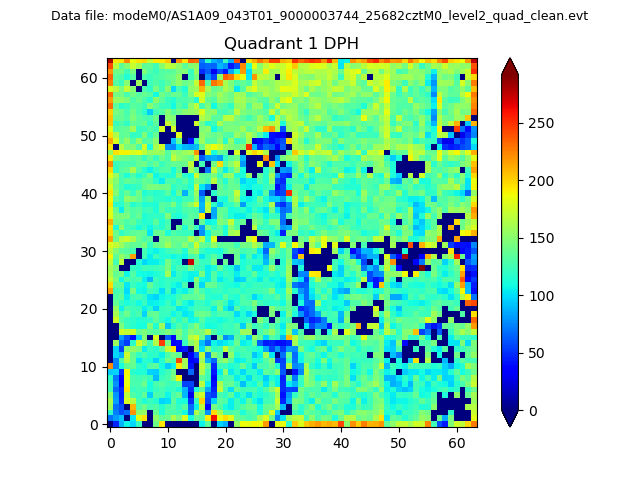 |
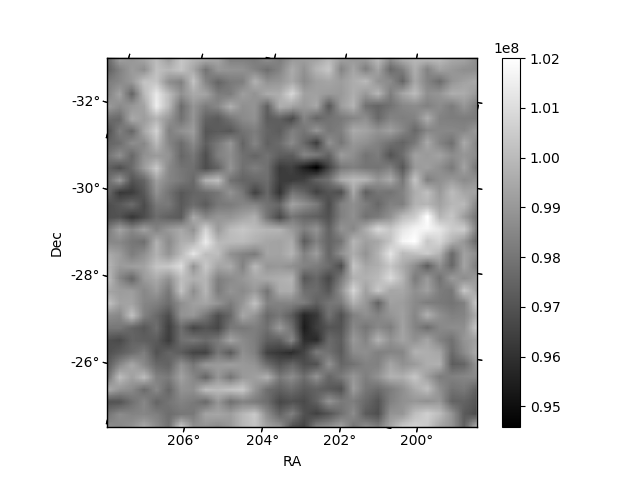
Quadrant B |
|---|---|---|---|
| Quadrant D | 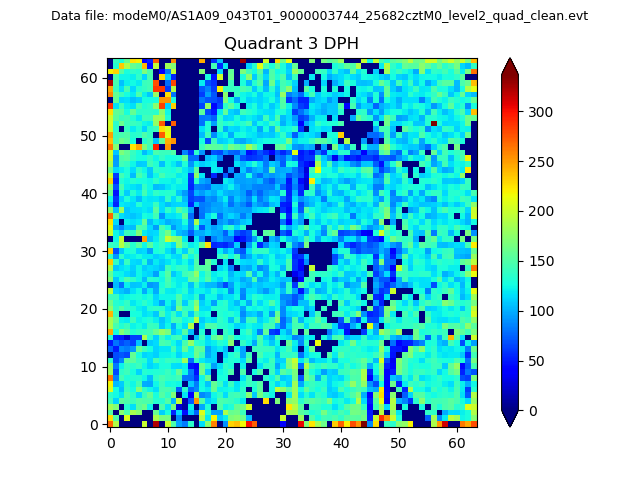 |
 |
Quadrant C |
| Plot type | Count rate plots | Images |
|---|---|---|
| Comparison with Poisson distribution Blue bars denote a histogram of data divided into 1 sec bins. Red curve is a Poisson curve with rate = median count rate of data. |
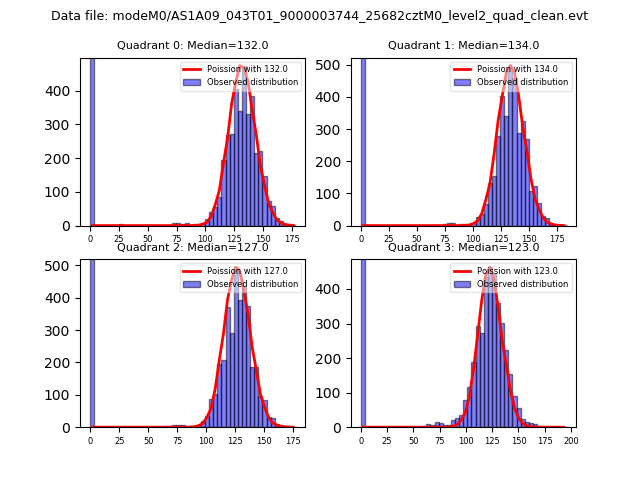 |
 |
| Quadrant-wise count rates Data is divided into 100 sec bins |
 |
|
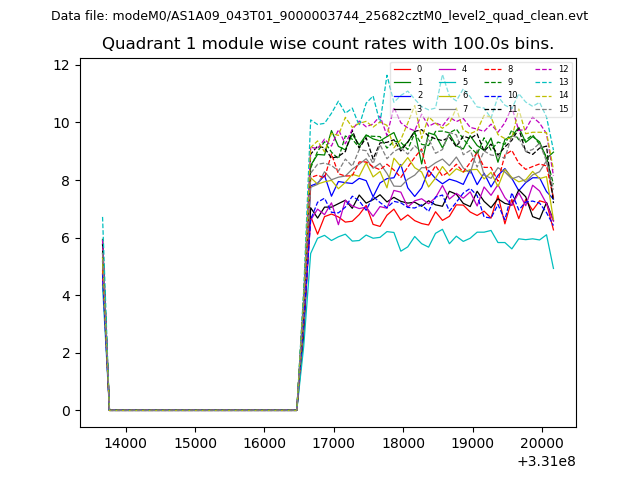
| Module-wise count rates for Quadrant A Data is divided into 100 sec bins |
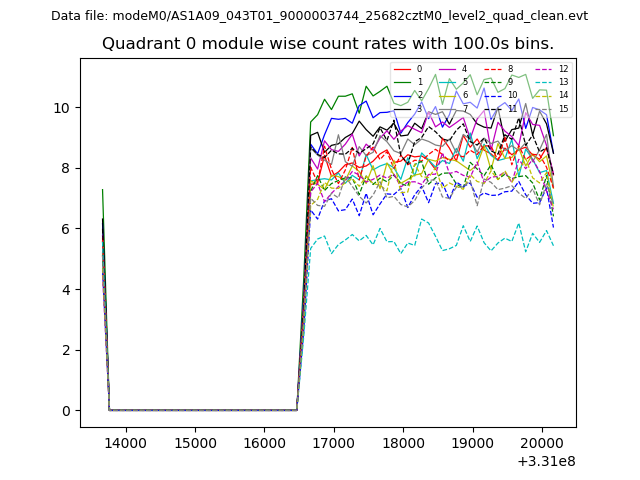 |
 |
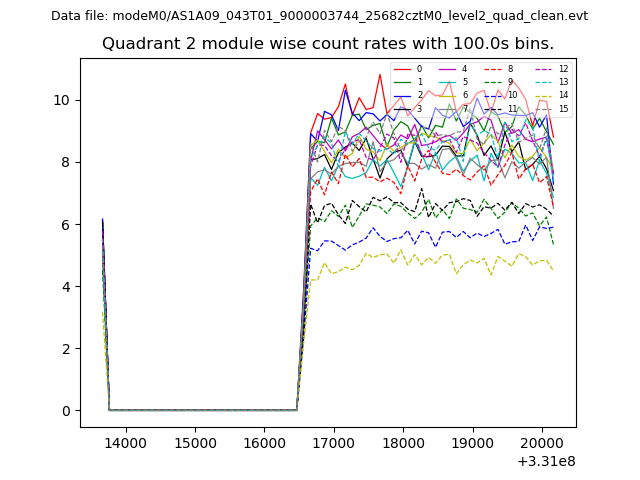
| Module-wise count rates for Quadrant B Data is divided into 100 sec bins |
 |
 |
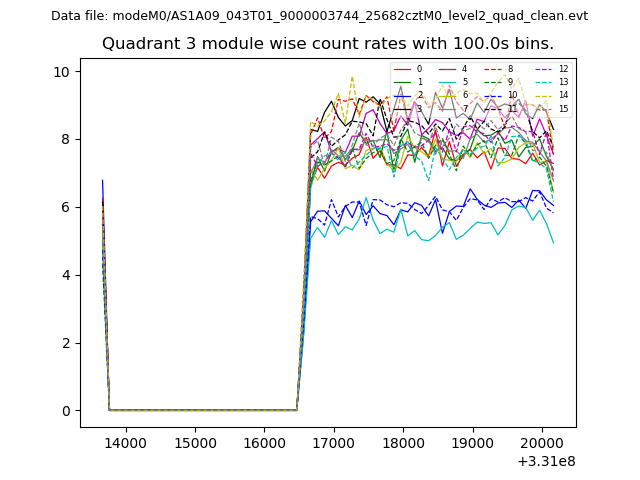
| Module-wise count rates for Quadrant C Data is divided into 100 sec bins |
 |
 |
| Module-wise count rates for Quadrant D Data is divided into 100 sec bins |
 |
 |
| Parameter | Plot |
|---|---|
| CZT HV Monitor | 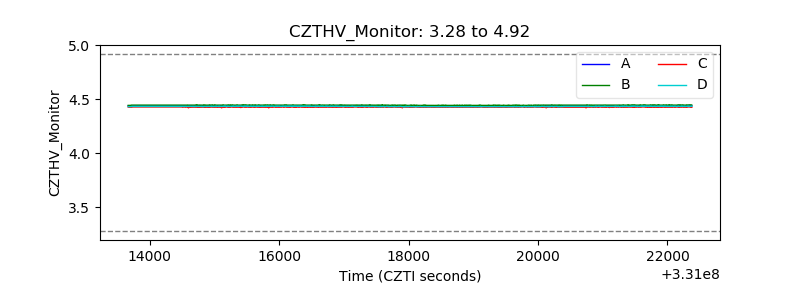 |
| D_VDD | 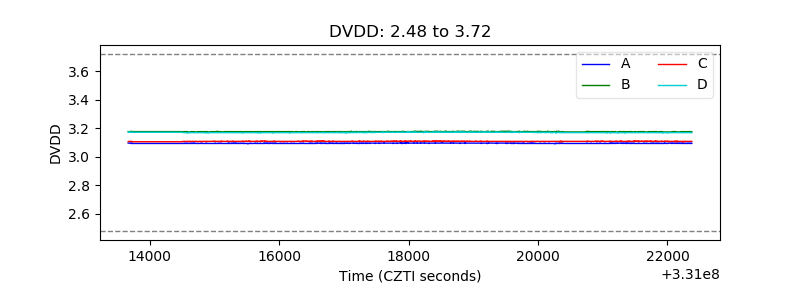 |
| Temperature 1 | 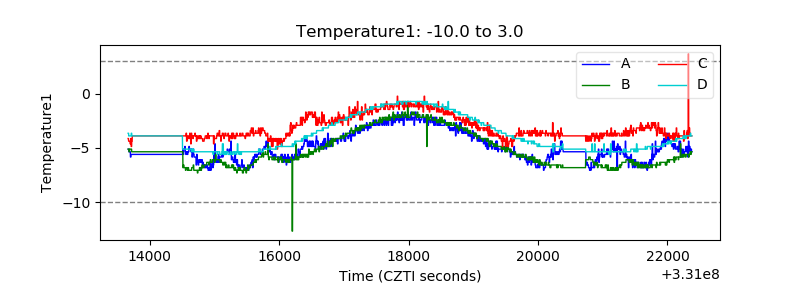 |
| Veto HV Monitor | 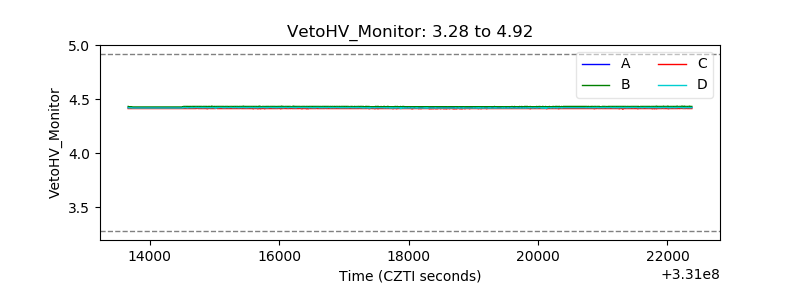 |
| Veto LLD | 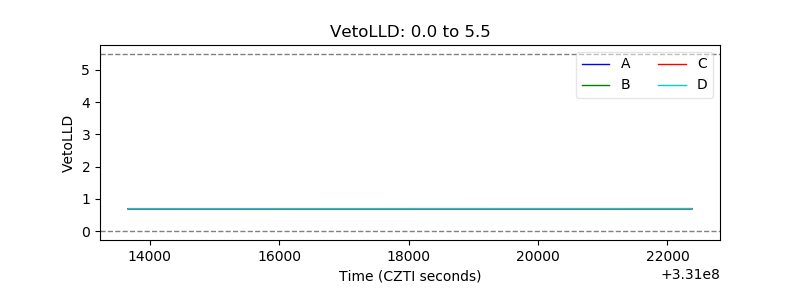 |
| Alpha Counter |  |
| _CPM_Rate |  |
| CZT Counter | 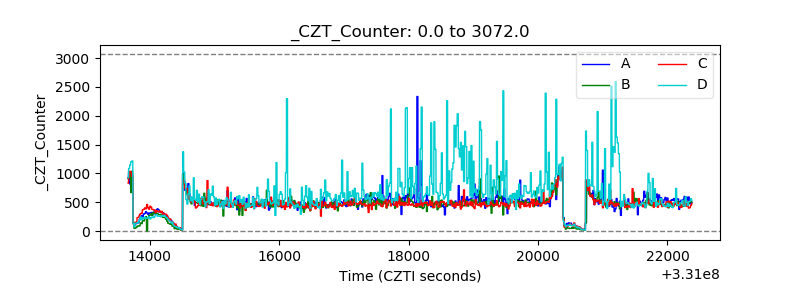 |
| +2.5 Volts monitor |  |
| +5 Volts monitor |  |
| _ROLL_ROT | 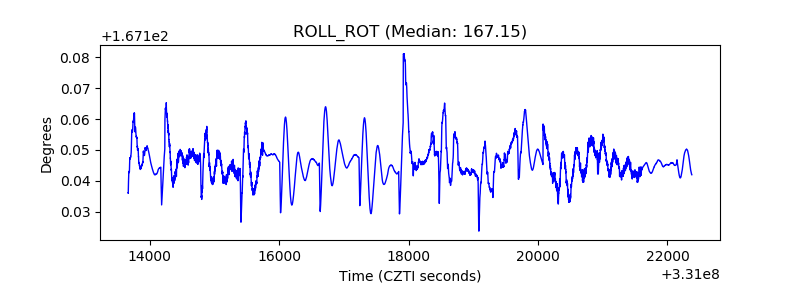 |
| _Roll_DEC | 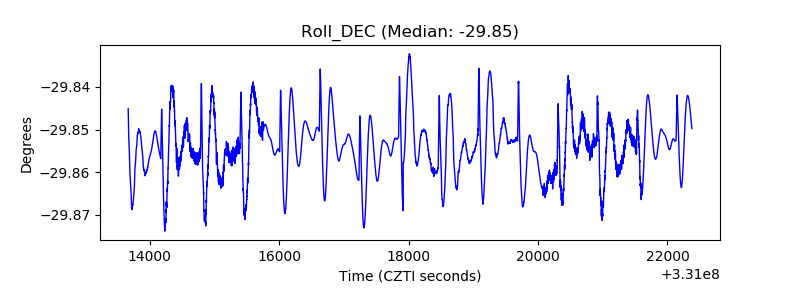 |
| _Roll_RA | 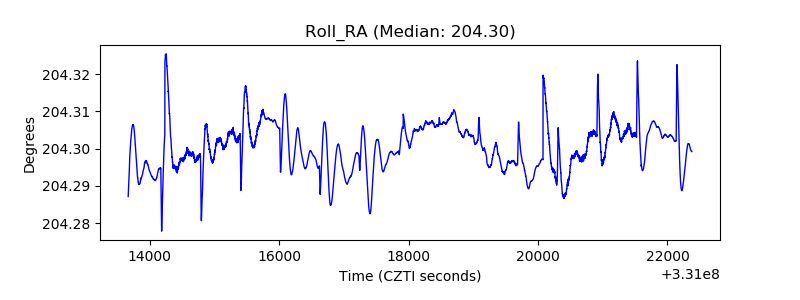 |
| Veto Counter | 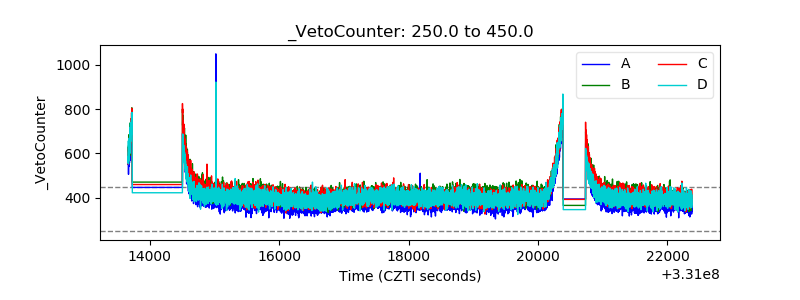 |