| Param | Original file | Final file |
|---|---|---|
| Filename | modeM0/AS1A09_043T01_9000003744_25683cztM0_level2.evt | modeM0/AS1A09_043T01_9000003744_25683cztM0_level2_quad_clean.evt |
| Size (bytes) | 656,798,400 | 96,816,960 |
| Size | 626.4 MB | 92.3 MB |
| Events in quadrant A | 5,109,410 | 596,184 |
| Events in quadrant B | 4,310,357 | 605,511 |
| Events in quadrant C | 4,314,294 | 572,700 |
| Events in quadrant D | 5,574,242 | 560,442 |
| Mode M9 | |||
|---|---|---|---|
| Quadrant | BADHDUFLAG | Total packets | Discarded packets |
| A | 0 | 3 | 0 |
| B | 0 | 3 | 0 |
| C | 0 | 3 | 0 |
| D | 0 | 3 | 0 |
| Mode M0 | |||
|---|---|---|---|
| Quadrant | BADHDUFLAG | Total packets | Discarded packets |
| A | 0 | 20290 | 0 |
| B | 0 | 18087 | 0 |
| C | 0 | 18185 | 0 |
| D | 0 | 21942 | 0 |
| Quadrant | Total seconds | Saturated seconds | Saturation percentage |
|---|---|---|---|
| A | 8590 | 488 | 5.681024% |
| B | 8591 | 339 | 3.945990% |
| C | 8591 | 360 | 4.190432% |
| D | 8591 | 381 | 4.434874% |
Noise dominated data is calculated using 1-second bins in cleaned event files. If a bin has >2000 counts, and if more than 50% of those come from <1% of pixels, then it is considered to be noise-dominated and hence unusable.
| Quadrant | # 1 sec bins | Bins with >0 counts | Bins with >2000 counts | High rate bins dominated by noise | Noise dominated (total time) | Noise dominated (detector-on time) | Marked lightcurve |
|---|---|---|---|---|---|---|---|
| A | 9040 | 8590 | 78 | 78 | 0.86% | 0.91% | 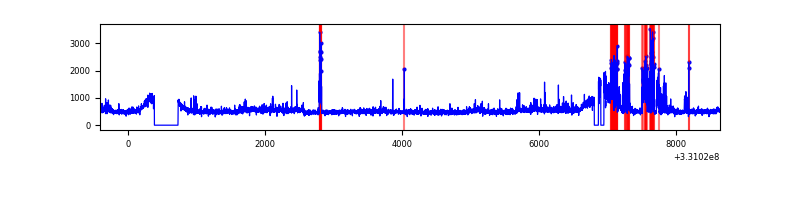 |
| B | 9041 | 8593 | 0 | 0 | 0.00% | 0.00% | 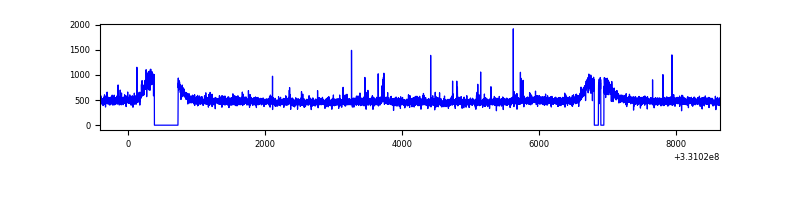 |
| C | 9041 | 8593 | 6 | 6 | 0.07% | 0.07% | 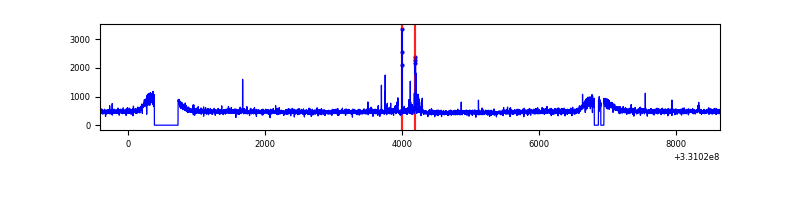 |
| D | 9041 | 8593 | 74 | 74 | 0.82% | 0.86% | 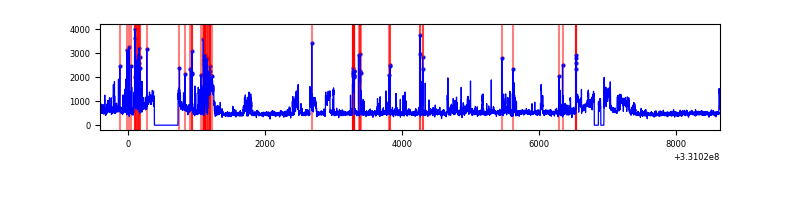 |
Top three noisy pixels from each quadrant. If the there are fewer than three noisy pixels in the level2.evt file, extra rows are filled as -1
| Pixel properties | Quadrant properties | ||||||
|---|---|---|---|---|---|---|---|
| Quadrant | DetID | PixID | Counts | Sigma | Mean | Median | Sigma |
| A | 0 | 13 | 623945 | 2845.88 | 1079 | 1057 | 218.9 |
| A | 8 | 192 | 317069 | 1443.81 | 1079 | 1057 | 218.9 |
| A | 13 | 254 | 12243 | 51.11 | 1079 | 1057 | 218.9 |
| B | 3 | 112 | 33124 | 150.71 | 1084 | 1055 | 212.8 |
| B | 12 | 111 | 26716 | 120.6 | 1084 | 1055 | 212.8 |
| B | 11 | 111 | 23950 | 107.6 | 1084 | 1055 | 212.8 |
| C | 14 | 238 | 162873 | 655.62 | 1042 | 1048 | 246.8 |
| C | 14 | 225 | 83214 | 332.89 | 1042 | 1048 | 246.8 |
| C | 3 | 233 | 7795 | 27.33 | 1042 | 1048 | 246.8 |
| D | 1 | 52 | 953468 | 3694.02 | 1052 | 1019 | 257.8 |
| D | 8 | 195 | 318095 | 1229.76 | 1052 | 1019 | 257.8 |
| D | 13 | 104 | 134943 | 519.42 | 1052 | 1019 | 257.8 |
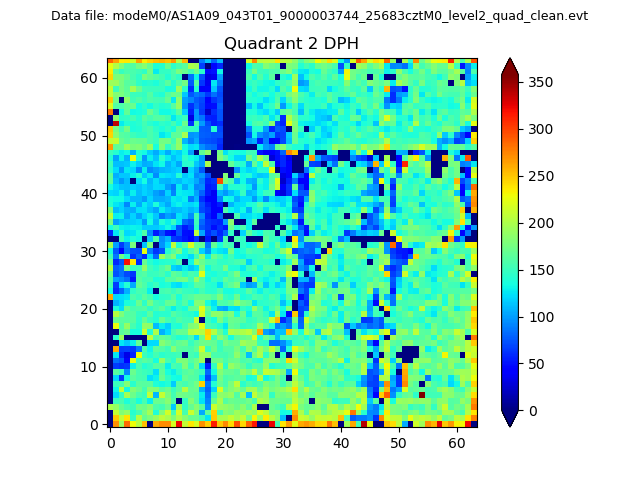
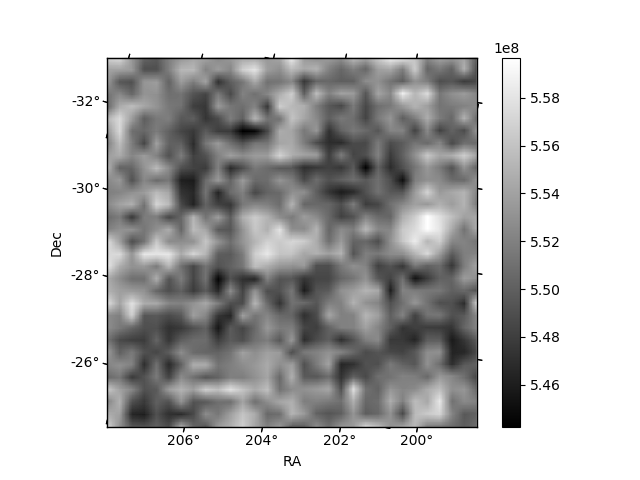
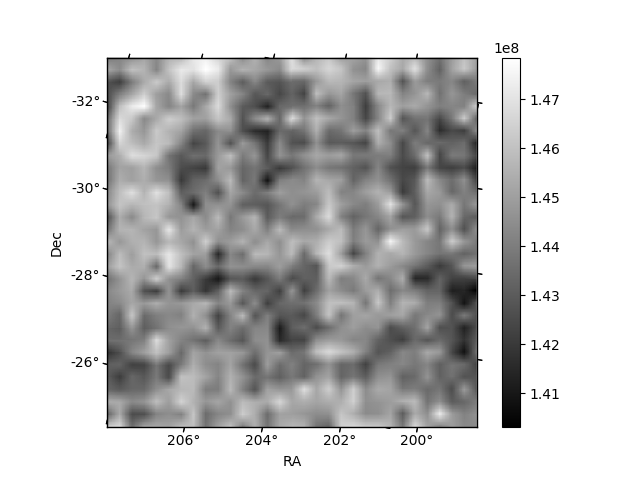
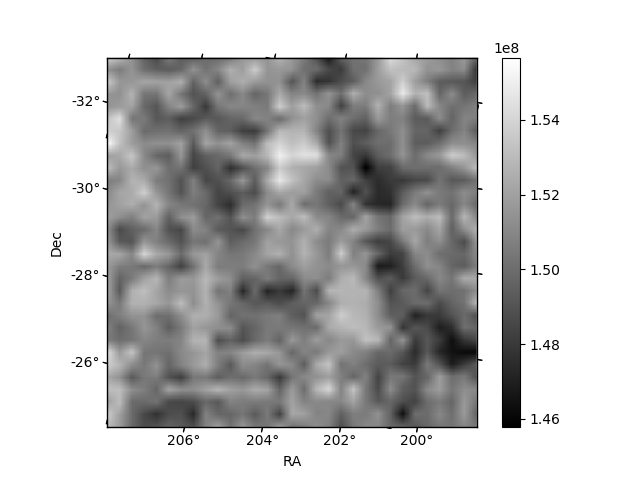
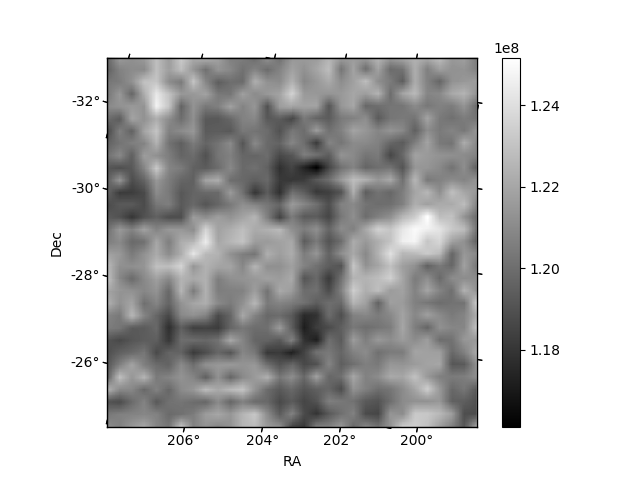
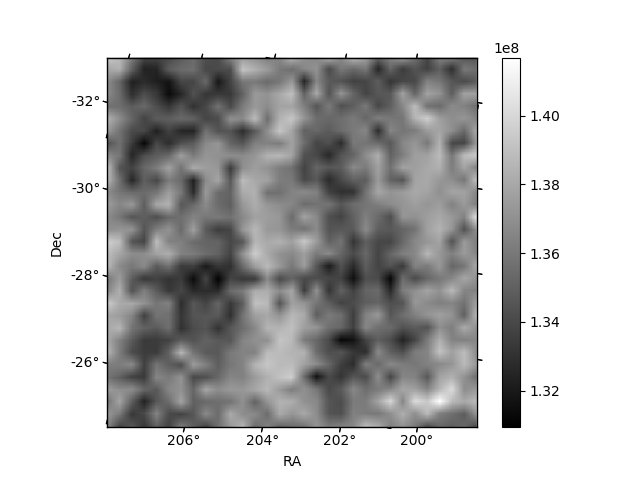
Histogram calculated using DETX and DETY for each event in the final _common_clean file
| Quadrant A | 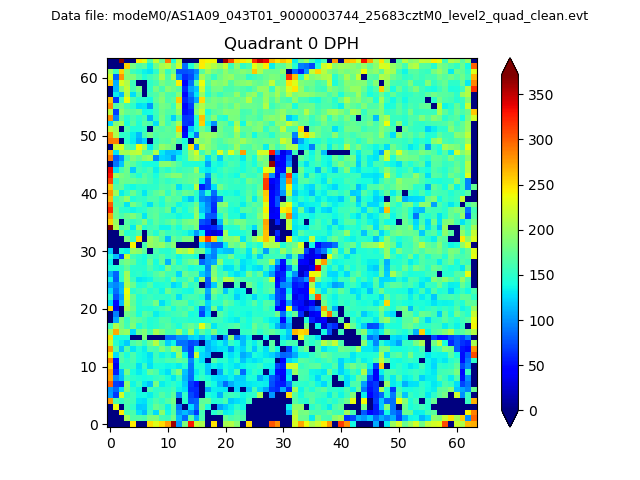 |
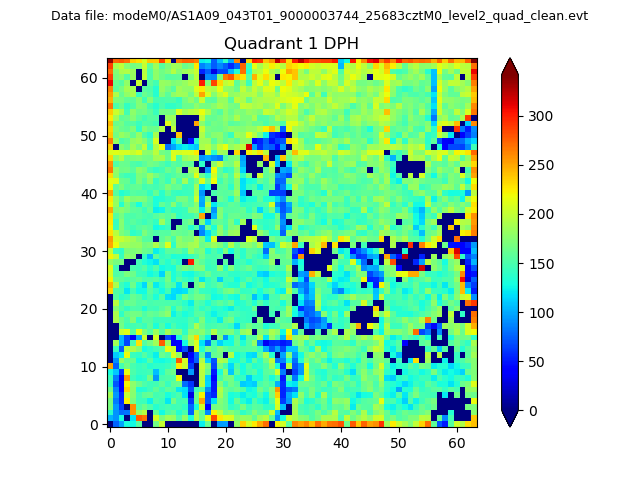 |
Quadrant B |
|---|---|---|---|
| Quadrant D | 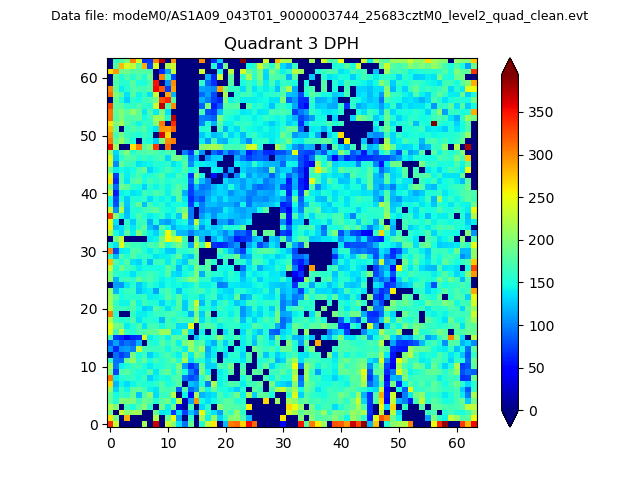 |
 |
Quadrant C |
| Plot type | Count rate plots | Images |
|---|---|---|
| Comparison with Poisson distribution Blue bars denote a histogram of data divided into 1 sec bins. Red curve is a Poisson curve with rate = median count rate of data. |
 |
 |
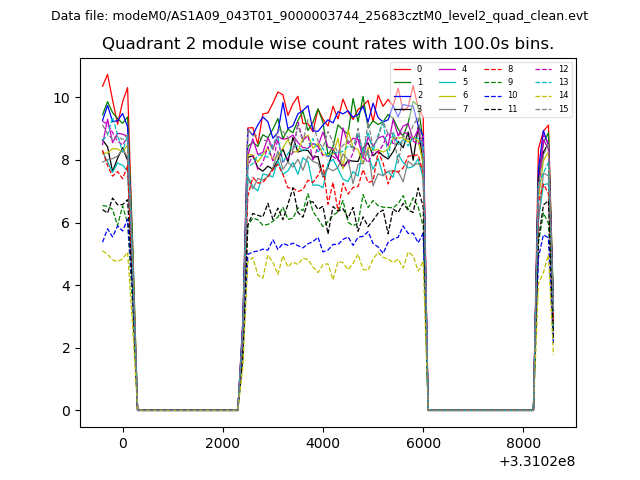
| Quadrant-wise count rates Data is divided into 100 sec bins |
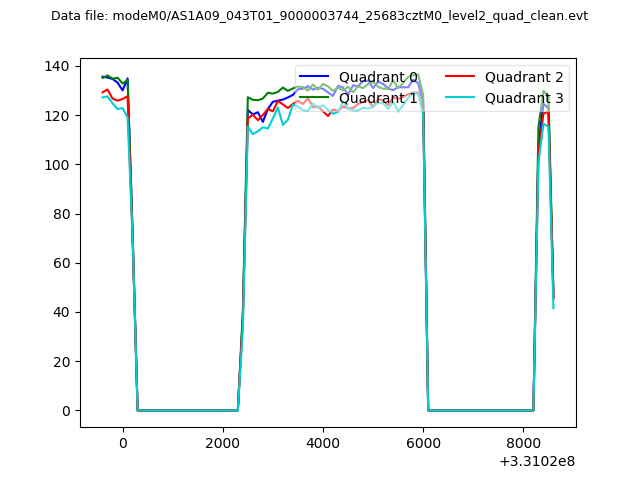 |
|
| Module-wise count rates for Quadrant A Data is divided into 100 sec bins |
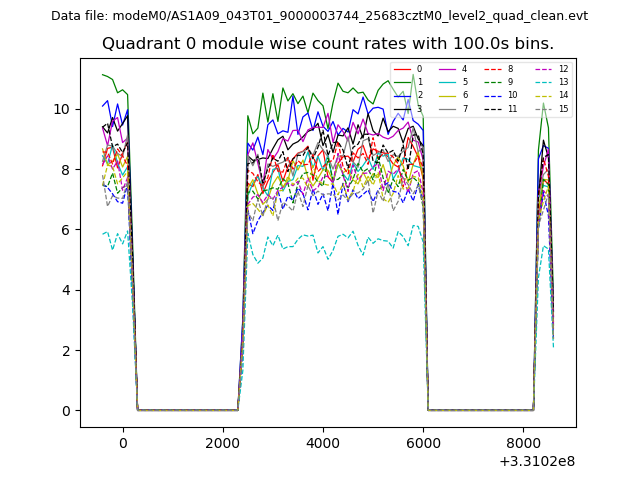 |
 |
| Module-wise count rates for Quadrant B Data is divided into 100 sec bins |
 |
 |
| Module-wise count rates for Quadrant C Data is divided into 100 sec bins |
 |
 |
| Module-wise count rates for Quadrant D Data is divided into 100 sec bins |
 |
 |
| Parameter | Plot |
|---|---|
| CZT HV Monitor | 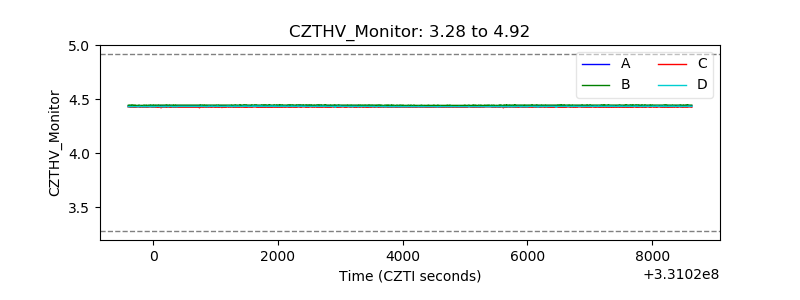 |
| D_VDD | 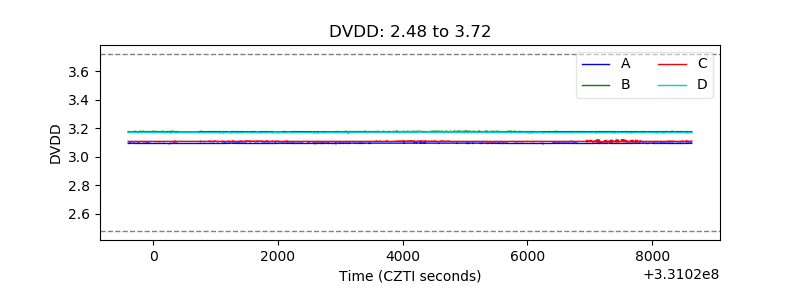 |
| Temperature 1 | 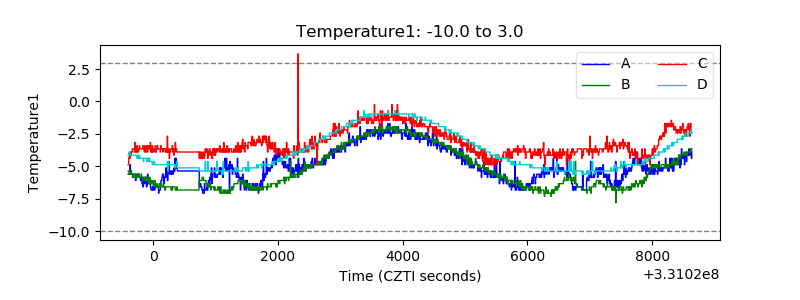 |
| Veto HV Monitor | 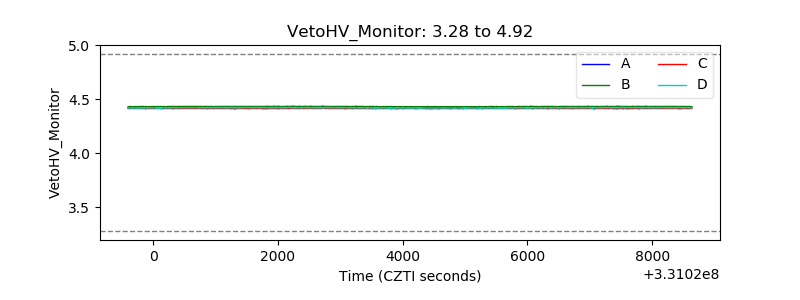 |
| Veto LLD | 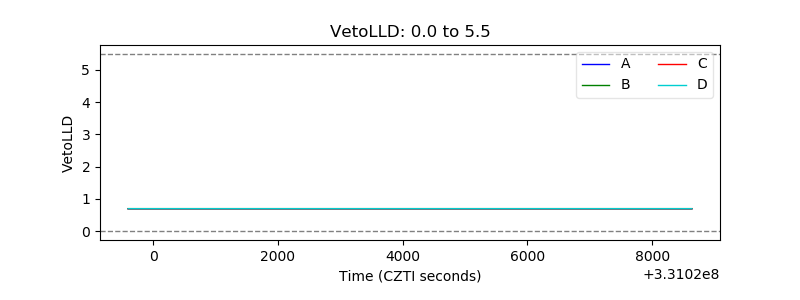 |
| Alpha Counter | 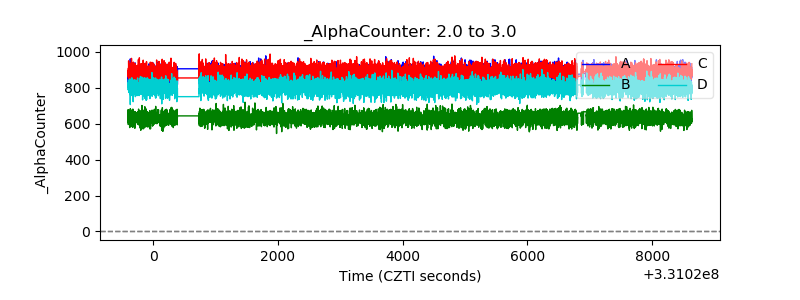 |
| _CPM_Rate | 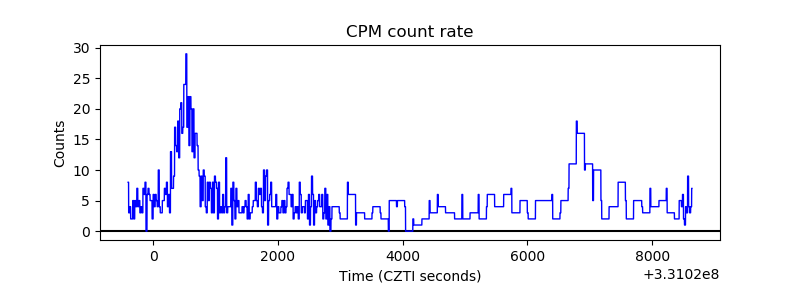 |
| CZT Counter | 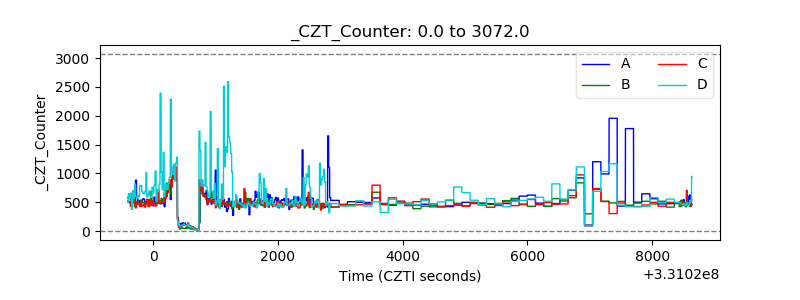 |
| +2.5 Volts monitor |  |
| +5 Volts monitor |  |
| _ROLL_ROT | 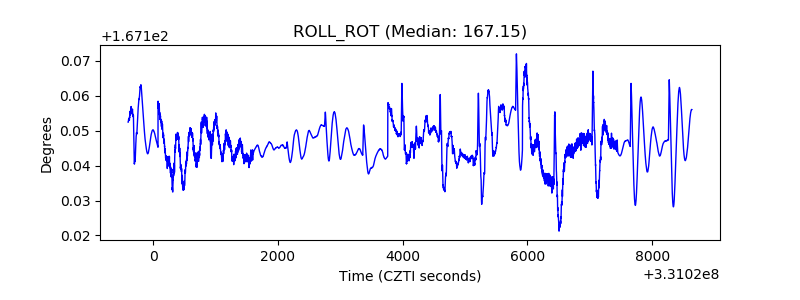 |
| _Roll_DEC | 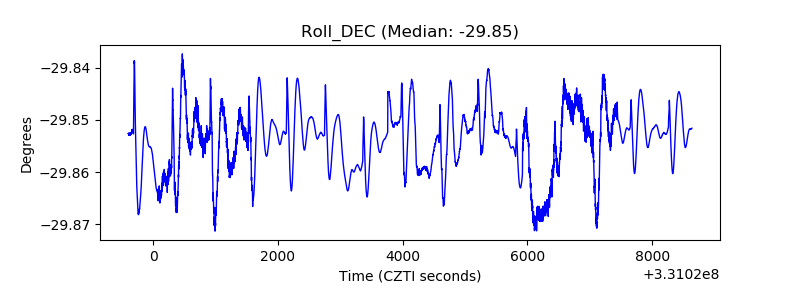 |
| _Roll_RA | 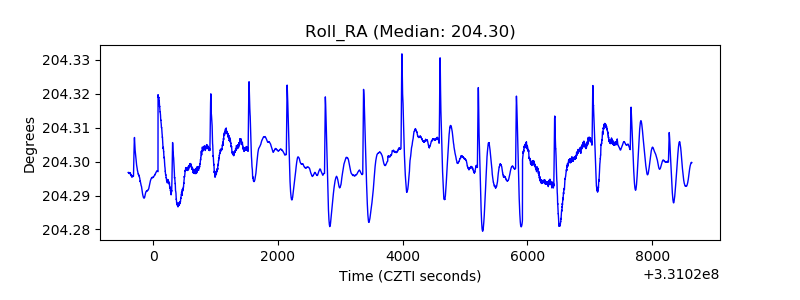 |
| Veto Counter |  |