| Param | Original file | Final file |
|---|---|---|
| Filename | modeM0/AS1A09_043T01_9000003744_25684cztM0_level2.evt | modeM0/AS1A09_043T01_9000003744_25684cztM0_level2_quad_clean.evt |
| Size (bytes) | 600,923,520 | 90,864,000 |
| Size | 573.1 MB | 86.7 MB |
| Events in quadrant A | 4,528,921 | 566,664 |
| Events in quadrant B | 3,767,379 | 577,687 |
| Events in quadrant C | 3,725,510 | 545,537 |
| Events in quadrant D | 5,654,322 | 525,166 |
| Mode M9 | |||
|---|---|---|---|
| Quadrant | BADHDUFLAG | Total packets | Discarded packets |
| A | 0 | 3 | 0 |
| B | 0 | 3 | 0 |
| C | 0 | 3 | 0 |
| D | 0 | 3 | 0 |
| Mode M0 | |||
|---|---|---|---|
| Quadrant | BADHDUFLAG | Total packets | Discarded packets |
| A | 0 | 17891 | 0 |
| B | 0 | 15940 | 0 |
| C | 0 | 15847 | 0 |
| D | 0 | 21756 | 0 |
| Quadrant | Total seconds | Saturated seconds | Saturation percentage |
|---|---|---|---|
| A | 7707 | 311 | 4.035293% |
| B | 7707 | 184 | 2.387440% |
| C | 7707 | 203 | 2.633969% |
| D | 7707 | 353 | 4.580252% |
Noise dominated data is calculated using 1-second bins in cleaned event files. If a bin has >2000 counts, and if more than 50% of those come from <1% of pixels, then it is considered to be noise-dominated and hence unusable.
| Quadrant | # 1 sec bins | Bins with >0 counts | Bins with >2000 counts | High rate bins dominated by noise | Noise dominated (total time) | Noise dominated (detector-on time) | Marked lightcurve |
|---|---|---|---|---|---|---|---|
| A | 8042 | 7707 | 68 | 68 | 0.85% | 0.88% | 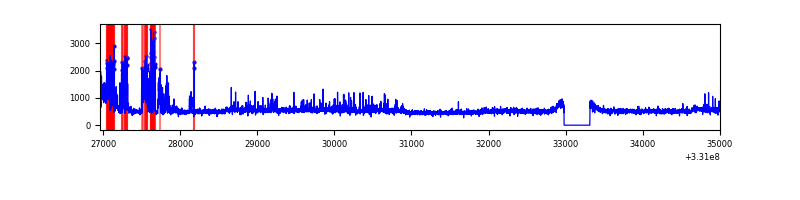 |
| B | 8042 | 7708 | 2 | 2 | 0.02% | 0.03% | 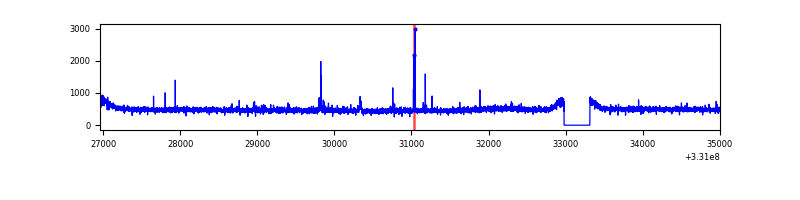 |
| C | 8042 | 7707 | 0 | 0 | 0.00% | 0.00% | 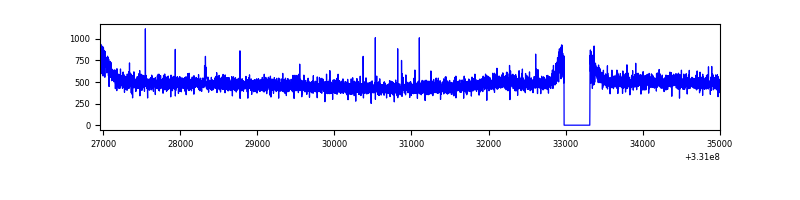 |
| D | 8042 | 7708 | 352 | 352 | 4.38% | 4.57% | 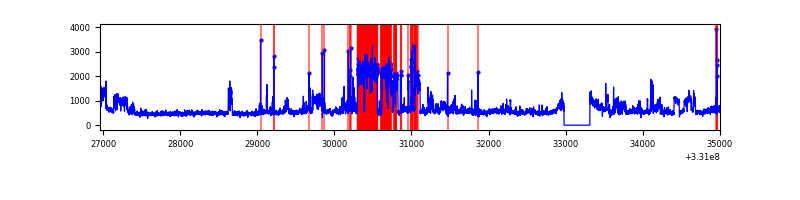 |
Top three noisy pixels from each quadrant. If the there are fewer than three noisy pixels in the level2.evt file, extra rows are filled as -1
| Pixel properties | Quadrant properties | ||||||
|---|---|---|---|---|---|---|---|
| Quadrant | DetID | PixID | Counts | Sigma | Mean | Median | Sigma |
| A | 0 | 13 | 502040 | 2638.49 | 945 | 924 | 189.9 |
| A | 8 | 192 | 378386 | 1987.42 | 945 | 924 | 189.9 |
| A | 13 | 254 | 10706 | 51.5 | 945 | 924 | 189.9 |
| B | 0 | 245 | 24153 | 126.26 | 948 | 923 | 184.0 |
| B | 12 | 111 | 23028 | 120.15 | 948 | 923 | 184.0 |
| B | 11 | 111 | 20779 | 107.92 | 948 | 923 | 184.0 |
| C | 14 | 238 | 146668 | 677.47 | 913 | 916 | 215.1 |
| C | 3 | 233 | 17341 | 76.34 | 913 | 916 | 215.1 |
| C | 13 | 61 | 6256 | 24.82 | 913 | 916 | 215.1 |
| D | 1 | 52 | 1738636 | 7721.57 | 919 | 889 | 225.1 |
| D | 8 | 195 | 269389 | 1193.06 | 919 | 889 | 225.1 |
| D | 13 | 104 | 88491 | 389.25 | 919 | 889 | 225.1 |
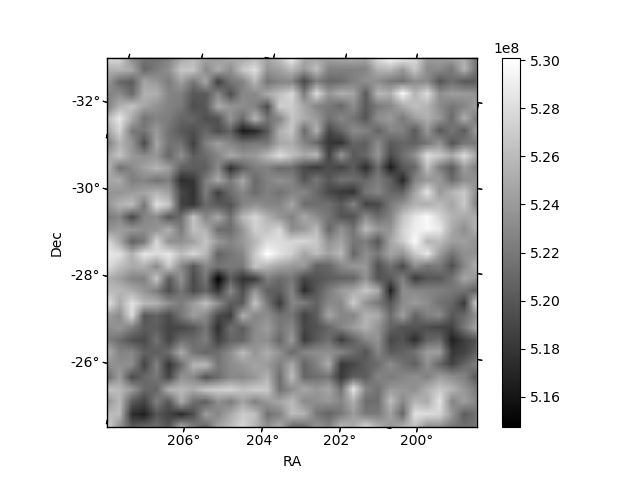
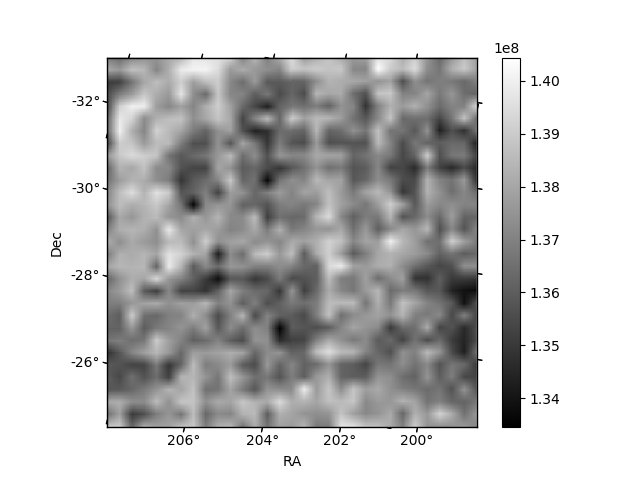
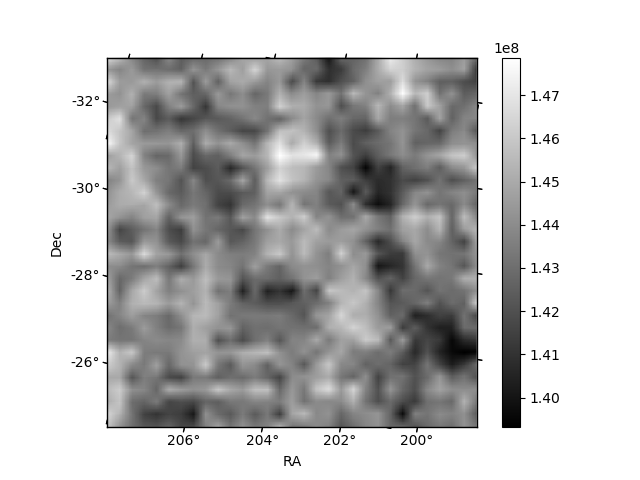
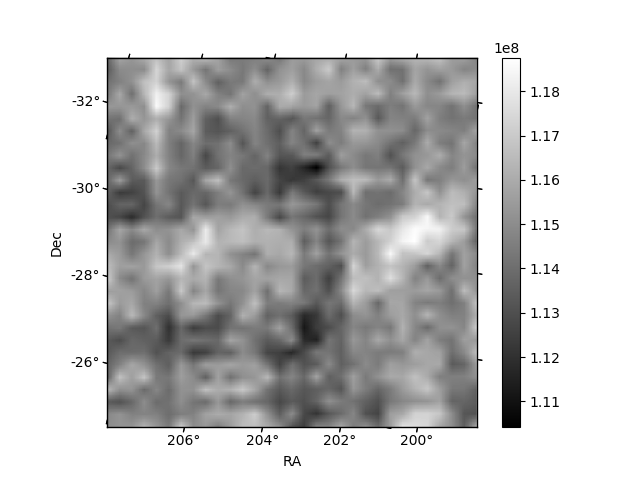
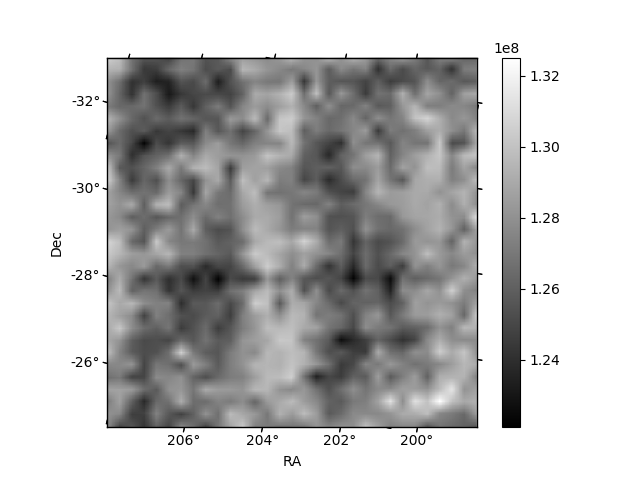
Histogram calculated using DETX and DETY for each event in the final _common_clean file
| Quadrant A | 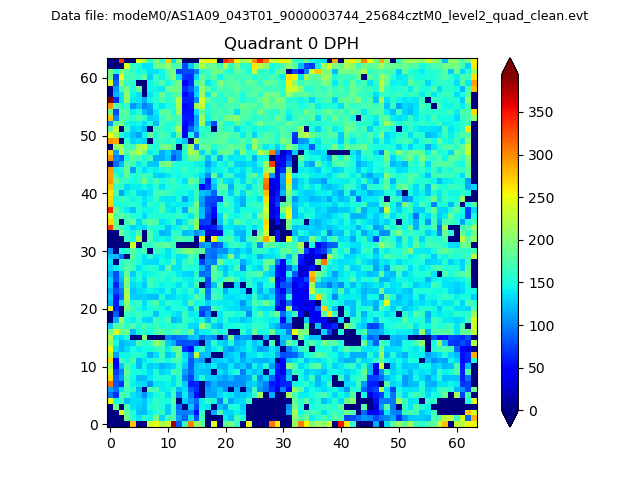 |
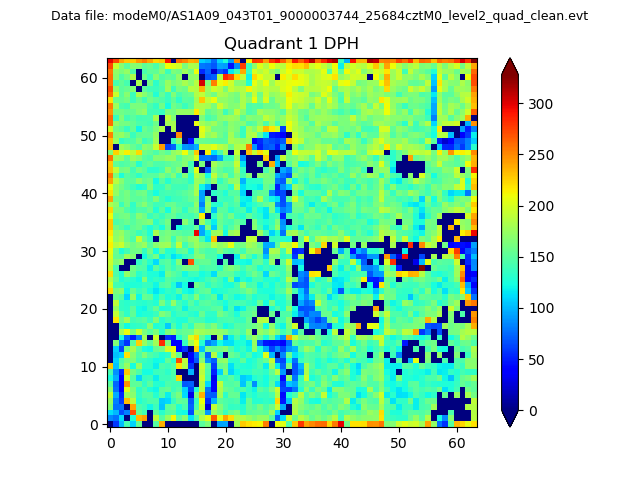 |
Quadrant B |
|---|---|---|---|
| Quadrant D |  |
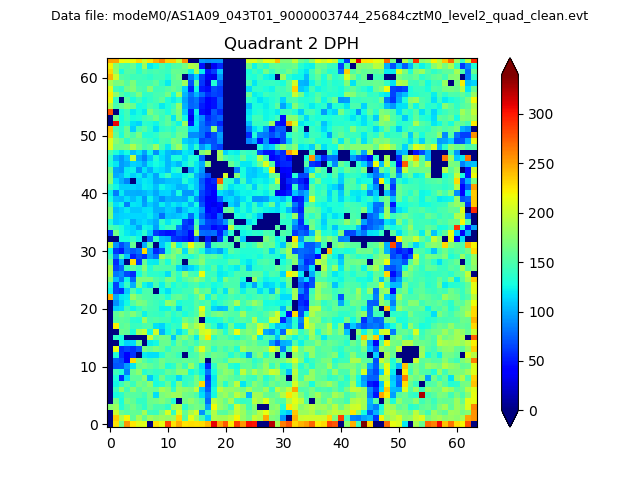 |
Quadrant C |
| Plot type | Count rate plots | Images |
|---|---|---|
| Comparison with Poisson distribution Blue bars denote a histogram of data divided into 1 sec bins. Red curve is a Poisson curve with rate = median count rate of data. |
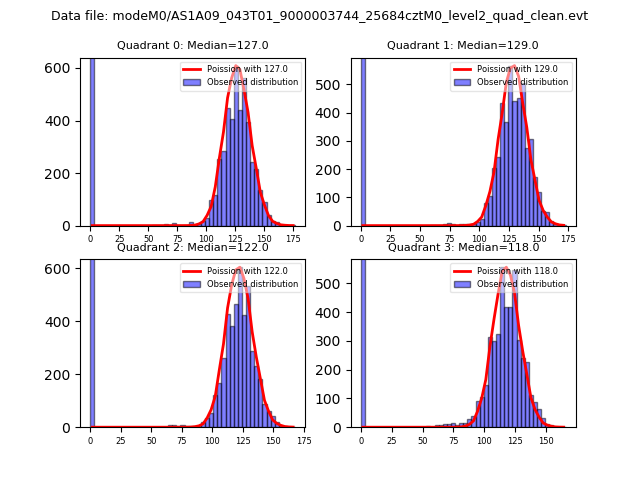 |
 |
| Quadrant-wise count rates Data is divided into 100 sec bins |
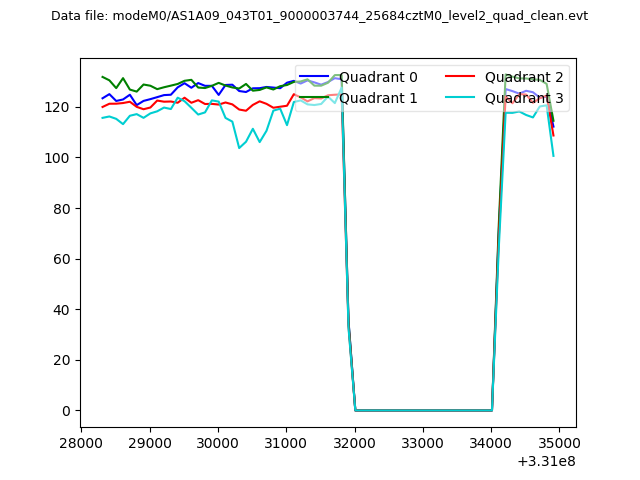 |
|
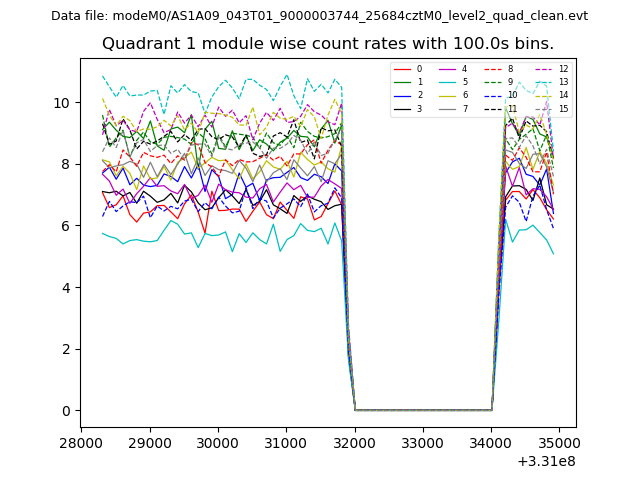
| Module-wise count rates for Quadrant A Data is divided into 100 sec bins |
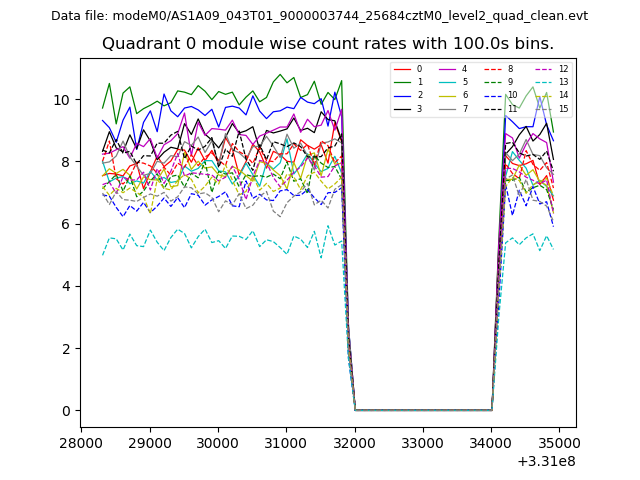 |
 |
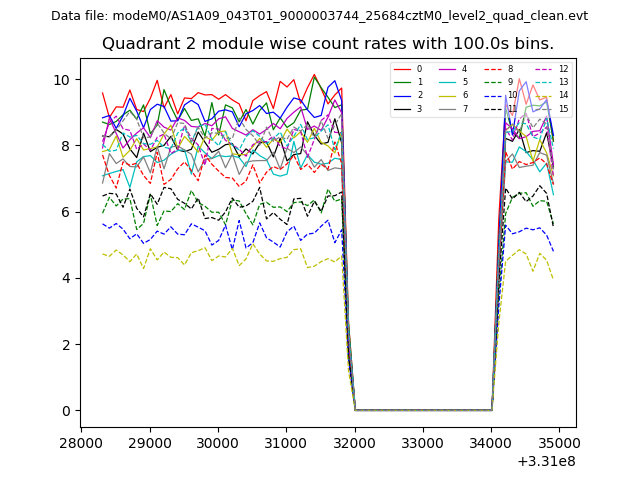
| Module-wise count rates for Quadrant B Data is divided into 100 sec bins |
 |
 |
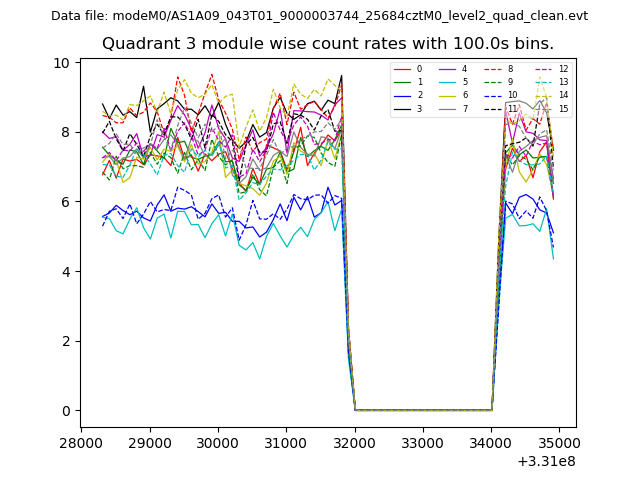
| Module-wise count rates for Quadrant C Data is divided into 100 sec bins |
 |
 |
| Module-wise count rates for Quadrant D Data is divided into 100 sec bins |
 |
 |
| Parameter | Plot |
|---|---|
| CZT HV Monitor | 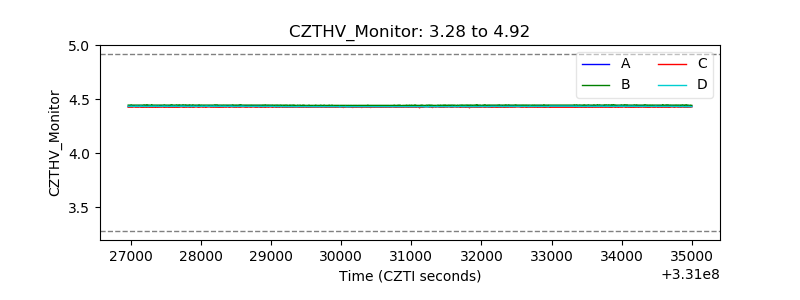 |
| D_VDD | 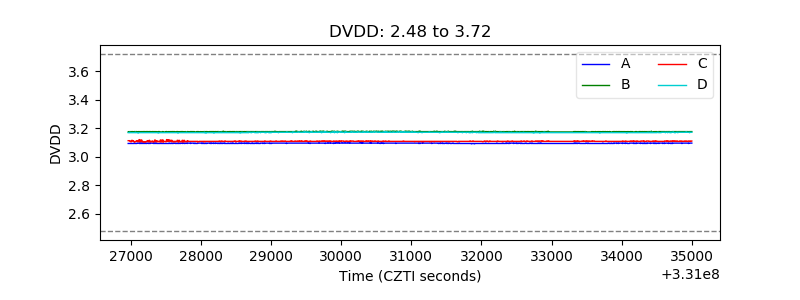 |
| Temperature 1 | 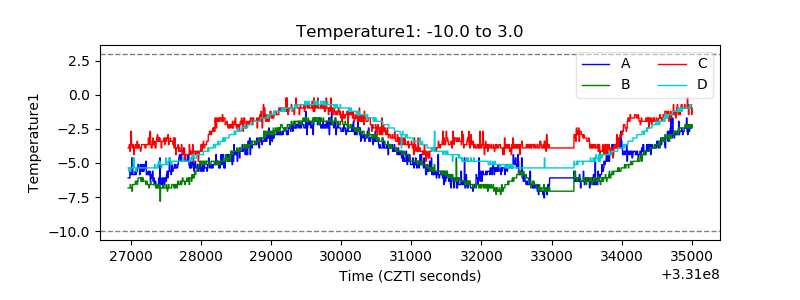 |
| Veto HV Monitor |  |
| Veto LLD | 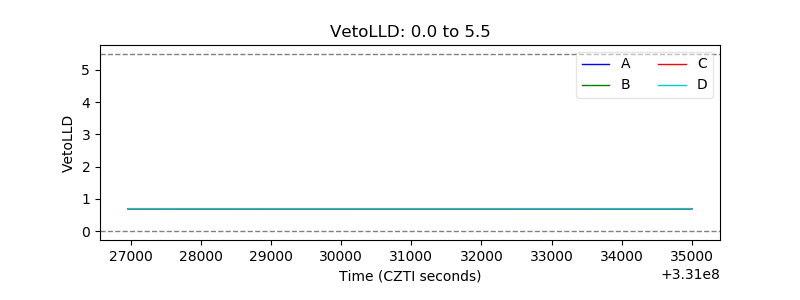 |
| Alpha Counter | 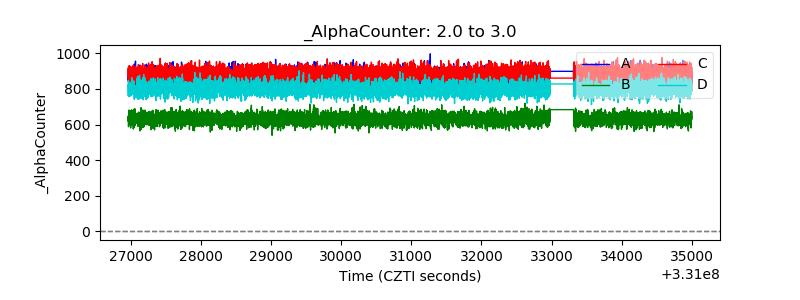 |
| _CPM_Rate | 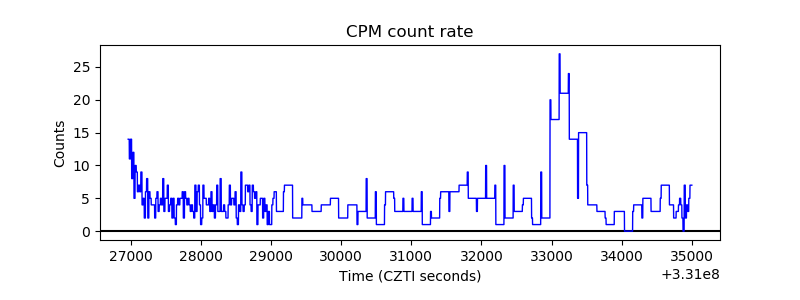 |
| CZT Counter | 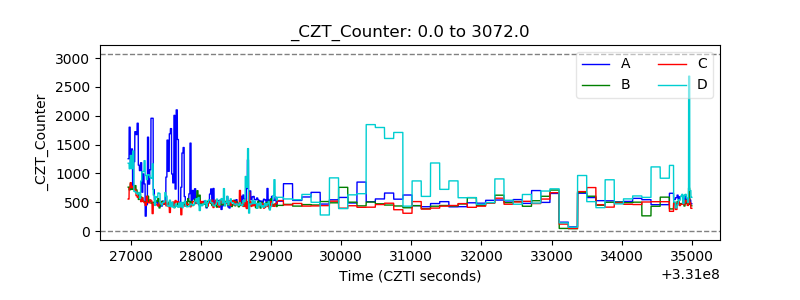 |
| +2.5 Volts monitor |  |
| +5 Volts monitor |  |
| _ROLL_ROT | 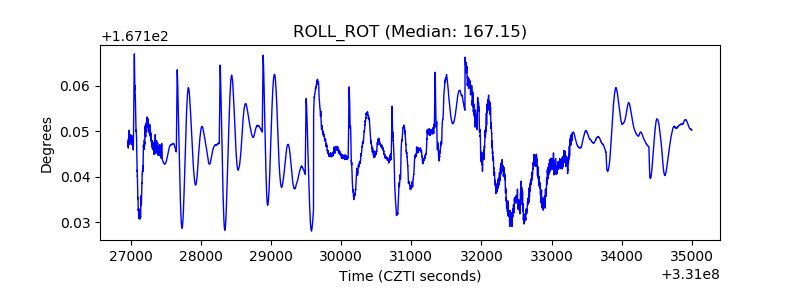 |
| _Roll_DEC | 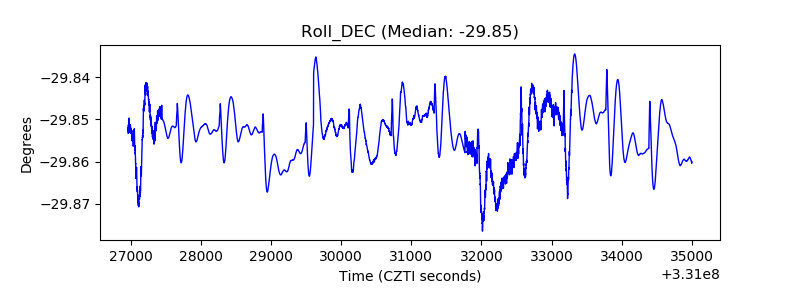 |
| _Roll_RA | 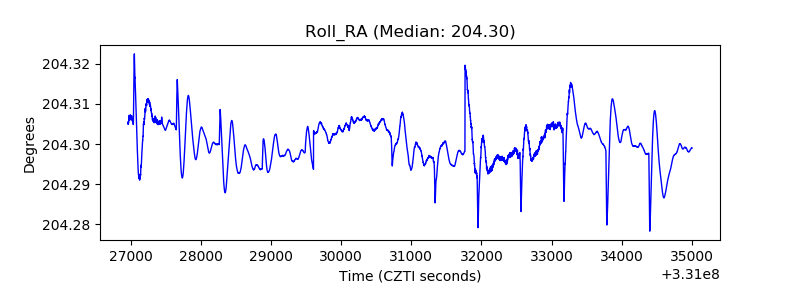 |
| Veto Counter | 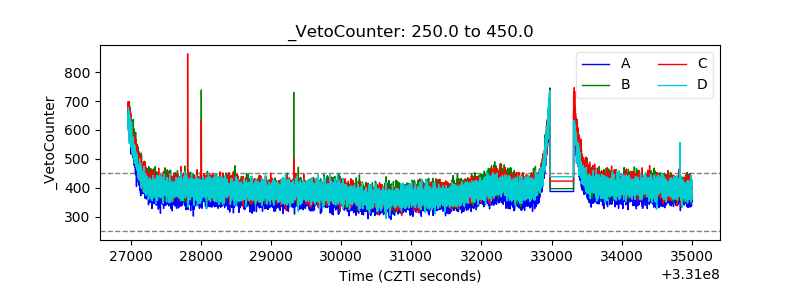 |