| Param | Original file | Final file |
|---|---|---|
| Filename | modeM0/AS1A09_043T01_9000003744_25686cztM0_level2.evt | modeM0/AS1A09_043T01_9000003744_25686cztM0_level2_quad_clean.evt |
| Size (bytes) | 941,529,600 | 171,518,400 |
| Size | 897.9 MB | 163.6 MB |
| Events in quadrant A | 6,221,457 | 1,119,731 |
| Events in quadrant B | 5,970,916 | 1,134,496 |
| Events in quadrant C | 5,742,117 | 1,070,659 |
| Events in quadrant D | 9,763,580 | 1,034,709 |
| Mode M9 | |||
|---|---|---|---|
| Quadrant | BADHDUFLAG | Total packets | Discarded packets |
| A | 0 | 12 | 0 |
| B | 0 | 12 | 0 |
| C | 0 | 12 | 0 |
| D | 0 | 12 | 0 |
| Mode M0 | |||
|---|---|---|---|
| Quadrant | BADHDUFLAG | Total packets | Discarded packets |
| A | 0 | 25582 | 0 |
| B | 0 | 25204 | 0 |
| C | 0 | 24743 | 0 |
| D | 0 | 37655 | 0 |
| Quadrant | Total seconds | Saturated seconds | Saturation percentage |
|---|---|---|---|
| A | 12078 | 141 | 1.167412% |
| B | 12078 | 129 | 1.068058% |
| C | 12079 | 175 | 1.448795% |
| D | 12079 | 398 | 3.294975% |
Noise dominated data is calculated using 1-second bins in cleaned event files. If a bin has >2000 counts, and if more than 50% of those come from <1% of pixels, then it is considered to be noise-dominated and hence unusable.
| Quadrant | # 1 sec bins | Bins with >0 counts | Bins with >2000 counts | High rate bins dominated by noise | Noise dominated (total time) | Noise dominated (detector-on time) | Marked lightcurve |
|---|---|---|---|---|---|---|---|
| A | 13308 | 12078 | 0 | 0 | 0.00% | 0.00% | 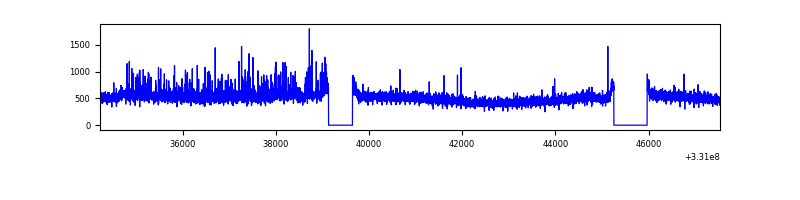 |
| B | 13308 | 12080 | 1 | 1 | 0.01% | 0.01% | 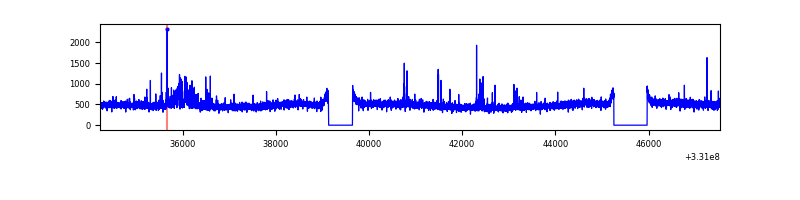 |
| C | 13309 | 12079 | 0 | 0 | 0.00% | 0.00% | 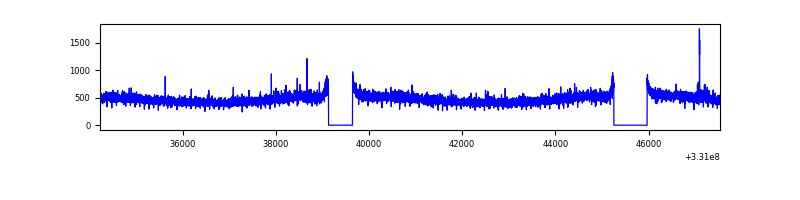 |
| D | 13309 | 12079 | 210 | 210 | 1.58% | 1.74% | 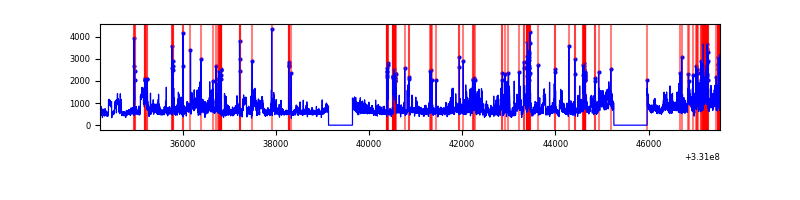 |
Top three noisy pixels from each quadrant. If the there are fewer than three noisy pixels in the level2.evt file, extra rows are filled as -1
| Pixel properties | Quadrant properties | ||||||
|---|---|---|---|---|---|---|---|
| Quadrant | DetID | PixID | Counts | Sigma | Mean | Median | Sigma |
| A | 8 | 192 | 492349 | 1642.59 | 1482 | 1451 | 298.9 |
| A | 13 | 254 | 18396 | 56.7 | 1482 | 1451 | 298.9 |
| A | 3 | 137 | 13809 | 41.35 | 1482 | 1451 | 298.9 |
| B | 15 | 33 | 129983 | 454.38 | 1468 | 1433 | 282.9 |
| B | 0 | 245 | 60475 | 208.69 | 1468 | 1433 | 282.9 |
| B | 12 | 111 | 34759 | 117.8 | 1468 | 1433 | 282.9 |
| C | 14 | 238 | 221801 | 666.96 | 1408 | 1413 | 330.4 |
| C | 3 | 233 | 33689 | 97.68 | 1408 | 1413 | 330.4 |
| C | 13 | 61 | 9899 | 25.68 | 1408 | 1413 | 330.4 |
| D | 1 | 52 | 3131061 | 9051.35 | 1421 | 1379 | 345.8 |
| D | 8 | 195 | 741652 | 2140.94 | 1421 | 1379 | 345.8 |
| D | 13 | 104 | 187547 | 538.41 | 1421 | 1379 | 345.8 |
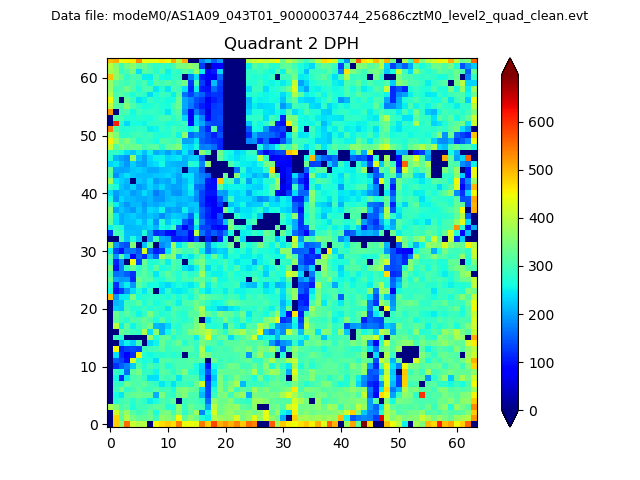
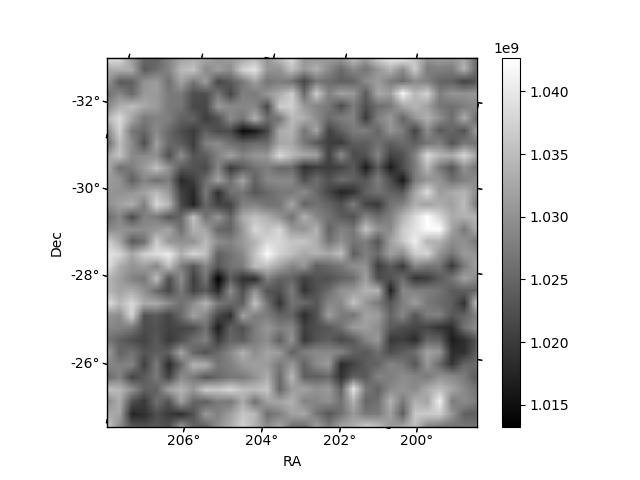
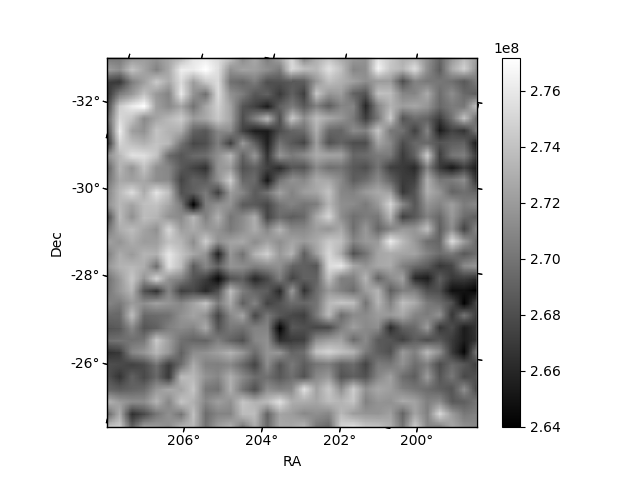
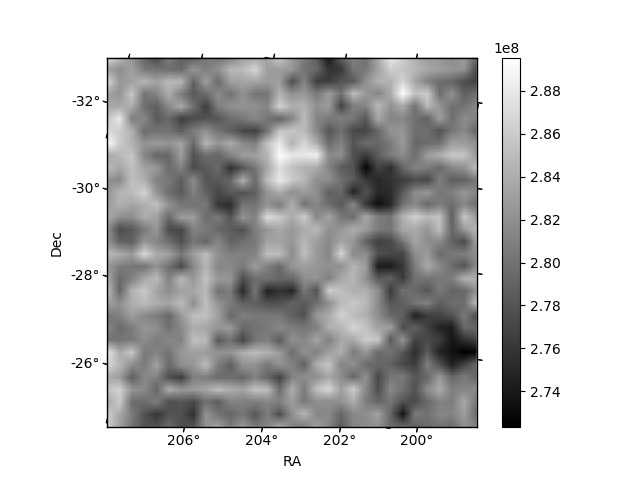
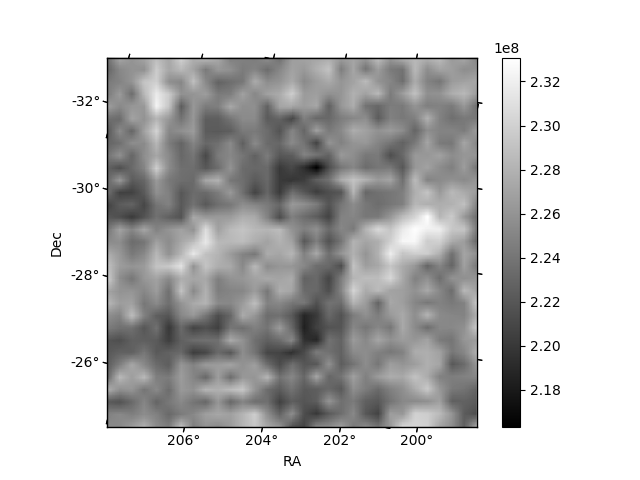
Histogram calculated using DETX and DETY for each event in the final _common_clean file
| Quadrant A | 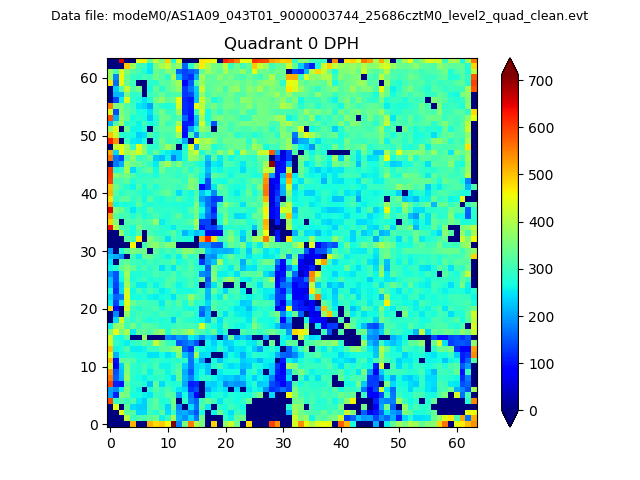 |
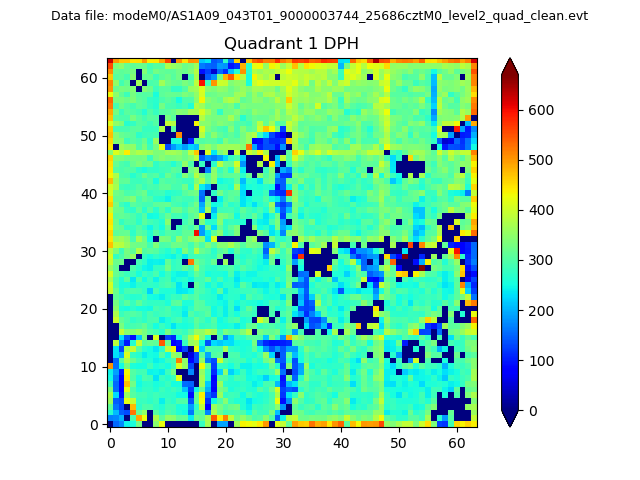 |
Quadrant B |
|---|---|---|---|
| Quadrant D | 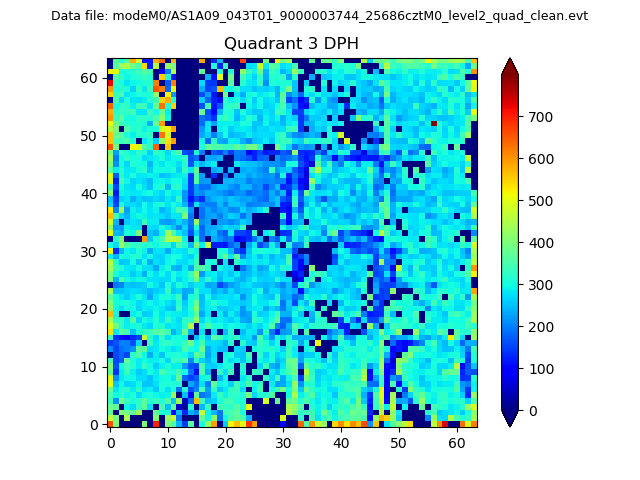 |
 |
Quadrant C |
| Plot type | Count rate plots | Images |
|---|---|---|
| Comparison with Poisson distribution Blue bars denote a histogram of data divided into 1 sec bins. Red curve is a Poisson curve with rate = median count rate of data. |
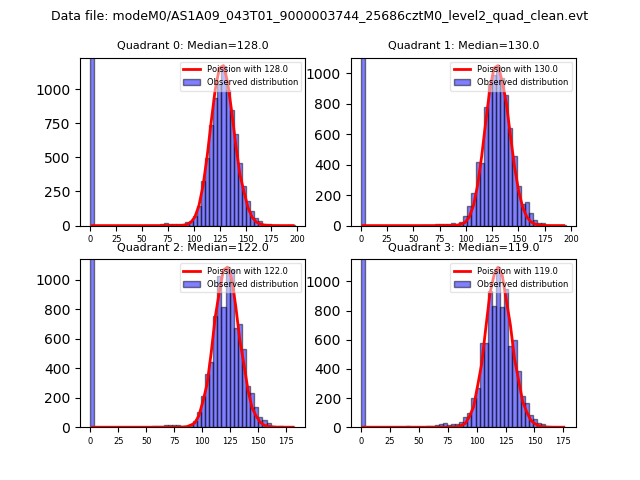 |
 |
| Quadrant-wise count rates Data is divided into 100 sec bins |
 |
|
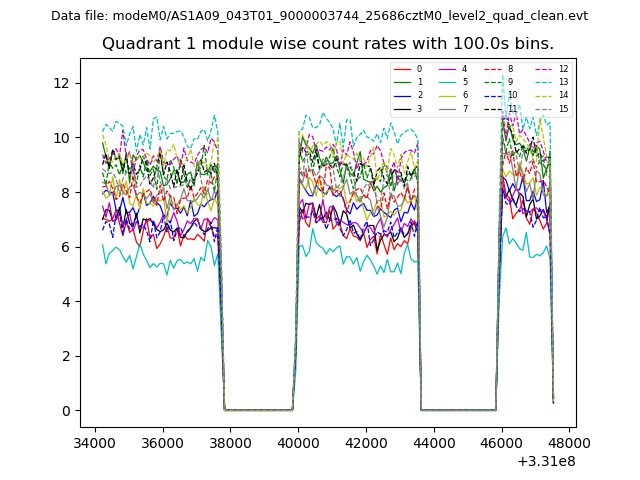
| Module-wise count rates for Quadrant A Data is divided into 100 sec bins |
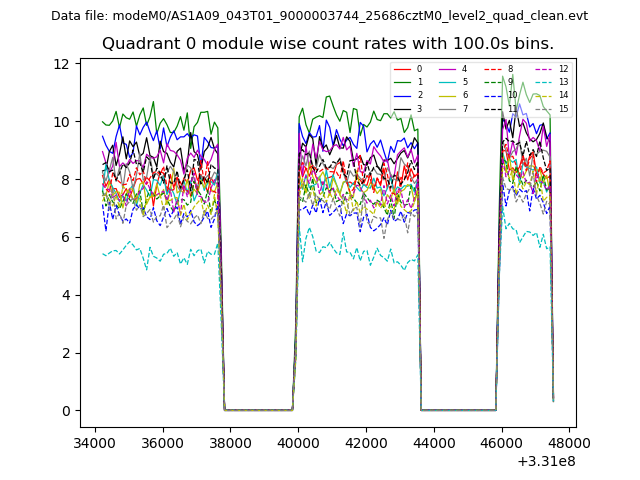 |
 |
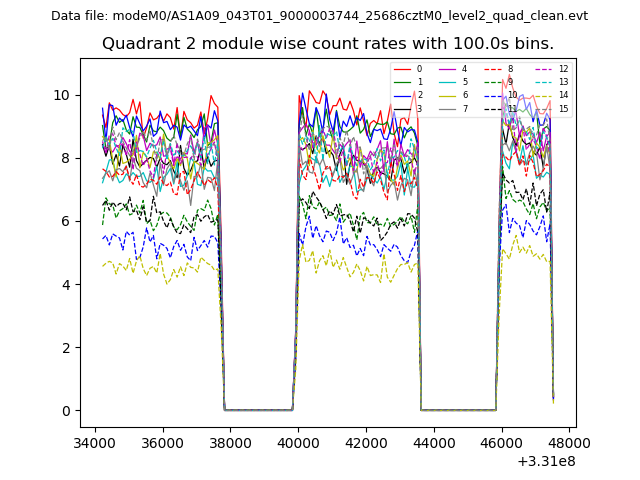
| Module-wise count rates for Quadrant B Data is divided into 100 sec bins |
 |
 |
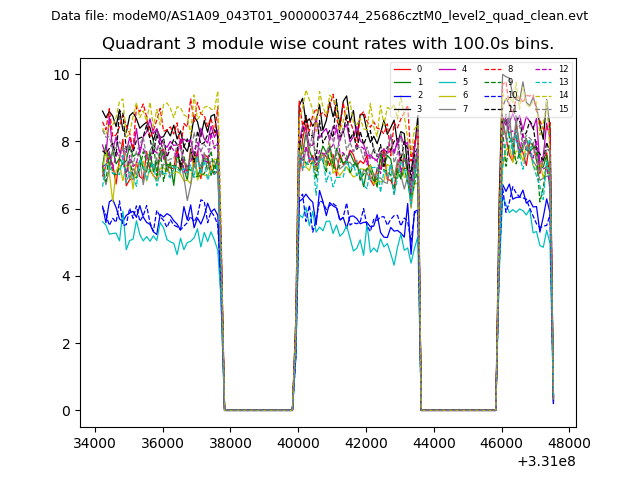
| Module-wise count rates for Quadrant C Data is divided into 100 sec bins |
 |
 |
| Module-wise count rates for Quadrant D Data is divided into 100 sec bins |
 |
 |
| Parameter | Plot |
|---|---|
| CZT HV Monitor |  |
| D_VDD | 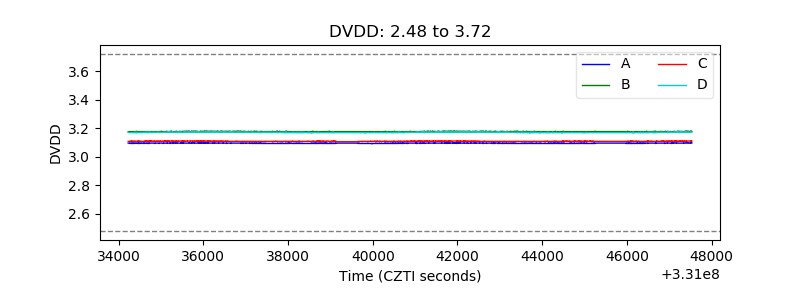 |
| Temperature 1 | 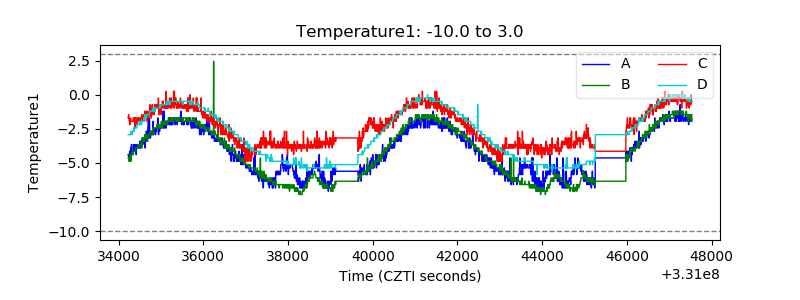 |
| Veto HV Monitor | 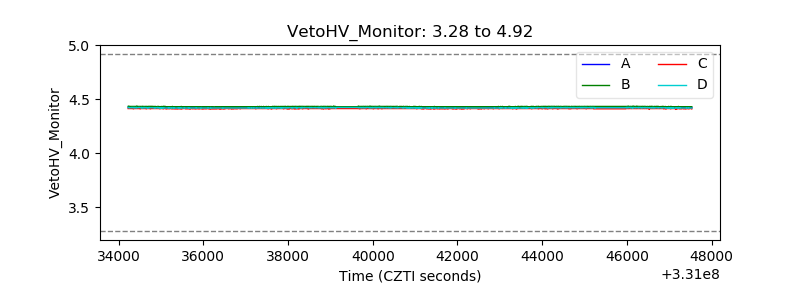 |
| Veto LLD | 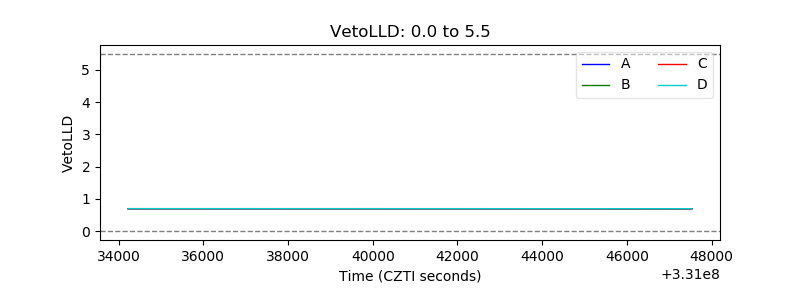 |
| Alpha Counter | 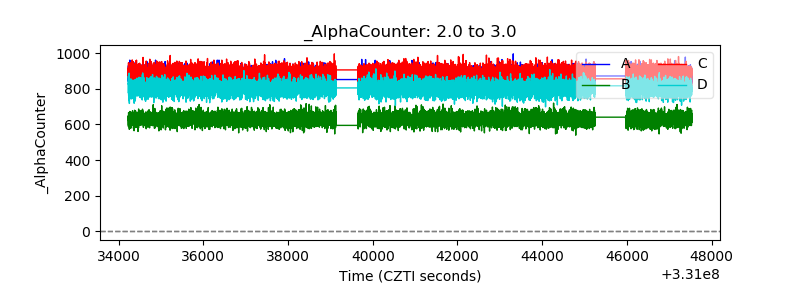 |
| _CPM_Rate | 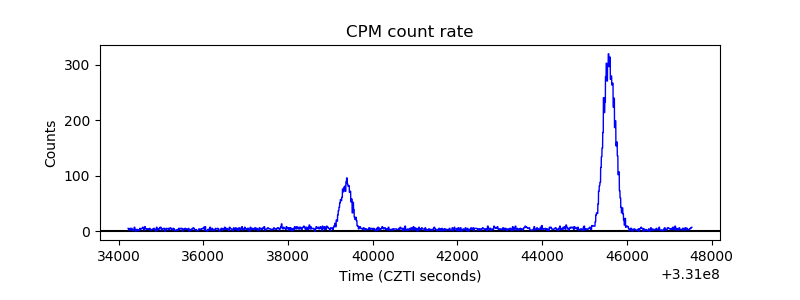 |
| CZT Counter | 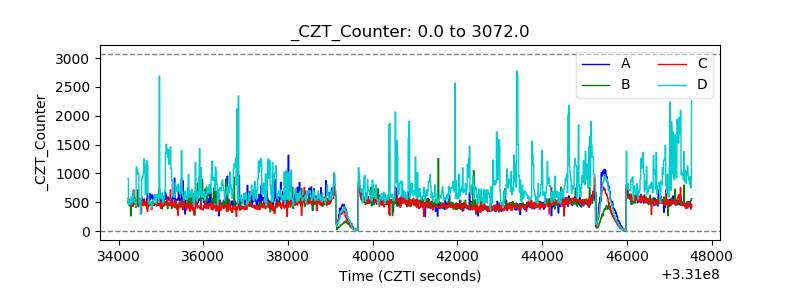 |
| +2.5 Volts monitor | 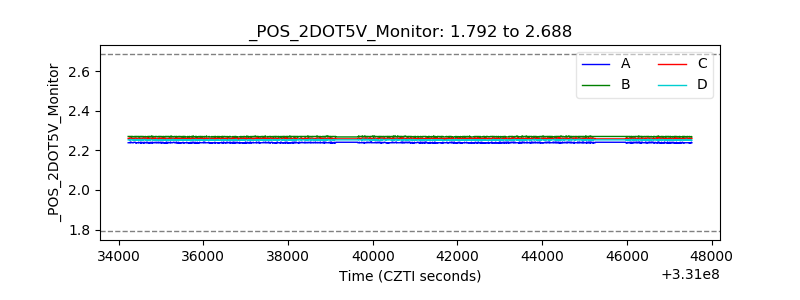 |
| +5 Volts monitor |  |
| _ROLL_ROT |  |
| _Roll_DEC | 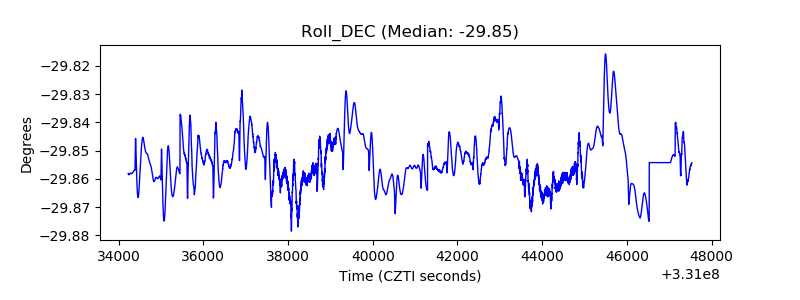 |
| _Roll_RA | 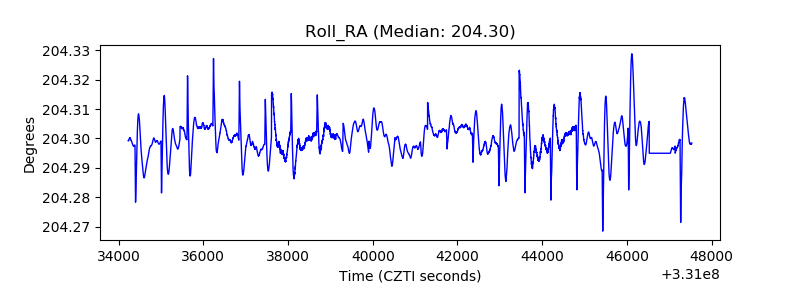 |
| Veto Counter | 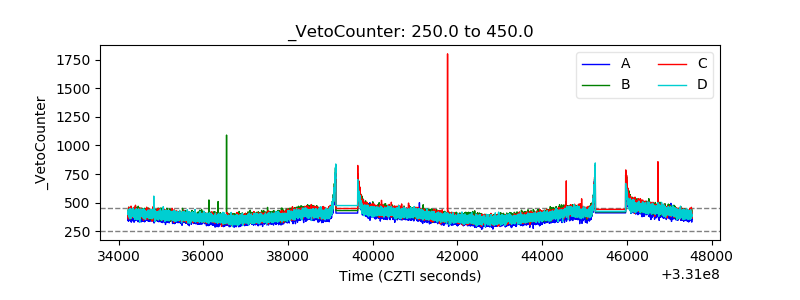 |