| Param | Original file | Final file |
|---|---|---|
| Filename | modeM0/AS1A09_043T01_9000003744_25687cztM0_level2.evt | modeM0/AS1A09_043T01_9000003744_25687cztM0_level2_quad_clean.evt |
| Size (bytes) | 526,777,920 | 96,048,000 |
| Size | 502.4 MB | 91.6 MB |
| Events in quadrant A | 3,211,750 | 633,779 |
| Events in quadrant B | 3,285,230 | 633,988 |
| Events in quadrant C | 3,200,220 | 599,810 |
| Events in quadrant D | 5,805,704 | 577,731 |
| Mode M9 | |||
|---|---|---|---|
| Quadrant | BADHDUFLAG | Total packets | Discarded packets |
| A | 0 | 9 | 0 |
| B | 0 | 9 | 0 |
| C | 0 | 9 | 0 |
| D | 0 | 9 | 0 |
| Mode M0 | |||
|---|---|---|---|
| Quadrant | BADHDUFLAG | Total packets | Discarded packets |
| A | 0 | 13765 | 0 |
| B | 0 | 13866 | 0 |
| C | 0 | 13753 | 0 |
| D | 0 | 22032 | 0 |
| Quadrant | Total seconds | Saturated seconds | Saturation percentage |
|---|---|---|---|
| A | 6649 | 46 | 0.691833% |
| B | 6650 | 47 | 0.706767% |
| C | 6650 | 71 | 1.067669% |
| D | 6649 | 275 | 4.135960% |
Noise dominated data is calculated using 1-second bins in cleaned event files. If a bin has >2000 counts, and if more than 50% of those come from <1% of pixels, then it is considered to be noise-dominated and hence unusable.
| Quadrant | # 1 sec bins | Bins with >0 counts | Bins with >2000 counts | High rate bins dominated by noise | Noise dominated (total time) | Noise dominated (detector-on time) | Marked lightcurve |
|---|---|---|---|---|---|---|---|
| A | 7554 | 6649 | 1 | 1 | 0.01% | 0.02% | 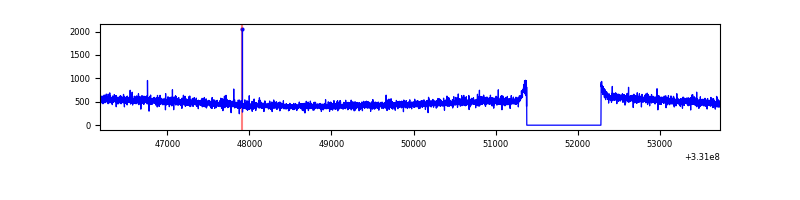 |
| B | 7555 | 6650 | 1 | 1 | 0.01% | 0.02% | 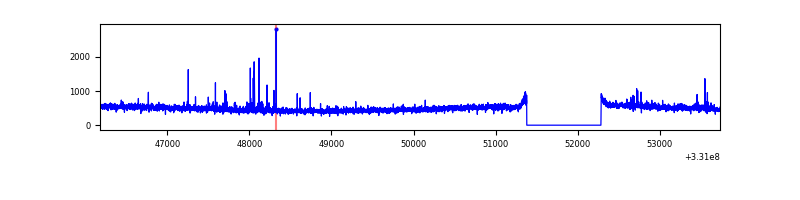 |
| C | 7555 | 6650 | 0 | 0 | 0.00% | 0.00% | 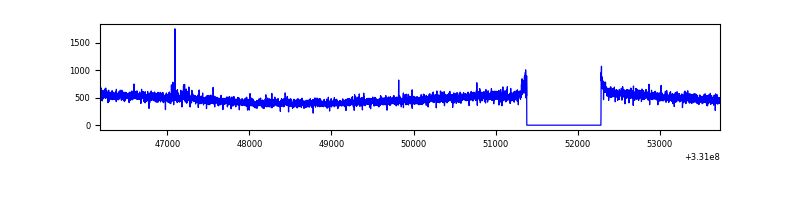 |
| D | 7554 | 6649 | 213 | 213 | 2.82% | 3.20% | 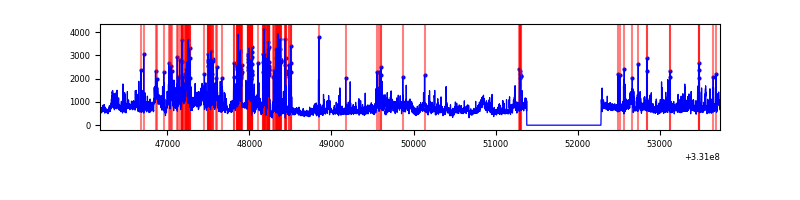 |
Top three noisy pixels from each quadrant. If the there are fewer than three noisy pixels in the level2.evt file, extra rows are filled as -1
| Pixel properties | Quadrant properties | ||||||
|---|---|---|---|---|---|---|---|
| Quadrant | DetID | PixID | Counts | Sigma | Mean | Median | Sigma |
| A | 0 | 13 | 10375 | 56.99 | 830 | 813 | 167.8 |
| A | 13 | 254 | 9293 | 50.54 | 830 | 813 | 167.8 |
| A | 3 | 137 | 7714 | 41.13 | 830 | 813 | 167.8 |
| B | 0 | 245 | 61724 | 384.51 | 818 | 799 | 158.4 |
| B | 12 | 111 | 19350 | 117.08 | 818 | 799 | 158.4 |
| B | 11 | 111 | 17363 | 104.54 | 818 | 799 | 158.4 |
| C | 14 | 238 | 124585 | 675.55 | 783 | 786 | 183.3 |
| C | 3 | 233 | 26041 | 137.81 | 783 | 786 | 183.3 |
| C | 13 | 61 | 5508 | 25.77 | 783 | 786 | 183.3 |
| D | 1 | 52 | 1933230 | 10061.14 | 792 | 770 | 192.1 |
| D | 8 | 195 | 350119 | 1818.85 | 792 | 770 | 192.1 |
| D | 2 | 244 | 324798 | 1687.02 | 792 | 770 | 192.1 |
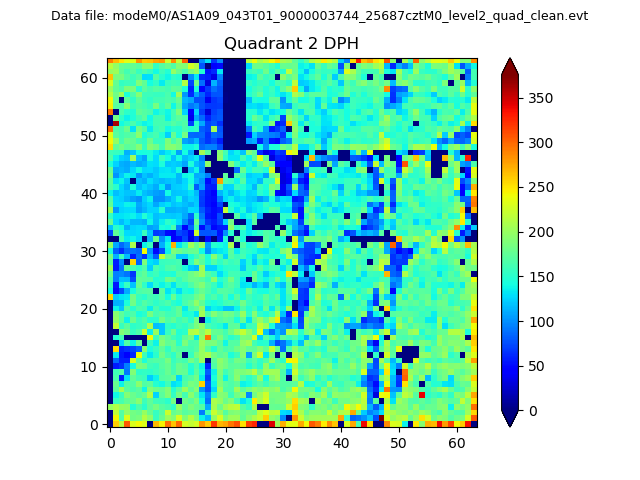
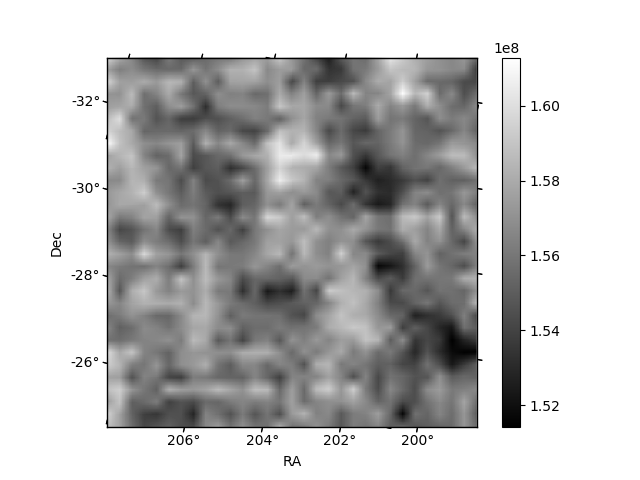
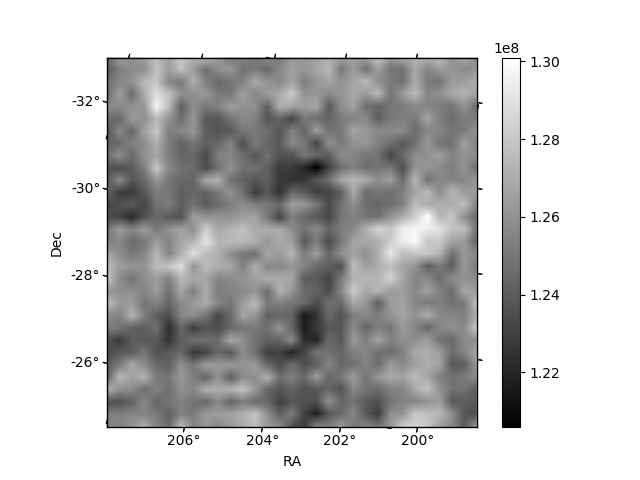
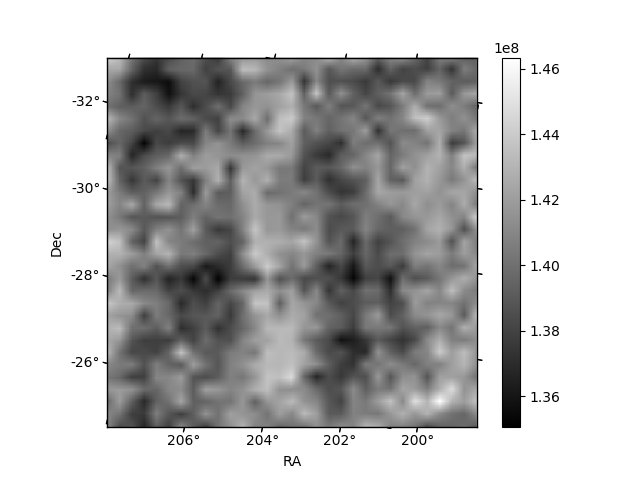
Histogram calculated using DETX and DETY for each event in the final _common_clean file
| Quadrant A | 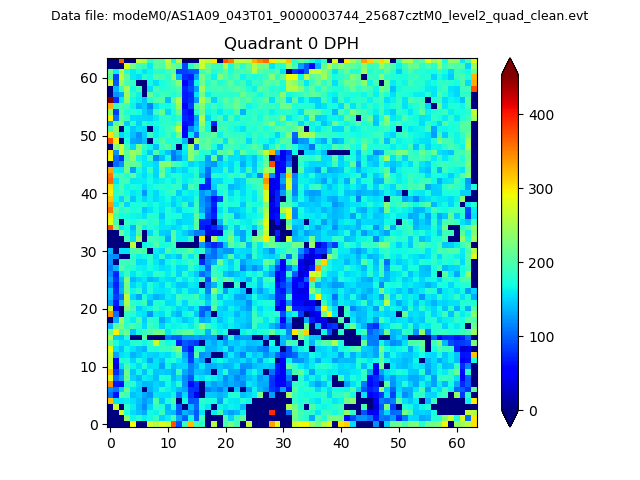 |
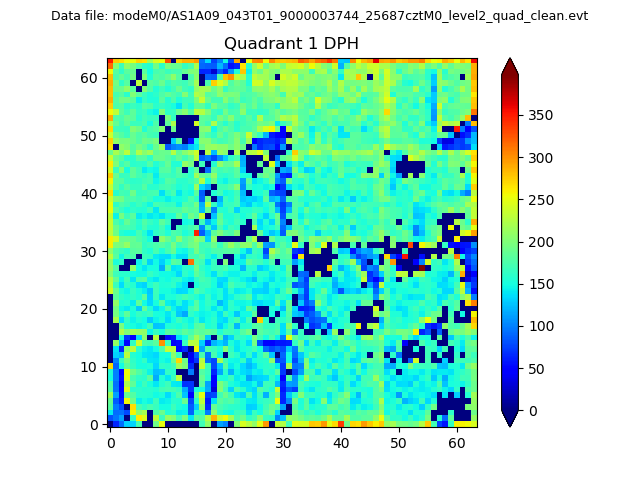 |
Quadrant B |
|---|---|---|---|
| Quadrant D | 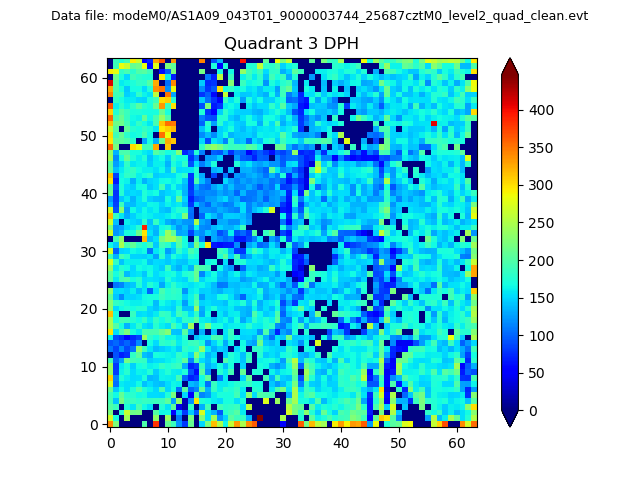 |
 |
Quadrant C |
| Plot type | Count rate plots | Images |
|---|---|---|
| Comparison with Poisson distribution Blue bars denote a histogram of data divided into 1 sec bins. Red curve is a Poisson curve with rate = median count rate of data. |
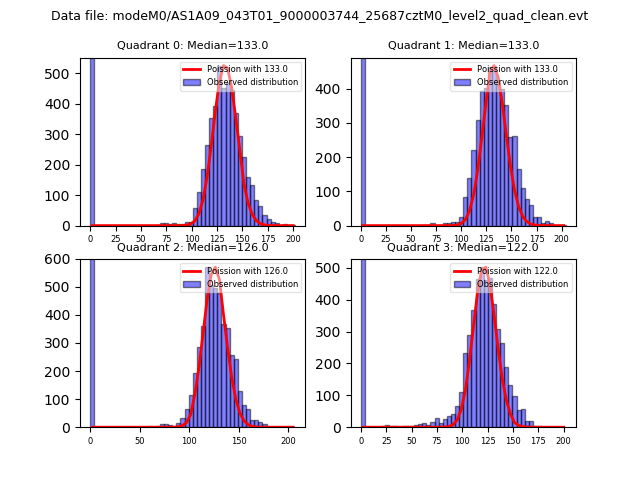 |
 |
| Quadrant-wise count rates Data is divided into 100 sec bins |
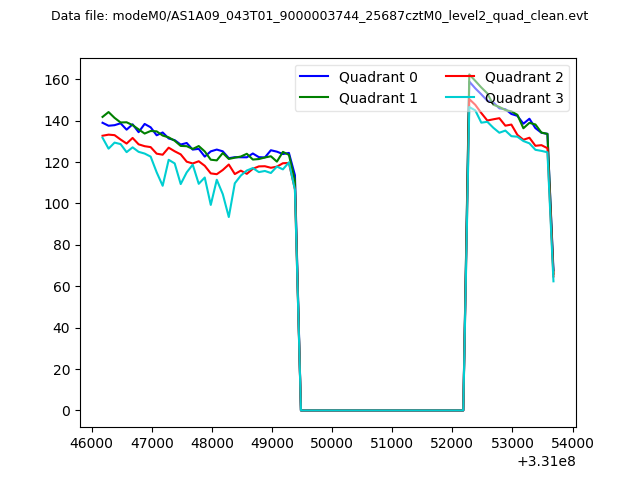 |
|
| Module-wise count rates for Quadrant A Data is divided into 100 sec bins |
 |
 |
| Module-wise count rates for Quadrant B Data is divided into 100 sec bins |
 |
 |
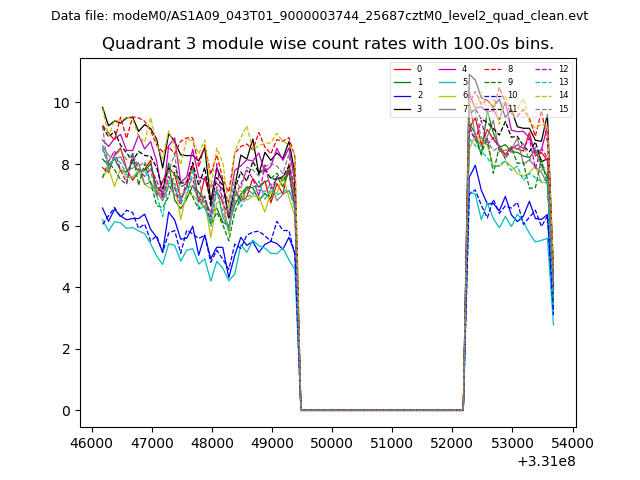
| Module-wise count rates for Quadrant C Data is divided into 100 sec bins |
 |
 |
| Module-wise count rates for Quadrant D Data is divided into 100 sec bins |
 |
 |
| Parameter | Plot |
|---|---|
| CZT HV Monitor | 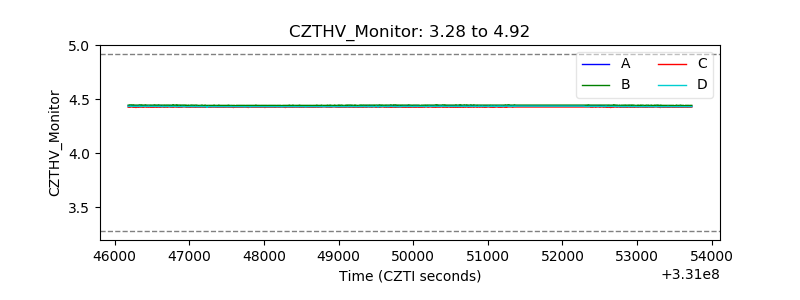 |
| D_VDD | 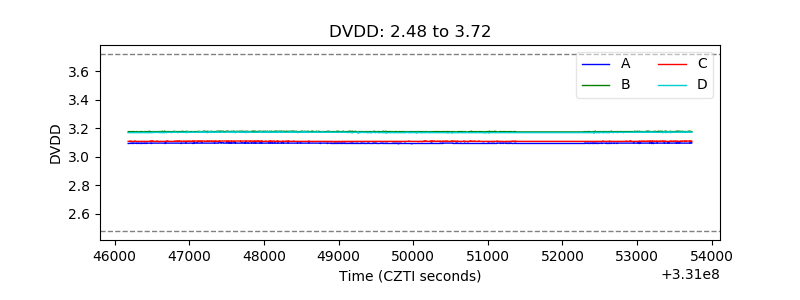 |
| Temperature 1 | 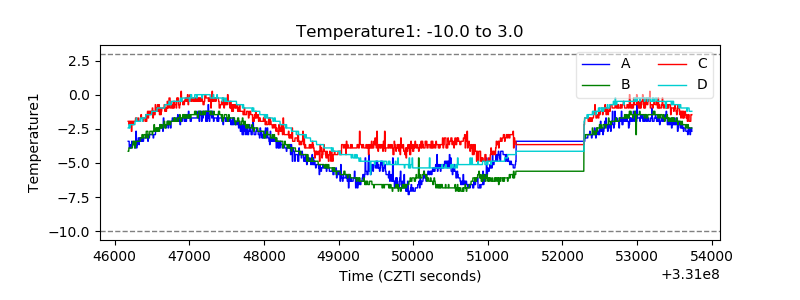 |
| Veto HV Monitor | 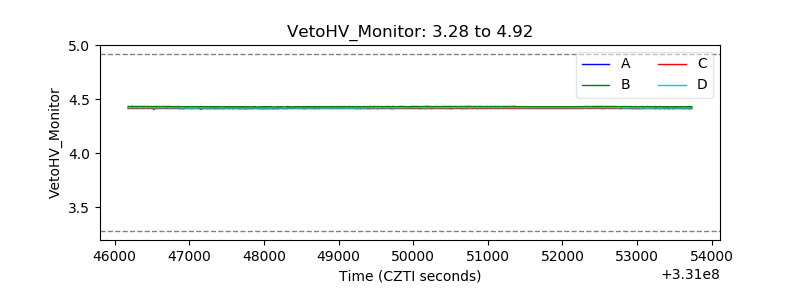 |
| Veto LLD | 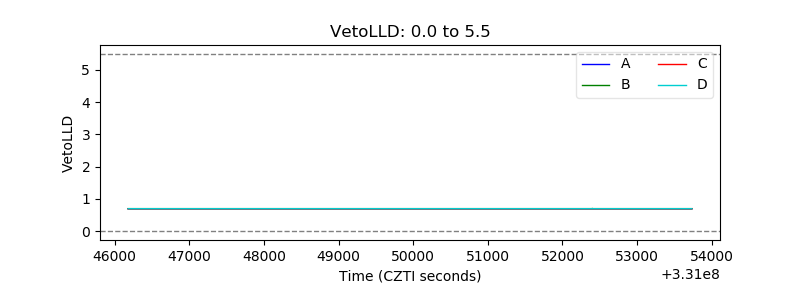 |
| Alpha Counter | 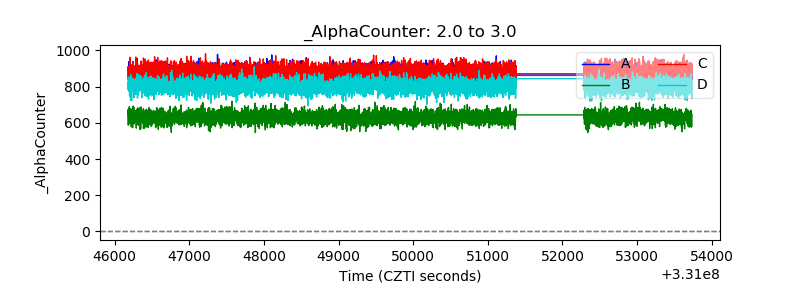 |
| _CPM_Rate | 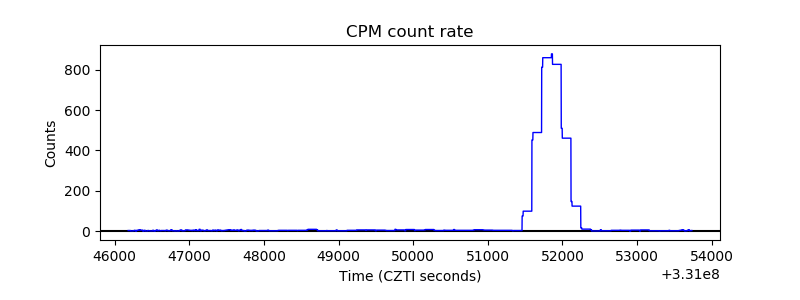 |
| CZT Counter | 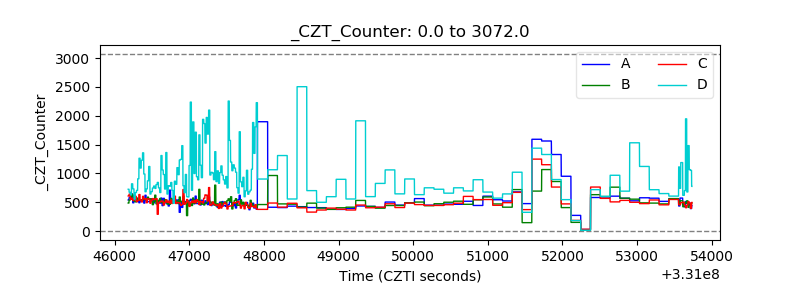 |
| +2.5 Volts monitor |  |
| +5 Volts monitor |  |
| _ROLL_ROT | 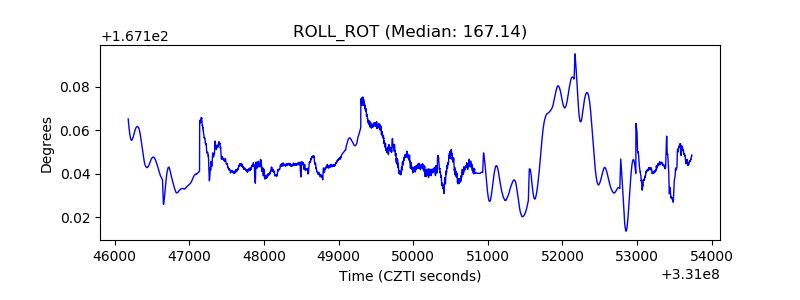 |
| _Roll_DEC | 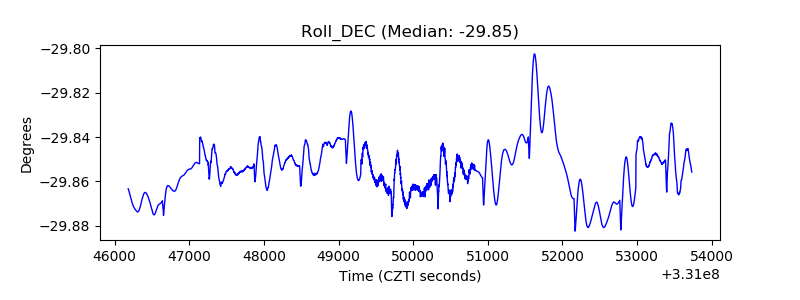 |
| _Roll_RA | 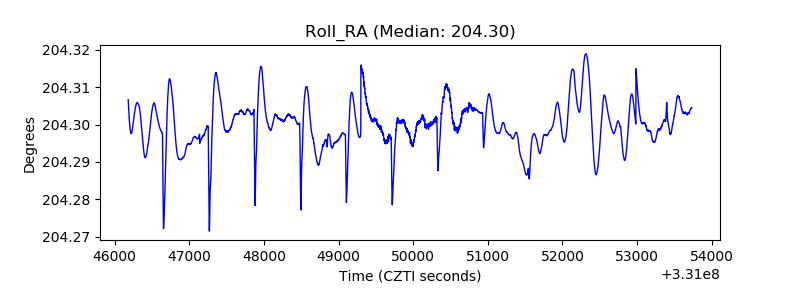 |
| Veto Counter | 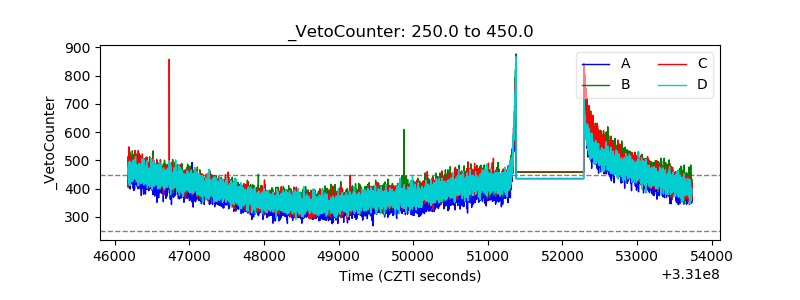 |