| Param | Original file | Final file |
|---|---|---|
| Filename | modeM0/AS1A09_043T01_9000003744_25688cztM0_level2.evt | modeM0/AS1A09_043T01_9000003744_25688cztM0_level2_quad_clean.evt |
| Size (bytes) | 188,516,160 | 48,309,120 |
| Size | 179.8 MB | 46.1 MB |
| Events in quadrant A | 1,239,269 | 332,686 |
| Events in quadrant B | 1,205,223 | 334,281 |
| Events in quadrant C | 1,168,001 | 314,703 |
| Events in quadrant D | 1,929,944 | 306,552 |
| Mode M9 | |||
|---|---|---|---|
| Quadrant | BADHDUFLAG | Total packets | Discarded packets |
| A | 0 | 1 | 0 |
| B | 0 | 2 | 0 |
| C | 0 | 2 | 0 |
| D | 0 | 2 | 0 |
| Mode M0 | |||
|---|---|---|---|
| Quadrant | BADHDUFLAG | Total packets | Discarded packets |
| A | 0 | 5244 | 0 |
| B | 0 | 5151 | 0 |
| C | 0 | 5085 | 0 |
| D | 0 | 7492 | 0 |
| Quadrant | Total seconds | Saturated seconds | Saturation percentage |
|---|---|---|---|
| A | 2427 | 11 | 0.453234% |
| B | 2427 | 7 | 0.288422% |
| C | 2427 | 18 | 0.741656% |
| D | 2427 | 30 | 1.236094% |
Noise dominated data is calculated using 1-second bins in cleaned event files. If a bin has >2000 counts, and if more than 50% of those come from <1% of pixels, then it is considered to be noise-dominated and hence unusable.
| Quadrant | # 1 sec bins | Bins with >0 counts | Bins with >2000 counts | High rate bins dominated by noise | Noise dominated (total time) | Noise dominated (detector-on time) | Marked lightcurve |
|---|---|---|---|---|---|---|---|
| A | 2427 | 2427 | 4 | 4 | 0.16% | 0.16% | 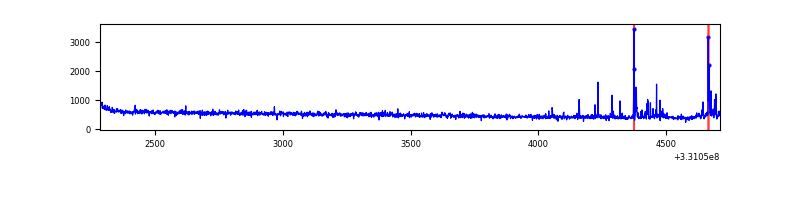 |
| B | 2427 | 2427 | 0 | 0 | 0.00% | 0.00% | 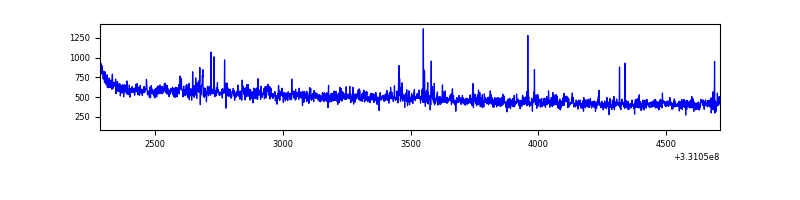 |
| C | 2427 | 2427 | 0 | 0 | 0.00% | 0.00% | 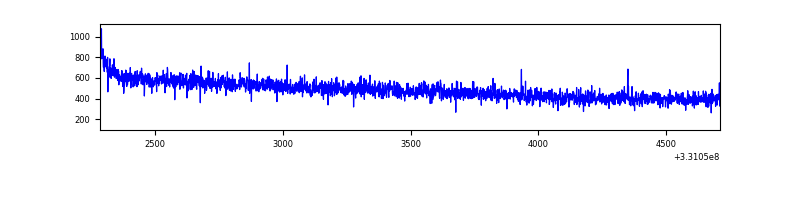 |
| D | 2427 | 2427 | 23 | 23 | 0.95% | 0.95% | 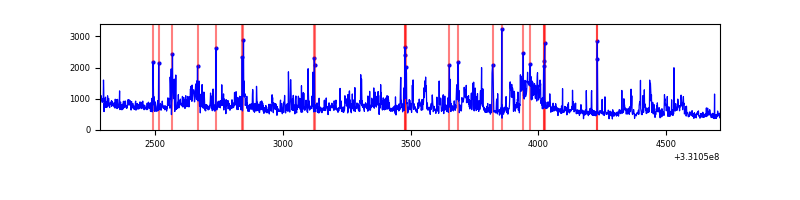 |
Top three noisy pixels from each quadrant. If the there are fewer than three noisy pixels in the level2.evt file, extra rows are filled as -1
| Pixel properties | Quadrant properties | ||||||
|---|---|---|---|---|---|---|---|
| Quadrant | DetID | PixID | Counts | Sigma | Mean | Median | Sigma |
| A | 0 | 13 | 54165 | 854.29 | 307 | 301 | 63.1 |
| A | 13 | 254 | 3786 | 55.27 | 307 | 301 | 63.1 |
| A | 3 | 137 | 2738 | 38.65 | 307 | 301 | 63.1 |
| B | 0 | 245 | 18111 | 300.16 | 300 | 293 | 59.4 |
| B | 0 | 190 | 9188 | 149.84 | 300 | 293 | 59.4 |
| B | 12 | 111 | 6864 | 110.69 | 300 | 293 | 59.4 |
| C | 14 | 238 | 46399 | 685.19 | 285 | 286 | 67.3 |
| C | 3 | 233 | 10441 | 150.89 | 285 | 286 | 67.3 |
| C | 13 | 61 | 1909 | 24.12 | 285 | 286 | 67.3 |
| D | 1 | 52 | 606994 | 8237.82 | 293 | 284 | 73.6 |
| D | 8 | 195 | 131688 | 1784.18 | 293 | 284 | 73.6 |
| D | 2 | 244 | 31408 | 422.59 | 293 | 284 | 73.6 |
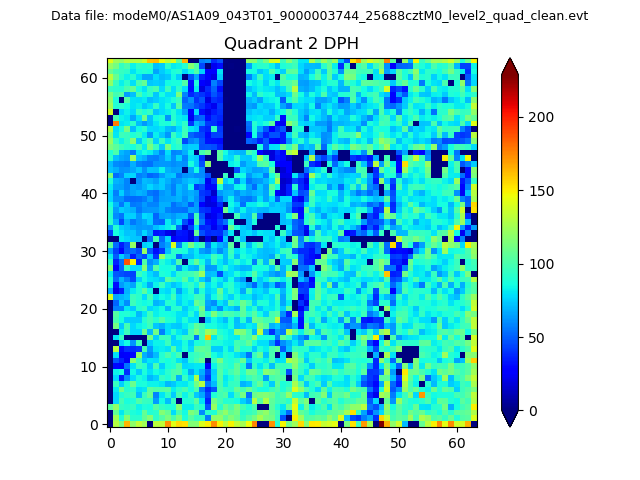
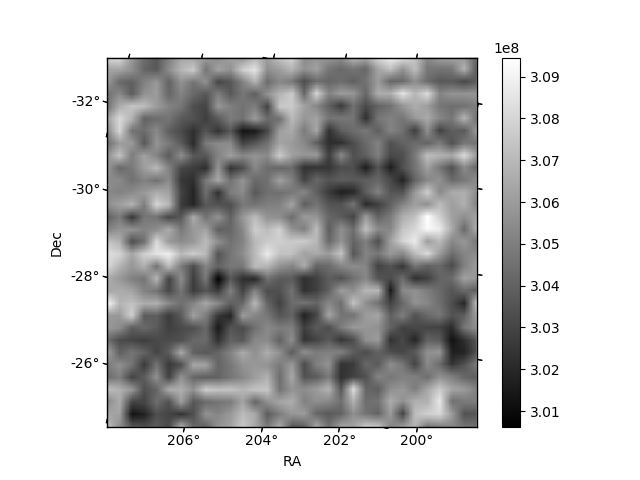
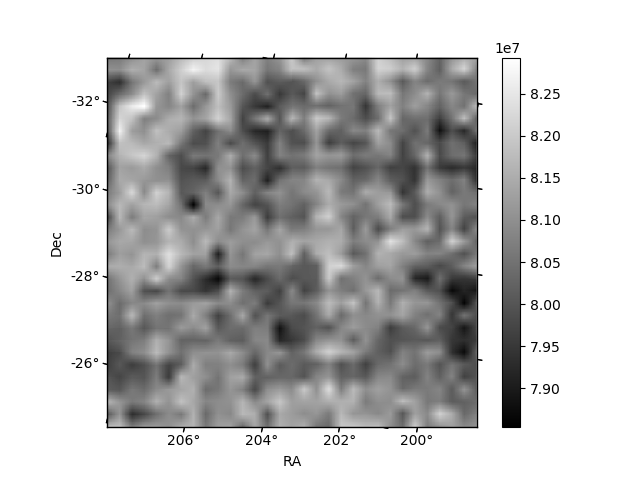
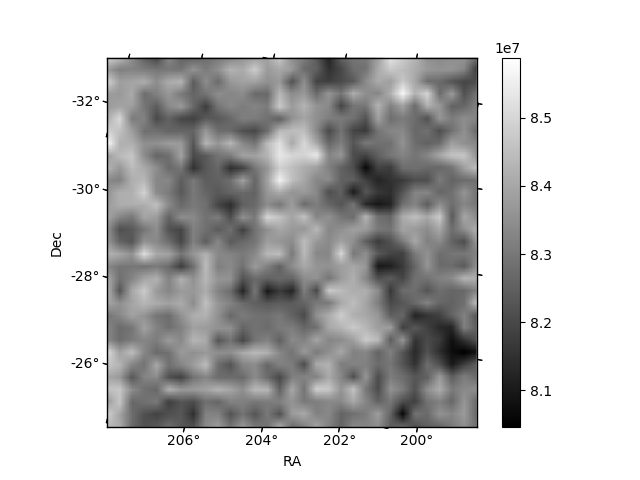
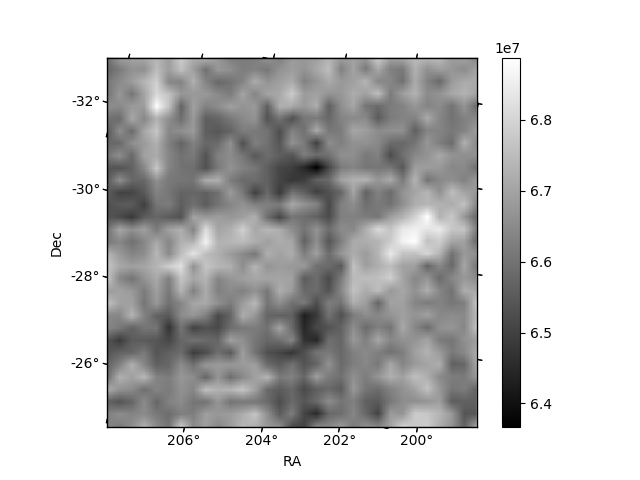
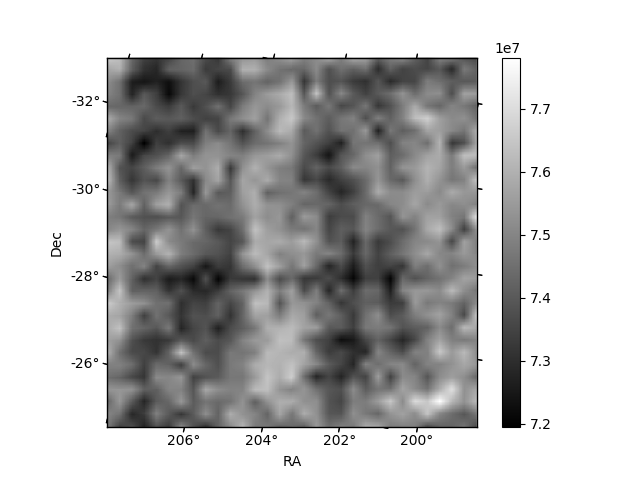
Histogram calculated using DETX and DETY for each event in the final _common_clean file
| Quadrant A | 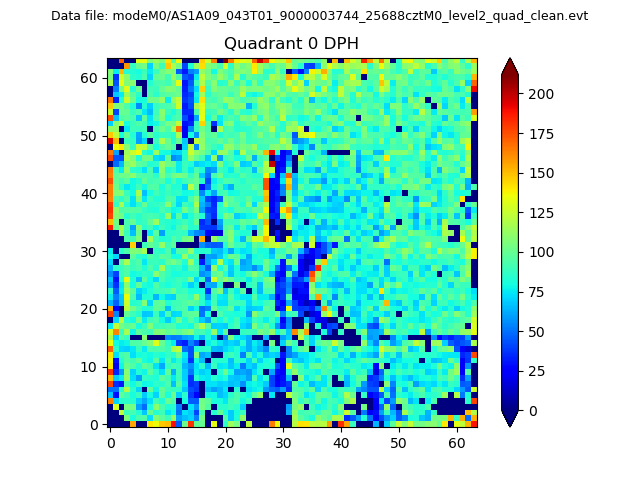 |
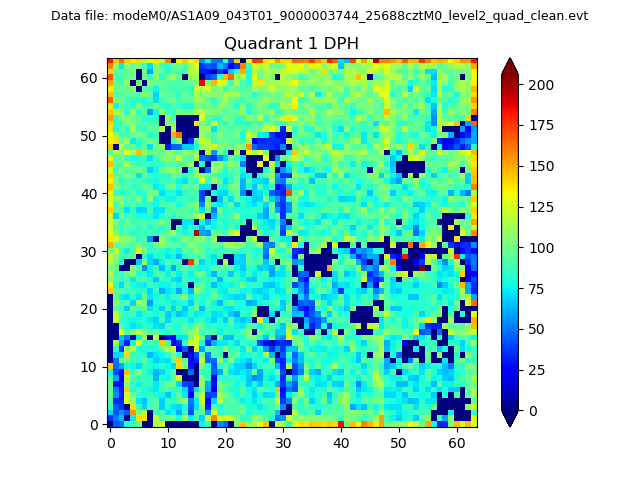 |
Quadrant B |
|---|---|---|---|
| Quadrant D | 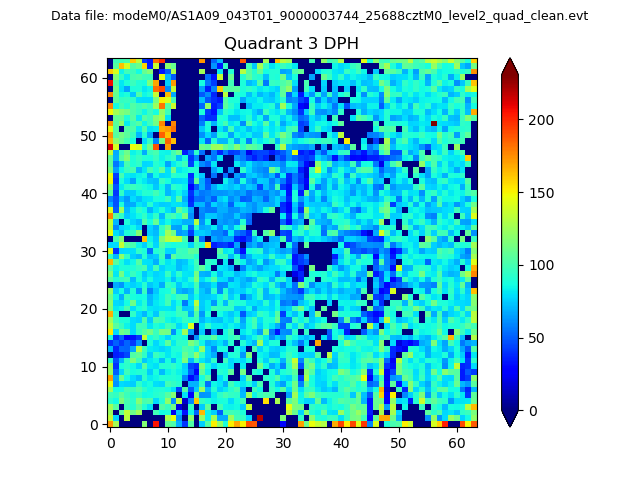 |
 |
Quadrant C |
| Plot type | Count rate plots | Images |
|---|---|---|
| Comparison with Poisson distribution Blue bars denote a histogram of data divided into 1 sec bins. Red curve is a Poisson curve with rate = median count rate of data. |
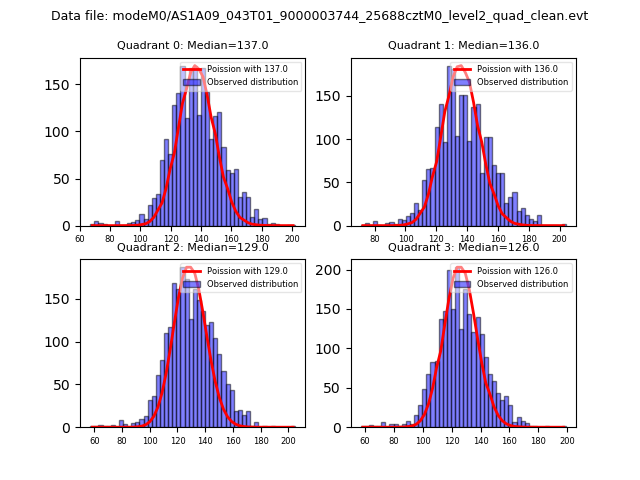 |
 |
| Quadrant-wise count rates Data is divided into 100 sec bins |
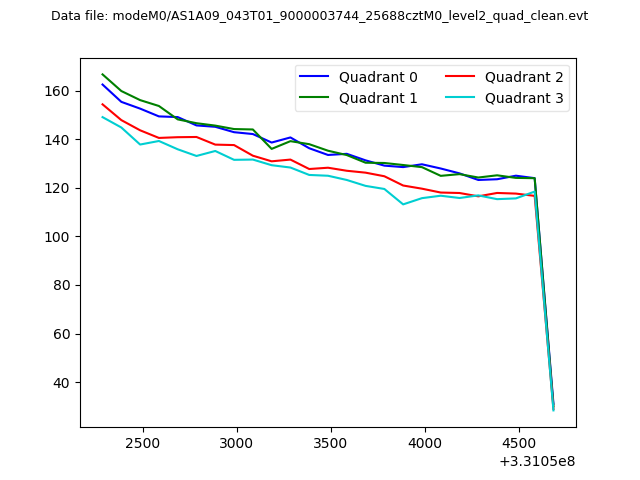 |
|
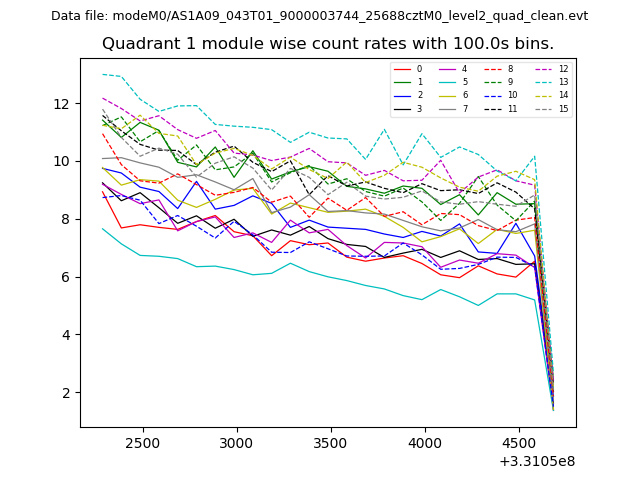
| Module-wise count rates for Quadrant A Data is divided into 100 sec bins |
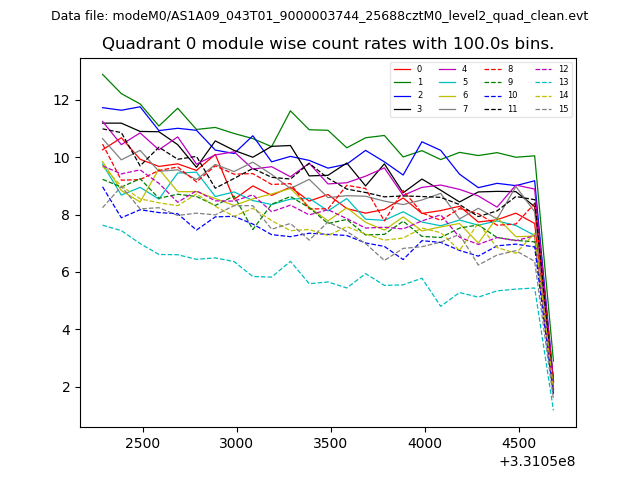 |
 |
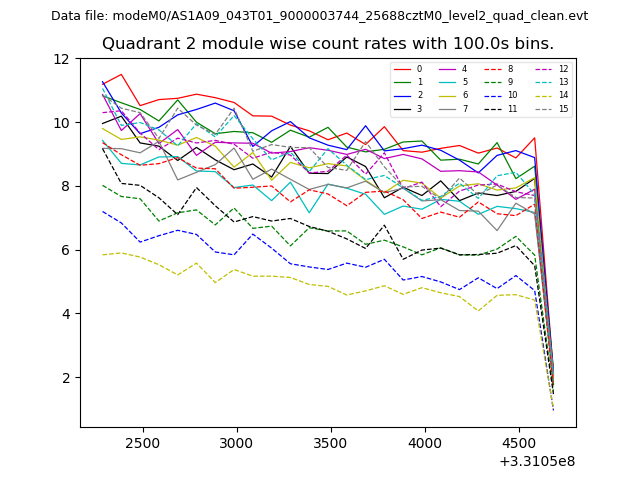
| Module-wise count rates for Quadrant B Data is divided into 100 sec bins |
 |
 |
| Module-wise count rates for Quadrant C Data is divided into 100 sec bins |
 |
 |
| Module-wise count rates for Quadrant D Data is divided into 100 sec bins |
 |
 |
| Parameter | Plot |
|---|---|
| CZT HV Monitor | 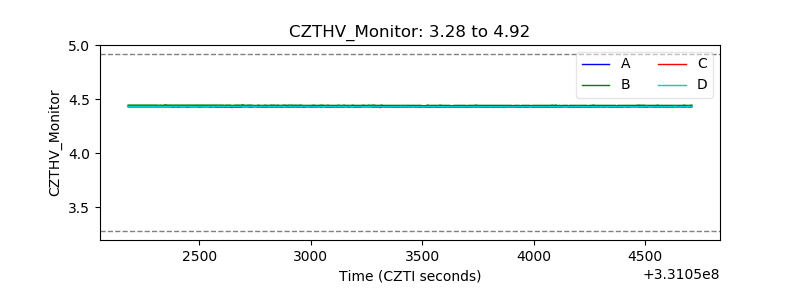 |
| D_VDD | 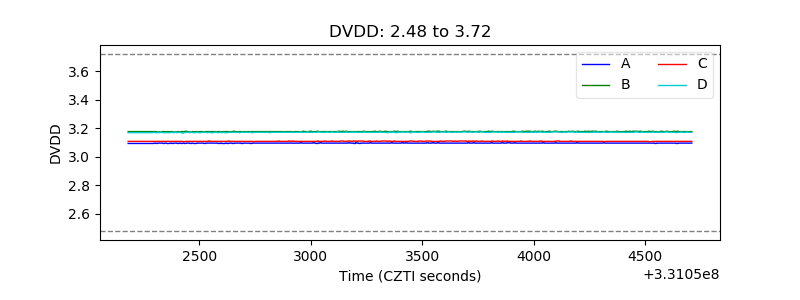 |
| Temperature 1 | 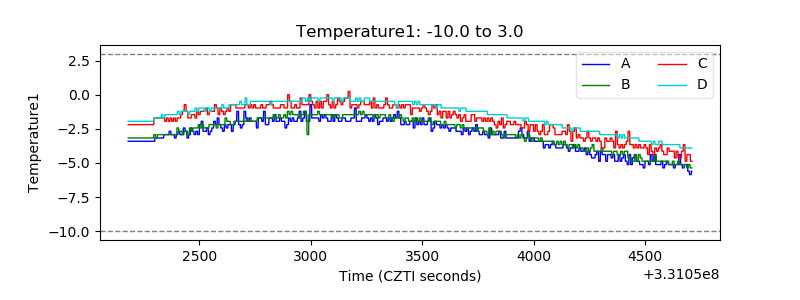 |
| Veto HV Monitor | 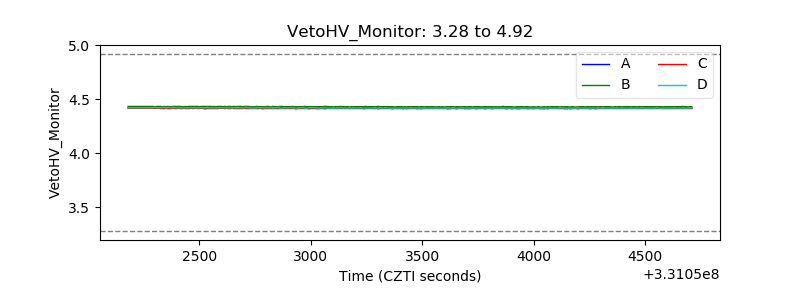 |
| Veto LLD | 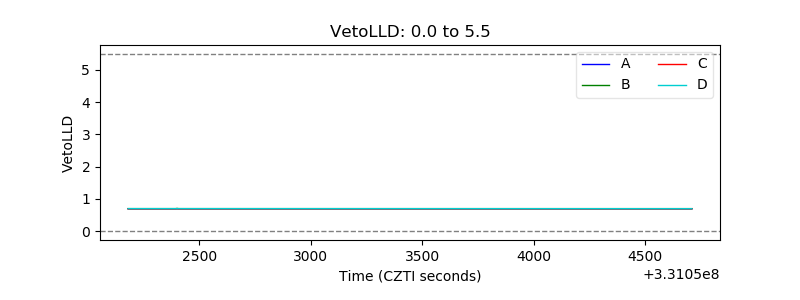 |
| Alpha Counter | 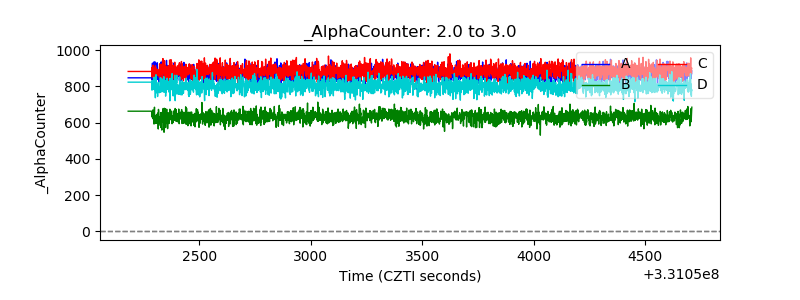 |
| _CPM_Rate |  |
| CZT Counter | 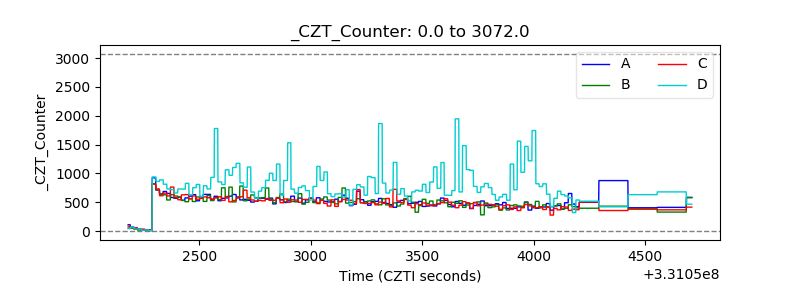 |
| +2.5 Volts monitor |  |
| +5 Volts monitor |  |
| _ROLL_ROT | 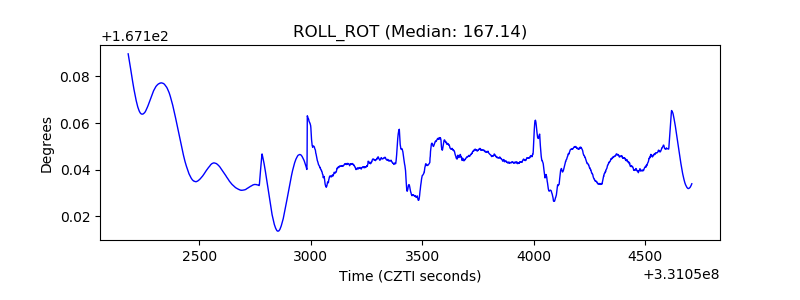 |
| _Roll_DEC | 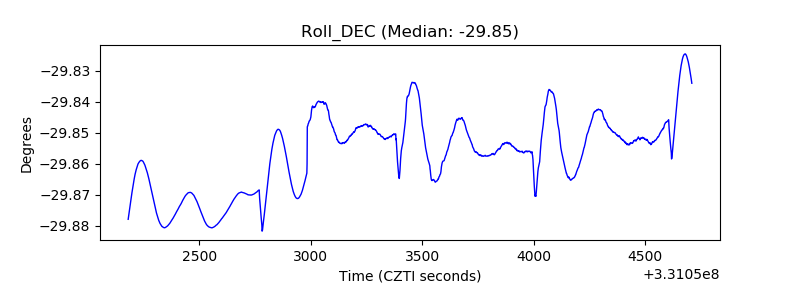 |
| _Roll_RA | 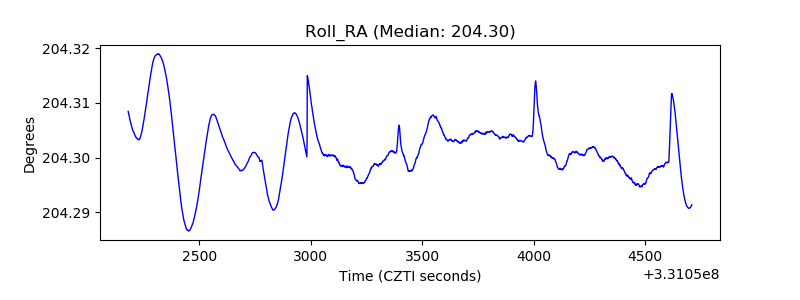 |
| Veto Counter | 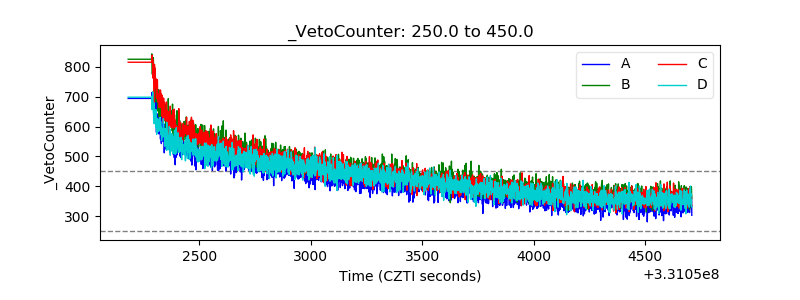 |