| Param | Original file | Final file |
|---|---|---|
| Filename | modeM0/AS1A09_008T03_9000003746_25688cztM0_level2.evt | modeM0/AS1A09_008T03_9000003746_25688cztM0_level2_quad_clean.evt |
| Size (bytes) | 302,097,600 | 40,541,760 |
| Size | 288.1 MB | 38.7 MB |
| Events in quadrant A | 2,752,004 | 249,831 |
| Events in quadrant B | 1,906,182 | 252,116 |
| Events in quadrant C | 1,874,561 | 233,610 |
| Events in quadrant D | 2,364,010 | 230,252 |
| Mode M9 | |||
|---|---|---|---|
| Quadrant | BADHDUFLAG | Total packets | Discarded packets |
| A | 0 | 10 | 0 |
| B | 0 | 10 | 0 |
| C | 0 | 10 | 0 |
| D | 0 | 10 | 0 |
| Mode M0 | |||
|---|---|---|---|
| Quadrant | BADHDUFLAG | Total packets | Discarded packets |
| A | 0 | 10523 | 0 |
| B | 0 | 7971 | 0 |
| C | 0 | 7877 | 0 |
| D | 0 | 9395 | 0 |
| Quadrant | Total seconds | Saturated seconds | Saturation percentage |
|---|---|---|---|
| A | 3689 | 336 | 9.108159% |
| B | 3688 | 38 | 1.030369% |
| C | 3688 | 54 | 1.464208% |
| D | 3688 | 44 | 1.193059% |
Noise dominated data is calculated using 1-second bins in cleaned event files. If a bin has >2000 counts, and if more than 50% of those come from <1% of pixels, then it is considered to be noise-dominated and hence unusable.
| Quadrant | # 1 sec bins | Bins with >0 counts | Bins with >2000 counts | High rate bins dominated by noise | Noise dominated (total time) | Noise dominated (detector-on time) | Marked lightcurve |
|---|---|---|---|---|---|---|---|
| A | 4759 | 3689 | 277 | 277 | 5.82% | 7.51% | 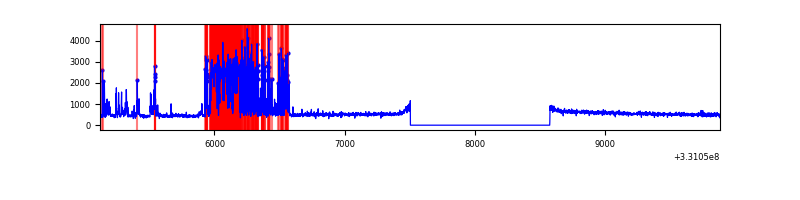 |
| B | 4758 | 3688 | 0 | 0 | 0.00% | 0.00% | 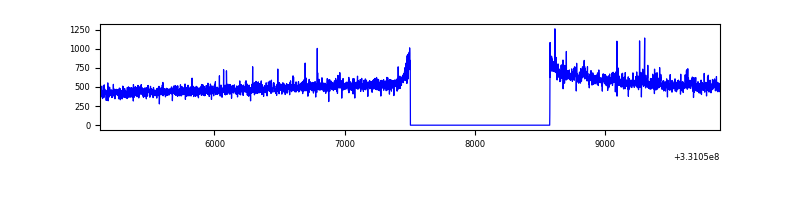 |
| C | 4758 | 3689 | 0 | 0 | 0.00% | 0.00% | 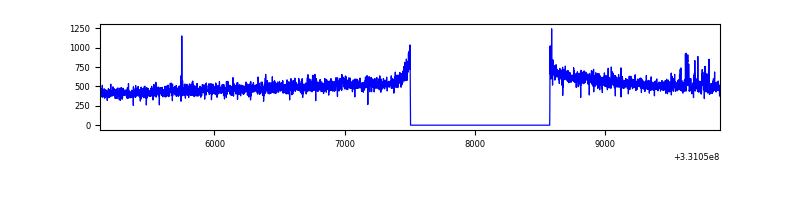 |
| D | 4758 | 3689 | 21 | 21 | 0.44% | 0.57% | 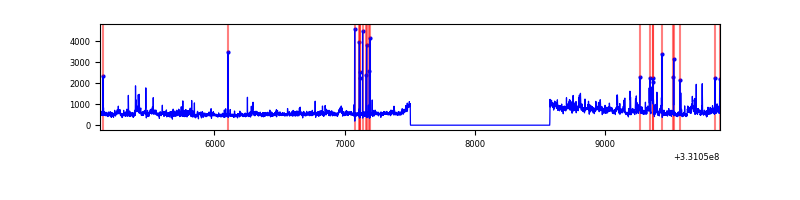 |
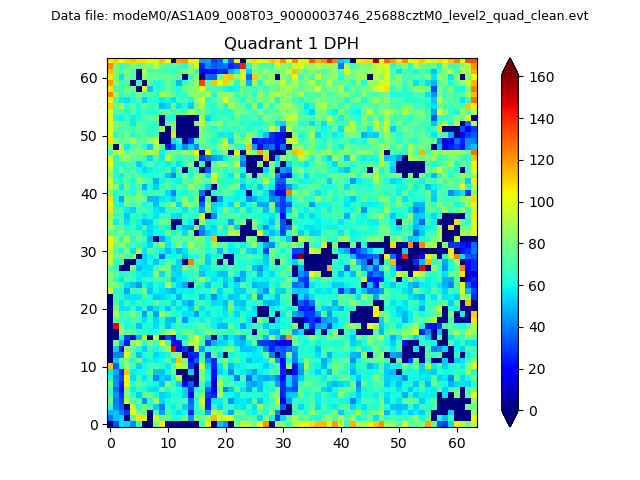
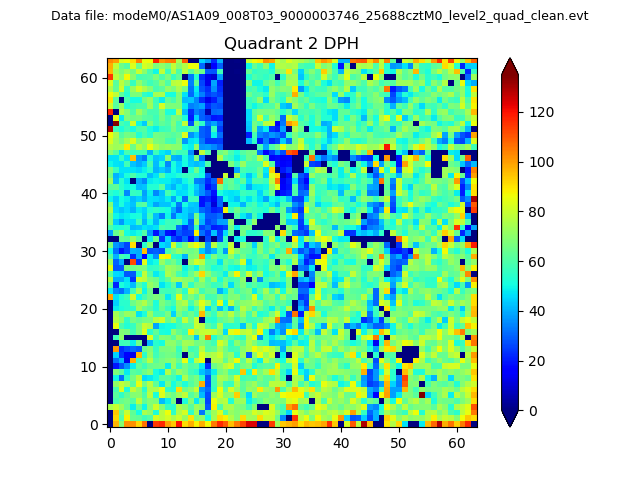
Top three noisy pixels from each quadrant. If the there are fewer than three noisy pixels in the level2.evt file, extra rows are filled as -1
| Pixel properties | Quadrant properties | ||||||
|---|---|---|---|---|---|---|---|
| Quadrant | DetID | PixID | Counts | Sigma | Mean | Median | Sigma |
| A | 0 | 13 | 954539 | 10089.0 | 464 | 454 | 94.6 |
| A | 13 | 254 | 5091 | 49.03 | 464 | 454 | 94.6 |
| A | 4 | 2 | 4373 | 41.44 | 464 | 454 | 94.6 |
| B | 0 | 245 | 14085 | 146.91 | 478 | 467 | 92.7 |
| B | 12 | 111 | 11017 | 113.81 | 478 | 467 | 92.7 |
| B | 11 | 111 | 9985 | 102.67 | 478 | 467 | 92.7 |
| C | 14 | 238 | 72852 | 674.76 | 454 | 457 | 107.3 |
| C | 3 | 233 | 28279 | 259.32 | 454 | 457 | 107.3 |
| C | 13 | 61 | 3199 | 25.56 | 454 | 457 | 107.3 |
| D | 1 | 52 | 383705 | 3390.88 | 461 | 446 | 113.0 |
| D | 8 | 195 | 161697 | 1426.67 | 461 | 446 | 113.0 |
| D | 2 | 244 | 25804 | 224.35 | 461 | 446 | 113.0 |
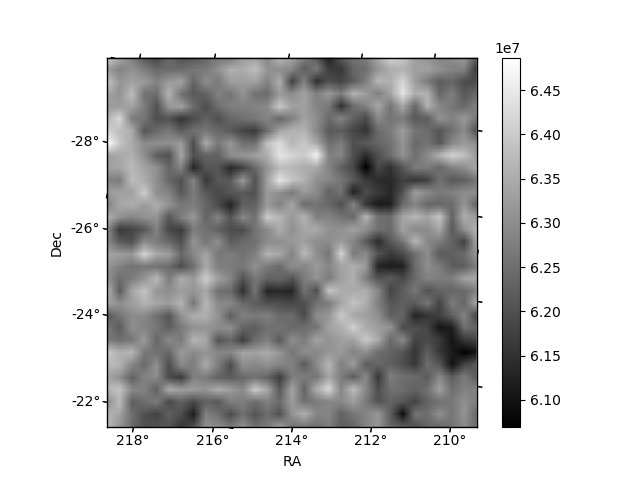
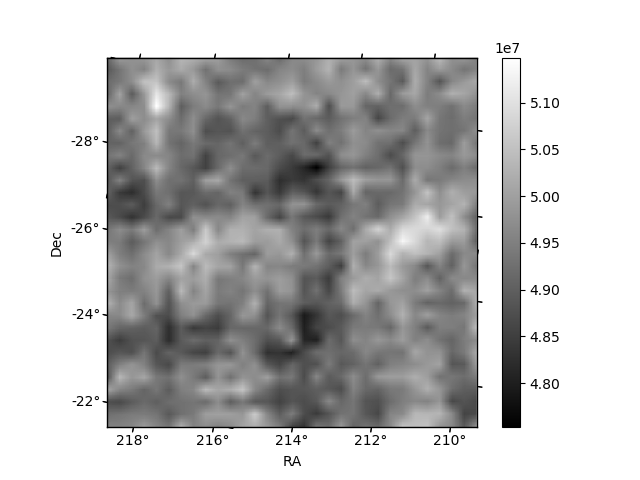
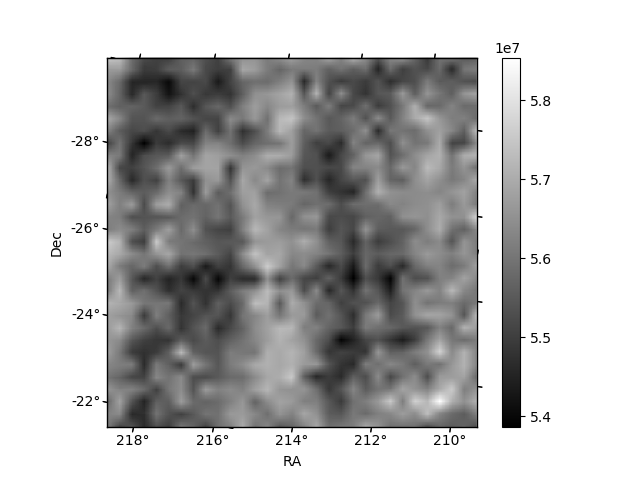
Histogram calculated using DETX and DETY for each event in the final _common_clean file
| Quadrant A | 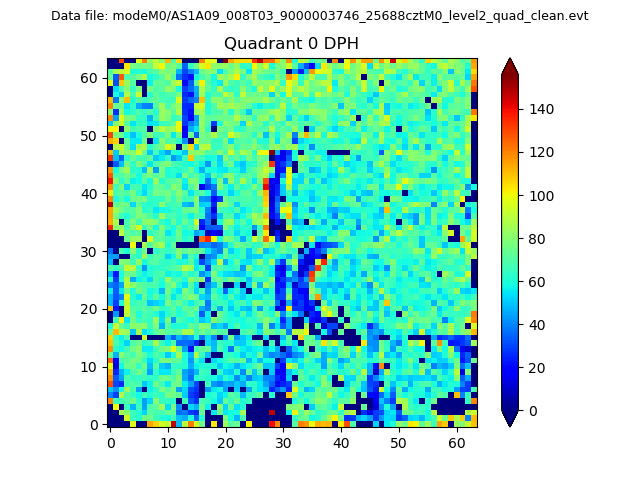 |
 |
Quadrant B |
|---|---|---|---|
| Quadrant D |  |
 |
Quadrant C |
| Plot type | Count rate plots | Images |
|---|---|---|
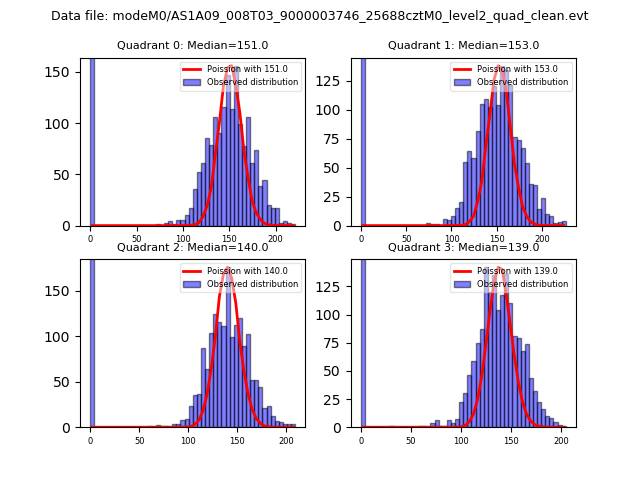
| Comparison with Poisson distribution Blue bars denote a histogram of data divided into 1 sec bins. Red curve is a Poisson curve with rate = median count rate of data. |
 |
 |
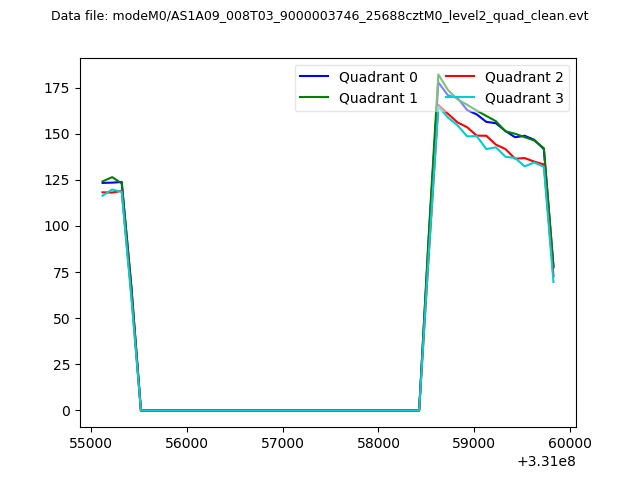
| Quadrant-wise count rates Data is divided into 100 sec bins |
 |
|
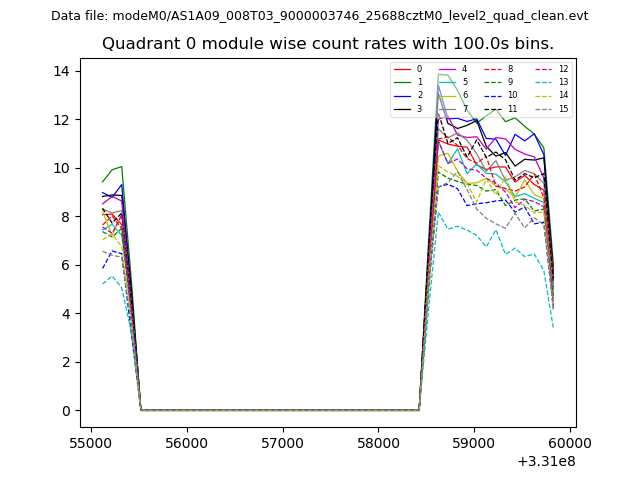
| Module-wise count rates for Quadrant A Data is divided into 100 sec bins |
 |
 |
| Module-wise count rates for Quadrant B Data is divided into 100 sec bins |
 |
 |
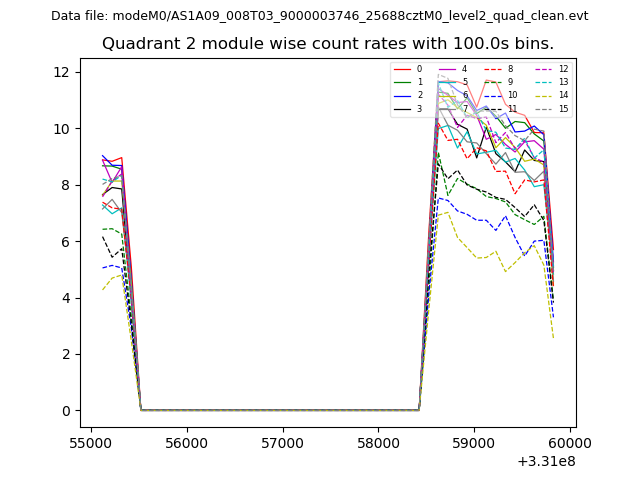
| Module-wise count rates for Quadrant C Data is divided into 100 sec bins |
 |
 |
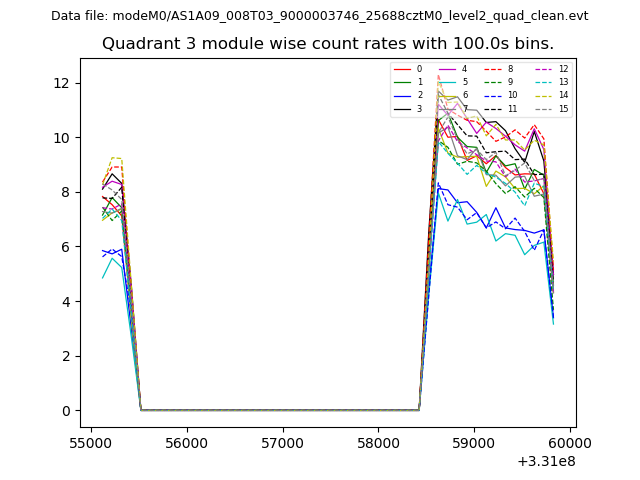
| Module-wise count rates for Quadrant D Data is divided into 100 sec bins |
 |
 |
| Parameter | Plot |
|---|---|
| CZT HV Monitor | 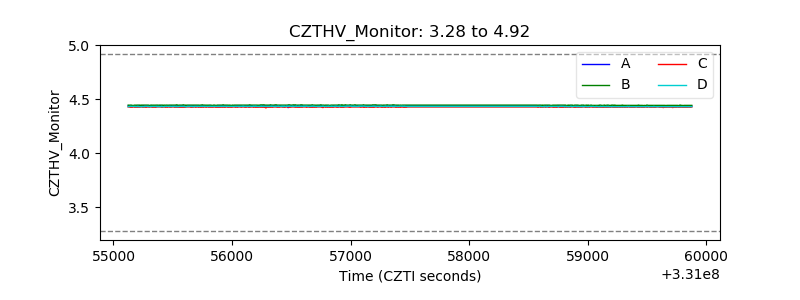 |
| D_VDD | 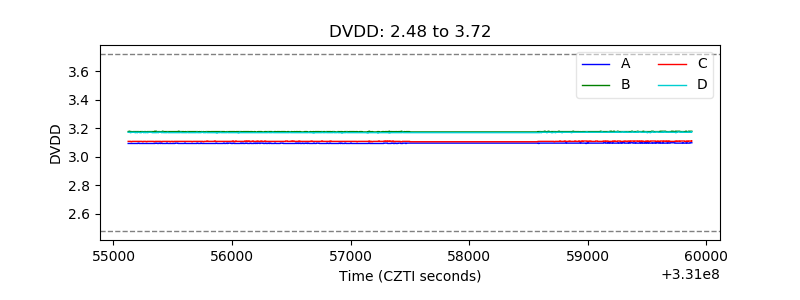 |
| Temperature 1 | 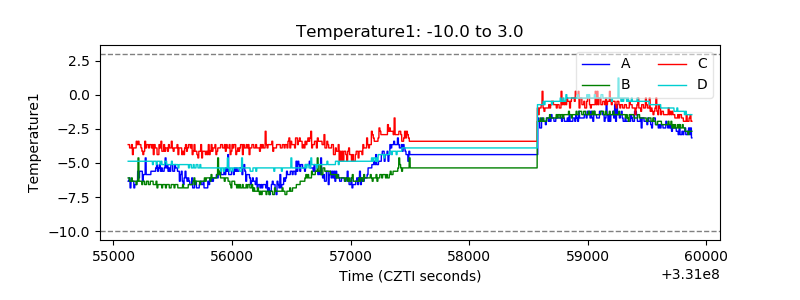 |
| Veto HV Monitor | 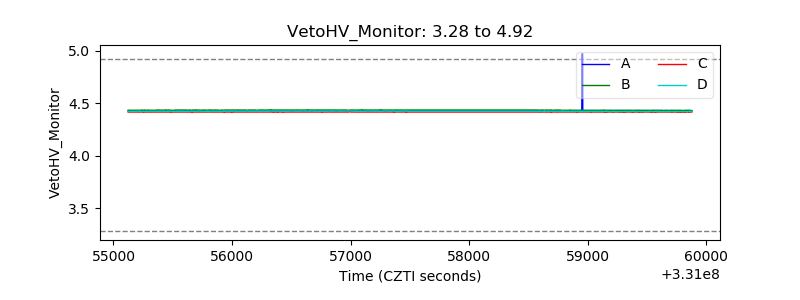 |
| Veto LLD | 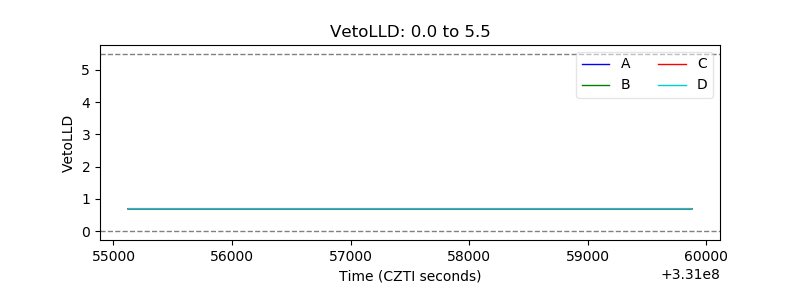 |
| Alpha Counter | 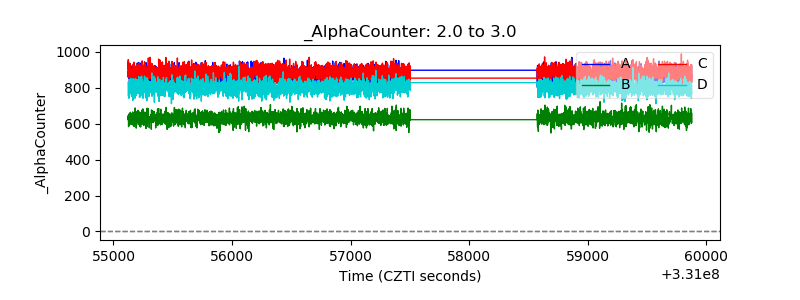 |
| _CPM_Rate |  |
| CZT Counter | 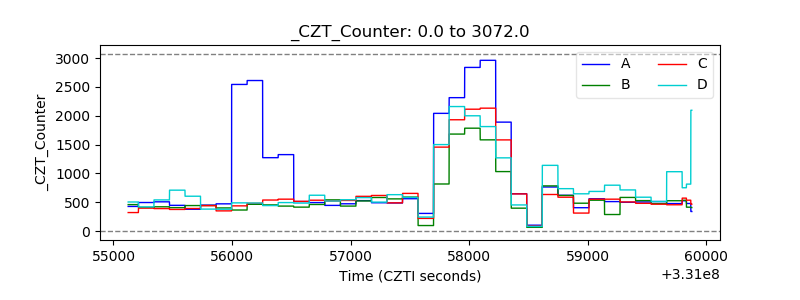 |
| +2.5 Volts monitor |  |
| +5 Volts monitor |  |
| _ROLL_ROT | 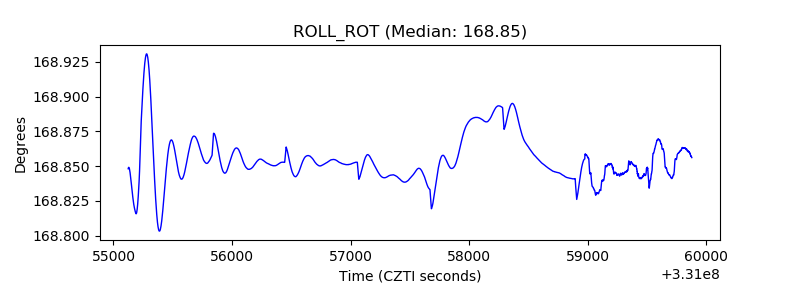 |
| _Roll_DEC | 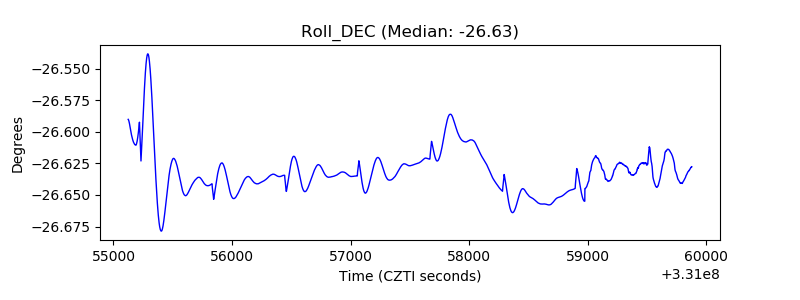 |
| _Roll_RA | 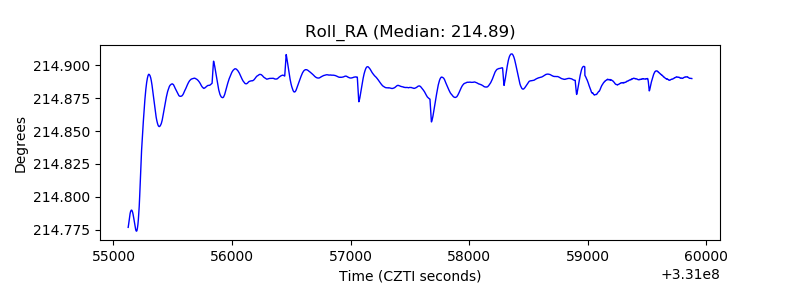 |
| Veto Counter | 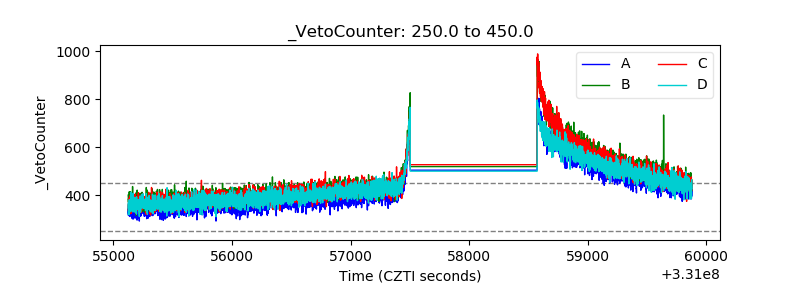 |