| Param | Original file | Final file |
|---|---|---|
| Filename | modeM0/AS1A09_008T03_9000003746_25690cztM0_level2.evt | modeM0/AS1A09_008T03_9000003746_25690cztM0_level2_quad_clean.evt |
| Size (bytes) | 518,437,440 | 94,121,280 |
| Size | 494.4 MB | 89.8 MB |
| Events in quadrant A | 3,291,963 | 630,110 |
| Events in quadrant B | 3,361,092 | 636,006 |
| Events in quadrant C | 4,233,414 | 565,847 |
| Events in quadrant D | 4,381,943 | 573,280 |
| Mode M9 | |||
|---|---|---|---|
| Quadrant | BADHDUFLAG | Total packets | Discarded packets |
| A | 0 | 15 | 0 |
| B | 0 | 16 | 0 |
| C | 0 | 16 | 0 |
| D | 0 | 16 | 0 |
| Mode M0 | |||
|---|---|---|---|
| Quadrant | BADHDUFLAG | Total packets | Discarded packets |
| A | 0 | 13884 | 0 |
| B | 0 | 14054 | 0 |
| C | 0 | 16813 | 0 |
| D | 0 | 17183 | 0 |
| Quadrant | Total seconds | Saturated seconds | Saturation percentage |
|---|---|---|---|
| A | 6376 | 25 | 0.392095% |
| B | 6376 | 40 | 0.627353% |
| C | 6376 | 460 | 7.214555% |
| D | 6376 | 128 | 2.007528% |
Noise dominated data is calculated using 1-second bins in cleaned event files. If a bin has >2000 counts, and if more than 50% of those come from <1% of pixels, then it is considered to be noise-dominated and hence unusable.
| Quadrant | # 1 sec bins | Bins with >0 counts | Bins with >2000 counts | High rate bins dominated by noise | Noise dominated (total time) | Noise dominated (detector-on time) | Marked lightcurve |
|---|---|---|---|---|---|---|---|
| A | 7596 | 6376 | 1 | 1 | 0.01% | 0.02% | 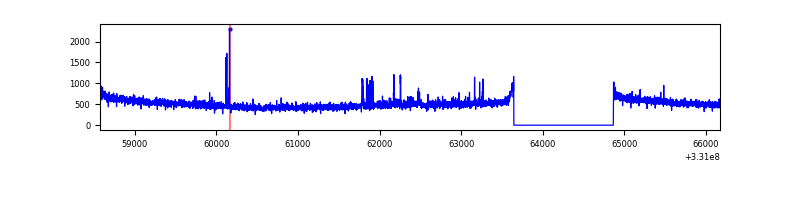 |
| B | 7596 | 6377 | 1 | 1 | 0.01% | 0.02% | 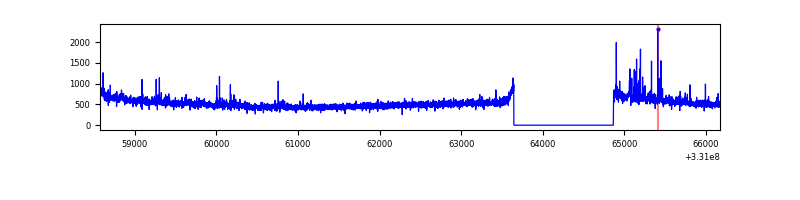 |
| C | 7596 | 6376 | 322 | 322 | 4.24% | 5.05% | 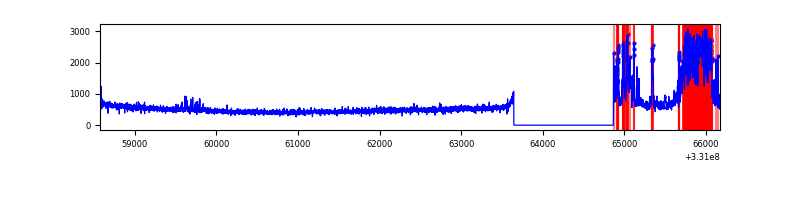 |
| D | 7596 | 6377 | 133 | 133 | 1.75% | 2.09% | 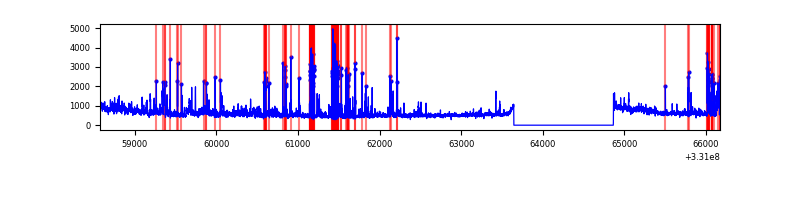 |
Top three noisy pixels from each quadrant. If the there are fewer than three noisy pixels in the level2.evt file, extra rows are filled as -1
| Pixel properties | Quadrant properties | ||||||
|---|---|---|---|---|---|---|---|
| Quadrant | DetID | PixID | Counts | Sigma | Mean | Median | Sigma |
| A | 8 | 192 | 41706 | 244.67 | 833 | 818 | 167.1 |
| A | 0 | 13 | 19689 | 112.92 | 833 | 818 | 167.1 |
| A | 10 | 17 | 17815 | 101.71 | 833 | 818 | 167.1 |
| B | 0 | 219 | 47997 | 303.17 | 824 | 805 | 155.7 |
| B | 0 | 245 | 36763 | 231.0 | 824 | 805 | 155.7 |
| B | 4 | 171 | 26213 | 163.23 | 824 | 805 | 155.7 |
| C | 3 | 233 | 1122712 | 6319.07 | 766 | 771 | 177.5 |
| C | 14 | 238 | 123183 | 689.45 | 766 | 771 | 177.5 |
| C | 13 | 61 | 5515 | 26.72 | 766 | 771 | 177.5 |
| D | 1 | 52 | 857664 | 4453.6 | 790 | 768 | 192.4 |
| D | 8 | 195 | 333237 | 1727.96 | 790 | 768 | 192.4 |
| D | 13 | 104 | 90501 | 466.37 | 790 | 768 | 192.4 |
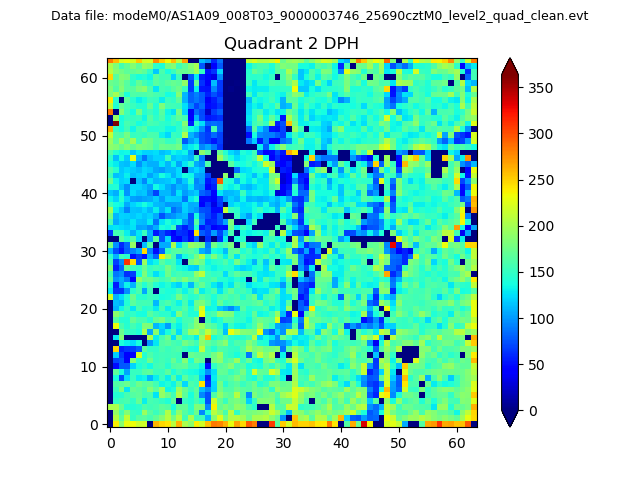
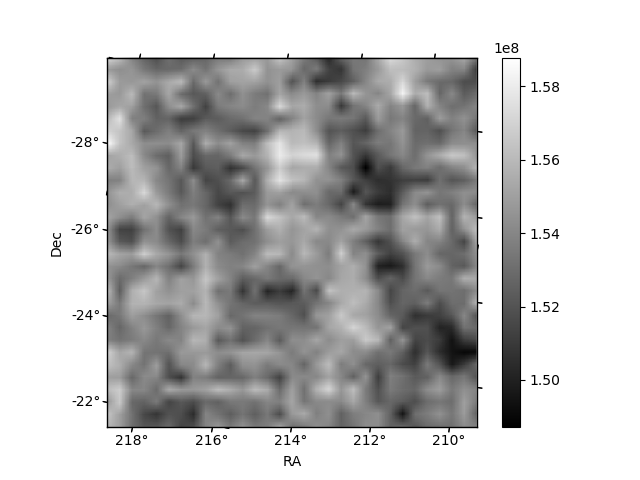
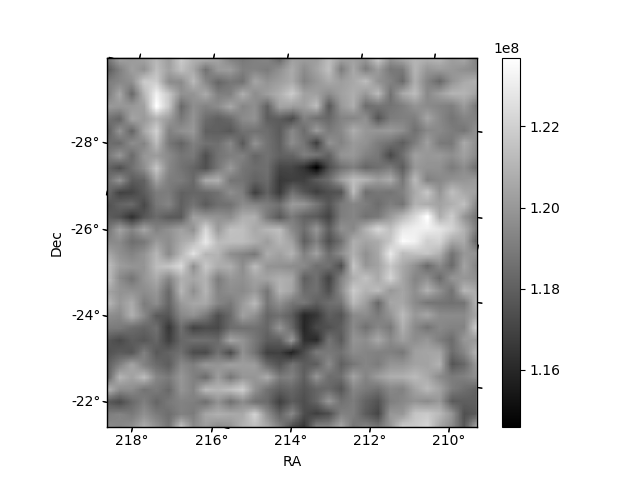
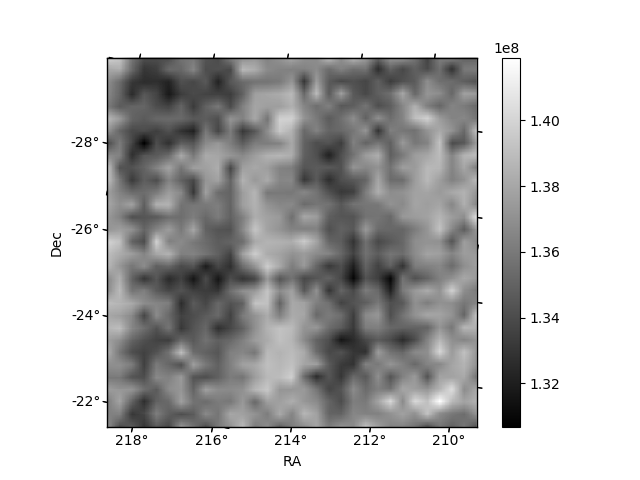
Histogram calculated using DETX and DETY for each event in the final _common_clean file
| Quadrant A | 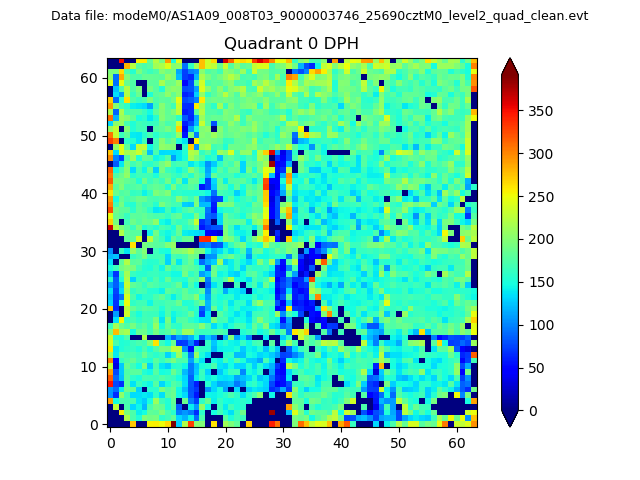 |
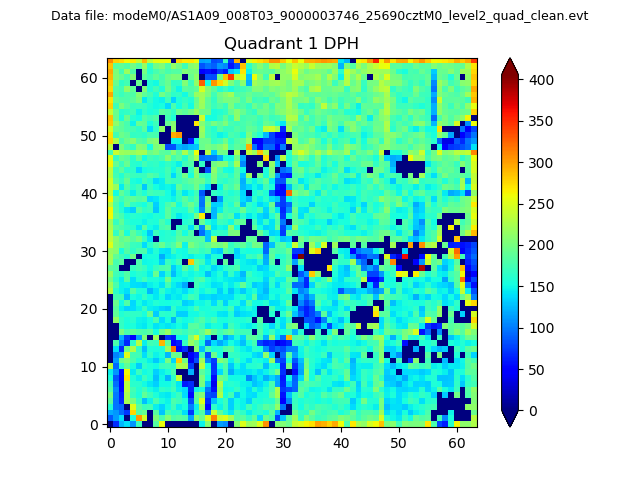 |
Quadrant B |
|---|---|---|---|
| Quadrant D | 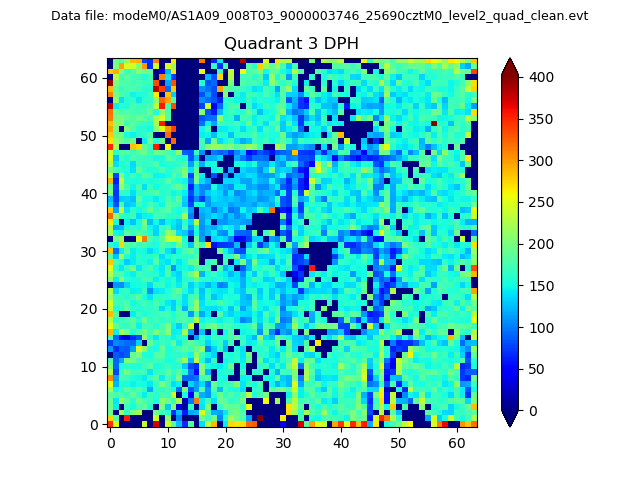 |
 |
Quadrant C |
| Plot type | Count rate plots | Images |
|---|---|---|
| Comparison with Poisson distribution Blue bars denote a histogram of data divided into 1 sec bins. Red curve is a Poisson curve with rate = median count rate of data. |
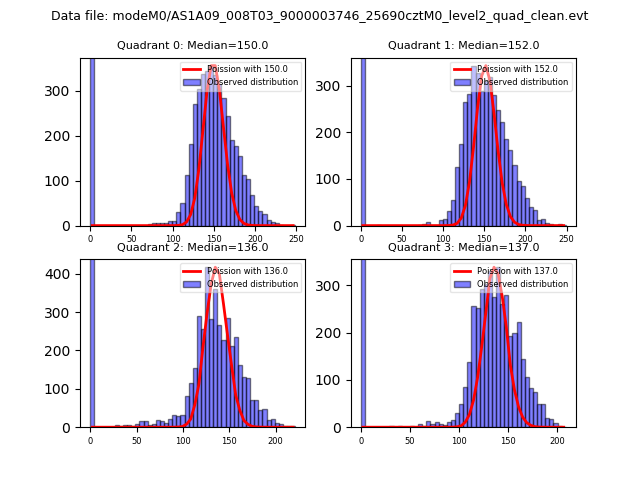 |
 |
| Quadrant-wise count rates Data is divided into 100 sec bins |
 |
|
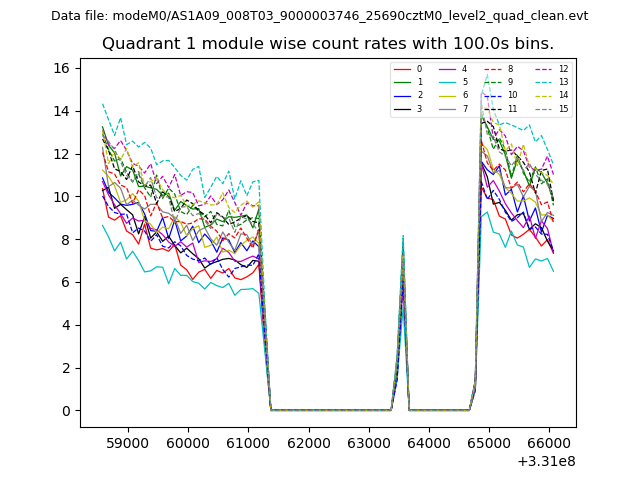
| Module-wise count rates for Quadrant A Data is divided into 100 sec bins |
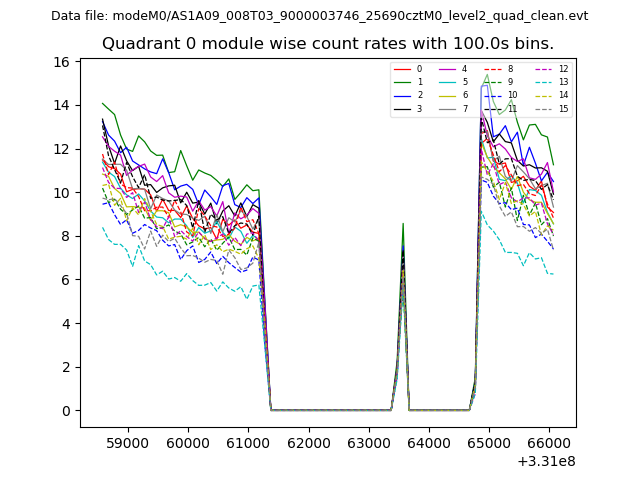 |
 |
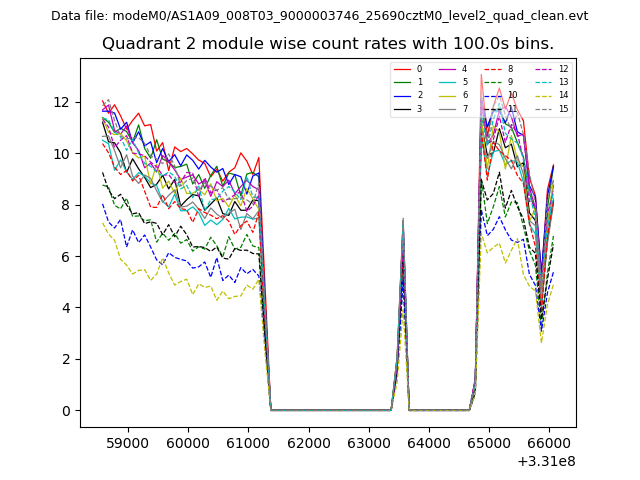
| Module-wise count rates for Quadrant B Data is divided into 100 sec bins |
 |
 |
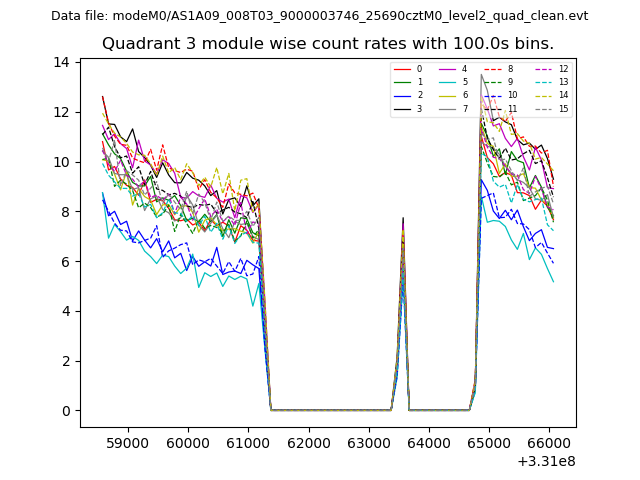
| Module-wise count rates for Quadrant C Data is divided into 100 sec bins |
 |
 |
| Module-wise count rates for Quadrant D Data is divided into 100 sec bins |
 |
 |
| Parameter | Plot |
|---|---|
| CZT HV Monitor | 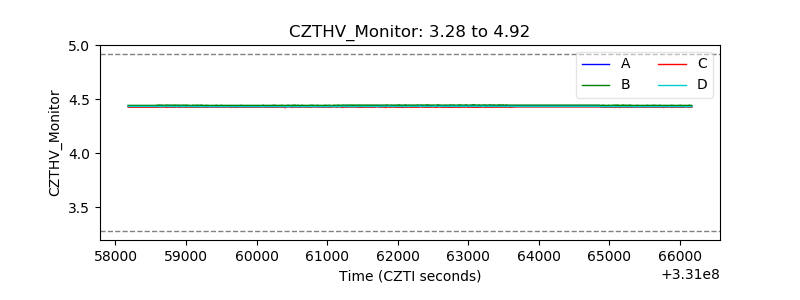 |
| D_VDD | 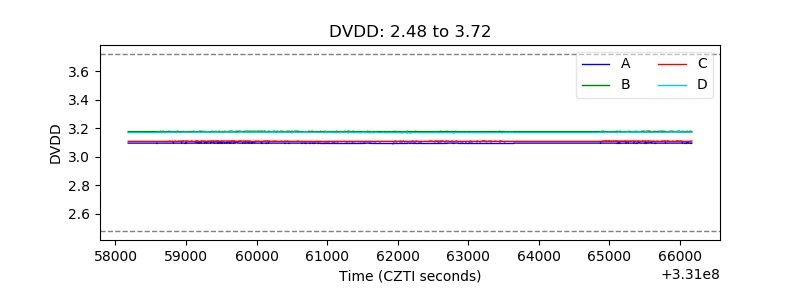 |
| Temperature 1 | 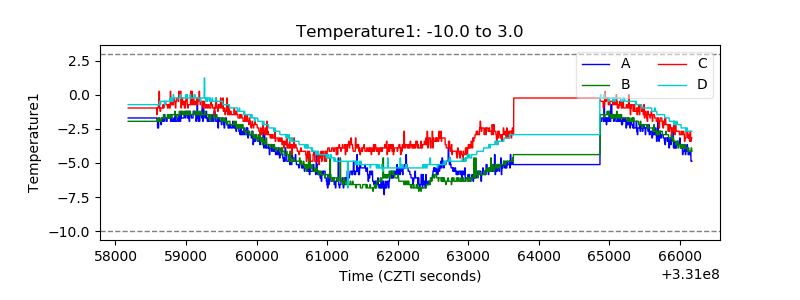 |
| Veto HV Monitor | 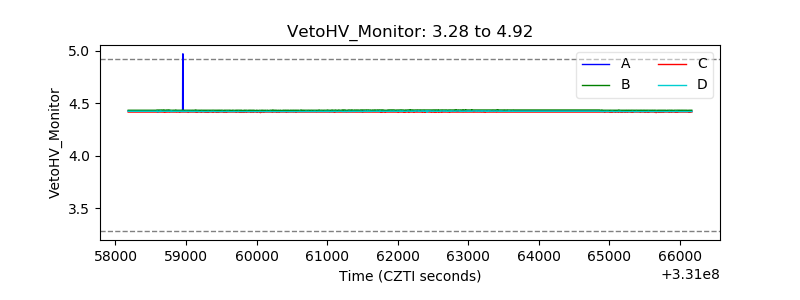 |
| Veto LLD | 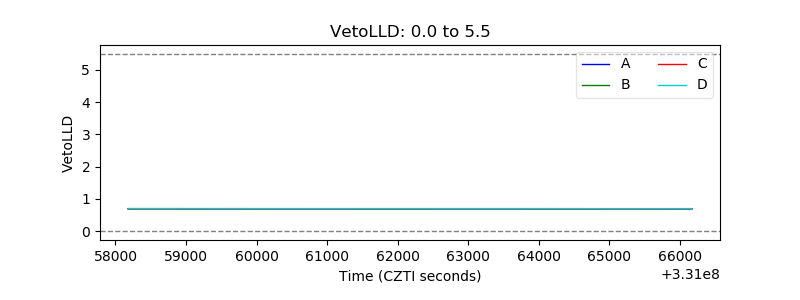 |
| Alpha Counter |  |
| _CPM_Rate | 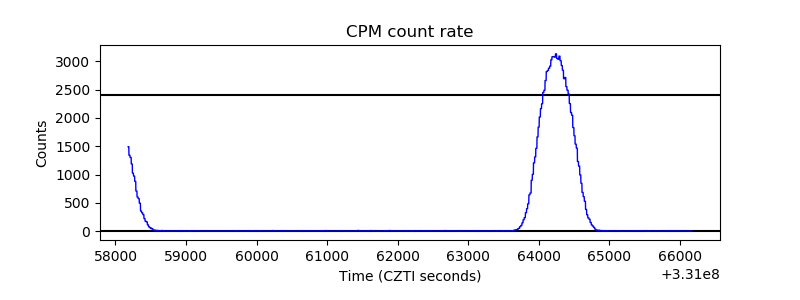 |
| CZT Counter | 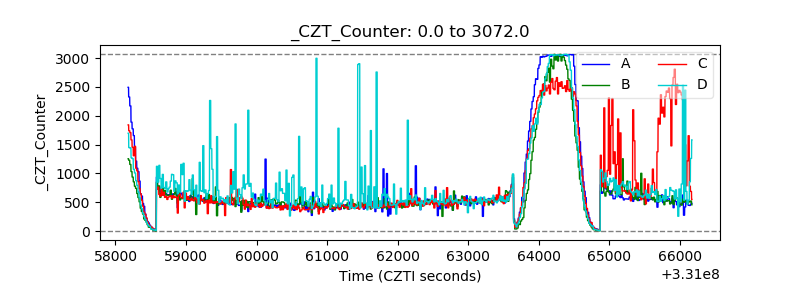 |
| +2.5 Volts monitor | 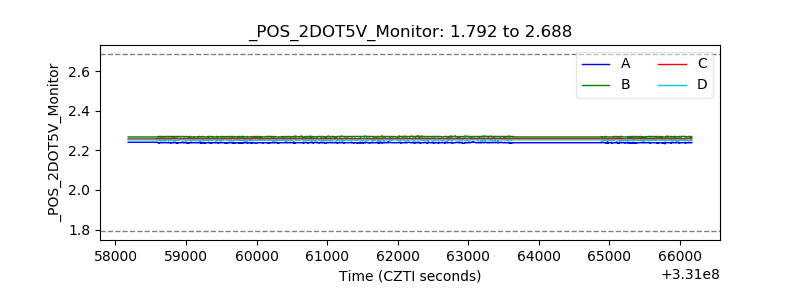 |
| +5 Volts monitor |  |
| _ROLL_ROT | 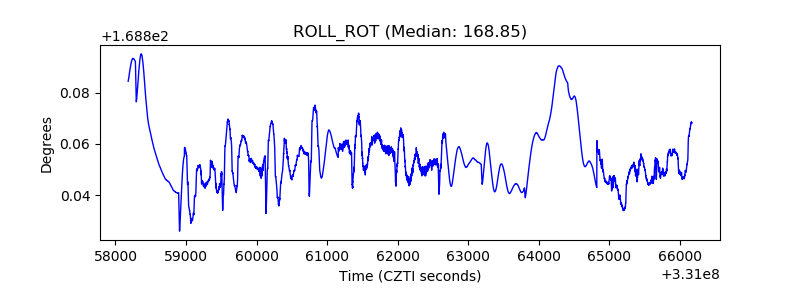 |
| _Roll_DEC | 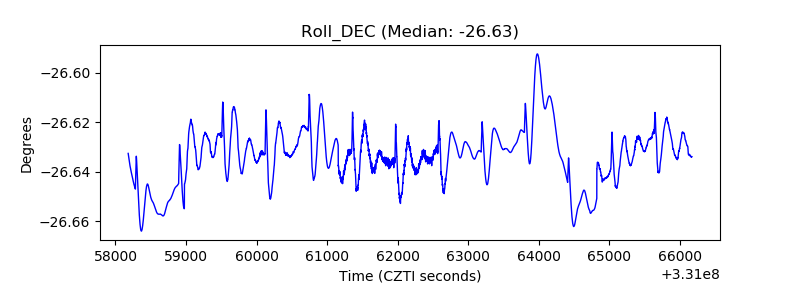 |
| _Roll_RA | 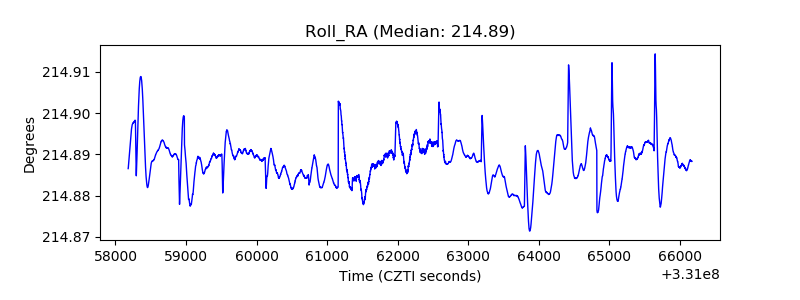 |
| Veto Counter | 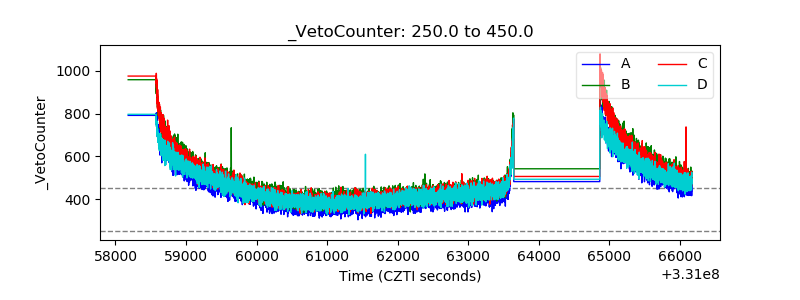 |