| Param | Original file | Final file |
|---|---|---|
| Filename | modeM0/AS1A09_008T03_9000003746_25692cztM0_level2.evt | modeM0/AS1A09_008T03_9000003746_25692cztM0_level2_quad_clean.evt |
| Size (bytes) | 467,346,240 | 97,655,040 |
| Size | 445.7 MB | 93.1 MB |
| Events in quadrant A | 3,267,134 | 651,207 |
| Events in quadrant B | 3,381,300 | 669,370 |
| Events in quadrant C | 3,439,452 | 615,853 |
| Events in quadrant D | 3,648,649 | 592,089 |
| Mode M9 | |||
|---|---|---|---|
| Quadrant | BADHDUFLAG | Total packets | Discarded packets |
| A | 0 | 19 | 0 |
| B | 0 | 20 | 0 |
| C | 0 | 20 | 0 |
| D | 0 | 20 | 0 |
| Mode M0 | |||
|---|---|---|---|
| Quadrant | BADHDUFLAG | Total packets | Discarded packets |
| A | 0 | 13480 | 0 |
| B | 0 | 13739 | 0 |
| C | 0 | 14002 | 0 |
| D | 0 | 14836 | 0 |
| Quadrant | Total seconds | Saturated seconds | Saturation percentage |
|---|---|---|---|
| A | 6149 | 26 | 0.422833% |
| B | 6149 | 36 | 0.585461% |
| C | 6148 | 68 | 1.106051% |
| D | 6148 | 36 | 0.585556% |
Noise dominated data is calculated using 1-second bins in cleaned event files. If a bin has >2000 counts, and if more than 50% of those come from <1% of pixels, then it is considered to be noise-dominated and hence unusable.
| Quadrant | # 1 sec bins | Bins with >0 counts | Bins with >2000 counts | High rate bins dominated by noise | Noise dominated (total time) | Noise dominated (detector-on time) | Marked lightcurve |
|---|---|---|---|---|---|---|---|
| A | 7554 | 6150 | 5 | 5 | 0.07% | 0.08% | 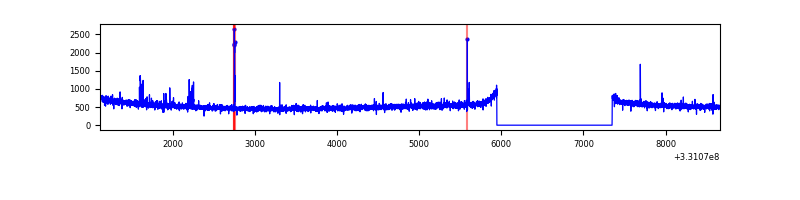 |
| B | 7554 | 6150 | 2 | 2 | 0.03% | 0.03% | 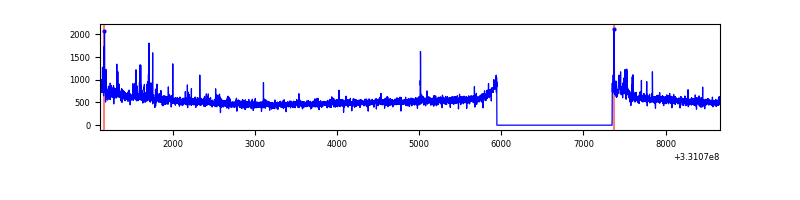 |
| C | 7553 | 6149 | 6 | 6 | 0.08% | 0.10% | 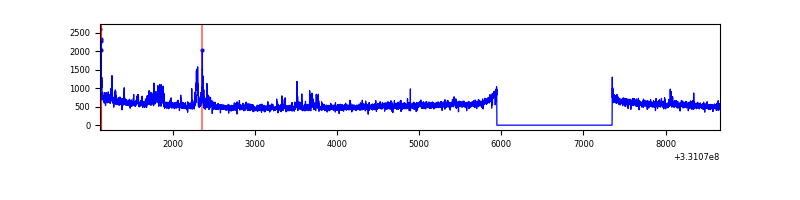 |
| D | 7553 | 6149 | 20 | 20 | 0.26% | 0.33% | 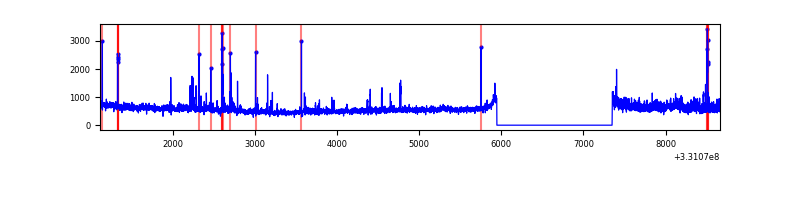 |
Top three noisy pixels from each quadrant. If the there are fewer than three noisy pixels in the level2.evt file, extra rows are filled as -1
| Pixel properties | Quadrant properties | ||||||
|---|---|---|---|---|---|---|---|
| Quadrant | DetID | PixID | Counts | Sigma | Mean | Median | Sigma |
| A | 8 | 192 | 23352 | 135.06 | 836 | 821 | 166.8 |
| A | 0 | 13 | 22118 | 127.66 | 836 | 821 | 166.8 |
| A | 13 | 254 | 9618 | 52.73 | 836 | 821 | 166.8 |
| B | 0 | 245 | 62225 | 391.78 | 836 | 820 | 156.7 |
| B | 0 | 190 | 27263 | 168.71 | 836 | 820 | 156.7 |
| B | 12 | 111 | 18291 | 111.47 | 836 | 820 | 156.7 |
| C | 3 | 233 | 242456 | 1324.52 | 787 | 793 | 182.5 |
| C | 14 | 238 | 129310 | 704.38 | 787 | 793 | 182.5 |
| C | 13 | 61 | 5521 | 25.91 | 787 | 793 | 182.5 |
| D | 8 | 195 | 418902 | 2156.18 | 789 | 764 | 193.9 |
| D | 1 | 52 | 137365 | 704.4 | 789 | 764 | 193.9 |
| D | 13 | 104 | 40070 | 202.68 | 789 | 764 | 193.9 |
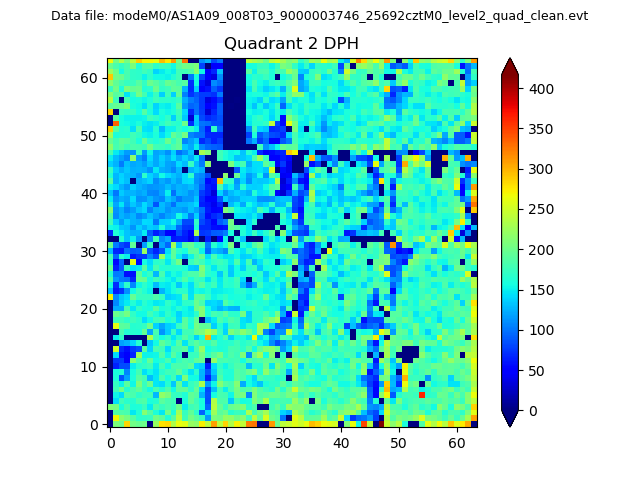
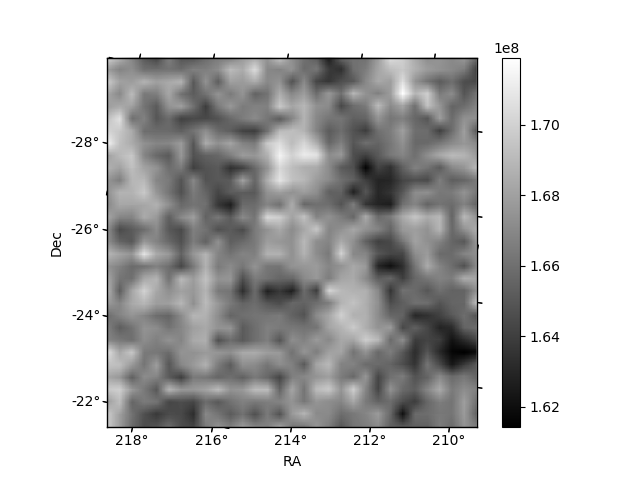
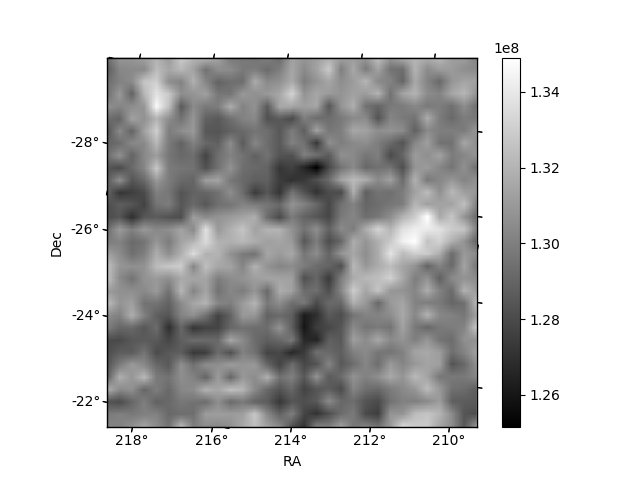
Histogram calculated using DETX and DETY for each event in the final _common_clean file
| Quadrant A | 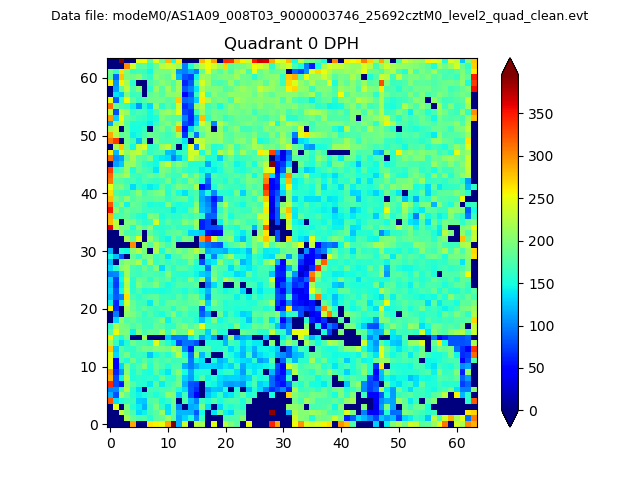 |
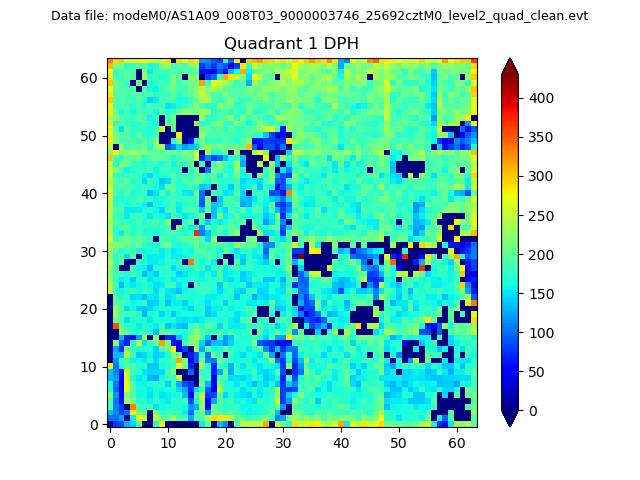 |
Quadrant B |
|---|---|---|---|
| Quadrant D | 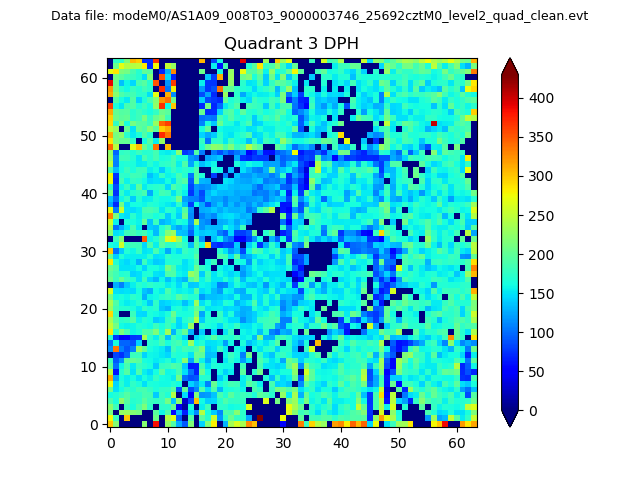 |
 |
Quadrant C |
| Plot type | Count rate plots | Images |
|---|---|---|
| Comparison with Poisson distribution Blue bars denote a histogram of data divided into 1 sec bins. Red curve is a Poisson curve with rate = median count rate of data. |
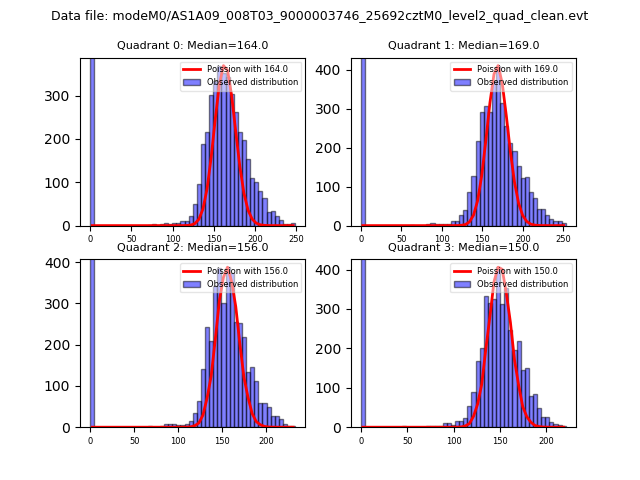 |
 |
| Quadrant-wise count rates Data is divided into 100 sec bins |
 |
|
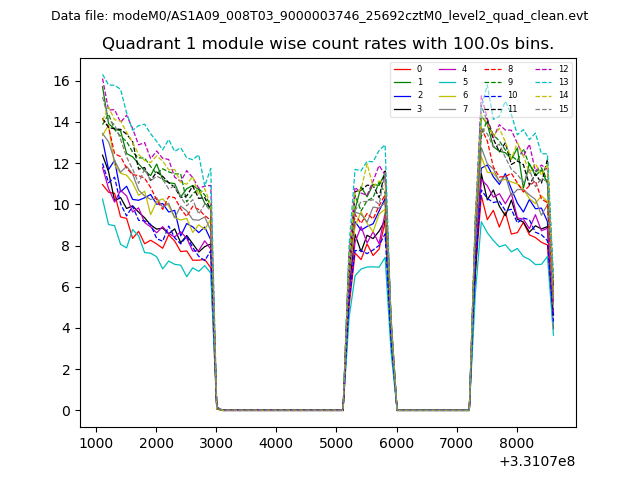
| Module-wise count rates for Quadrant A Data is divided into 100 sec bins |
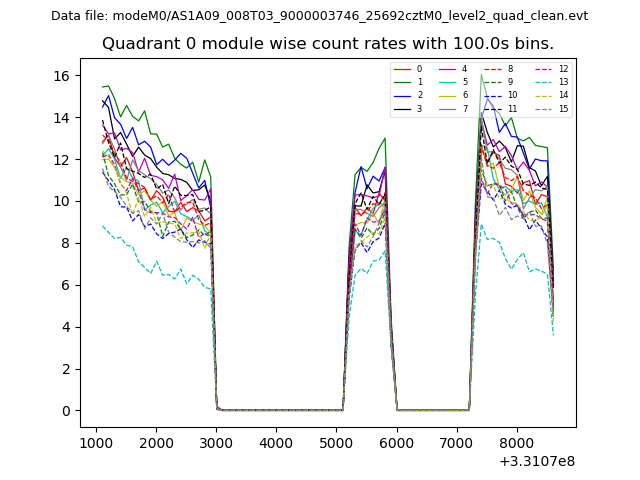 |
 |
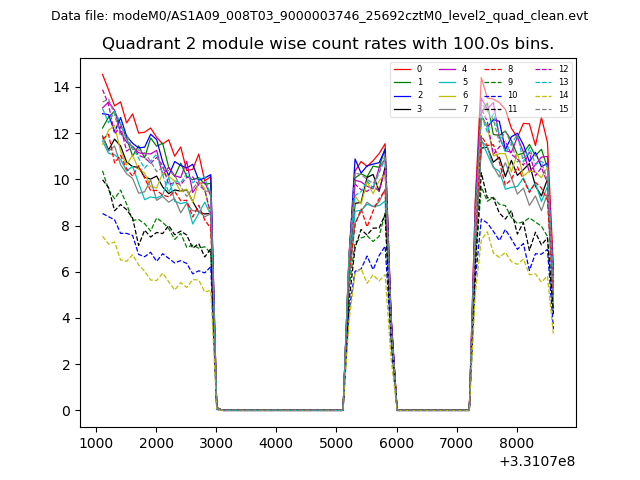
| Module-wise count rates for Quadrant B Data is divided into 100 sec bins |
 |
 |
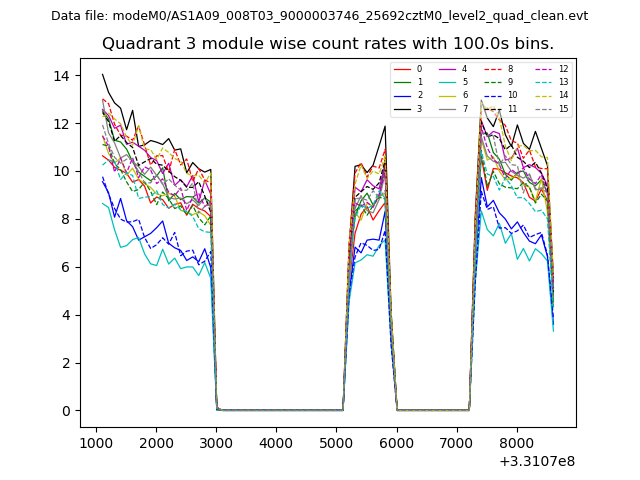
| Module-wise count rates for Quadrant C Data is divided into 100 sec bins |
 |
 |
| Module-wise count rates for Quadrant D Data is divided into 100 sec bins |
 |
 |
| Parameter | Plot |
|---|---|
| CZT HV Monitor |  |
| D_VDD | 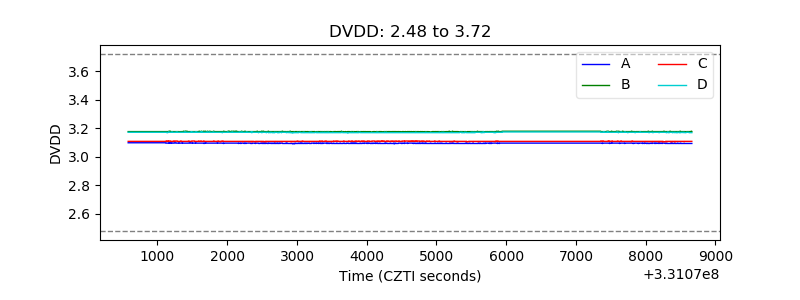 |
| Temperature 1 | 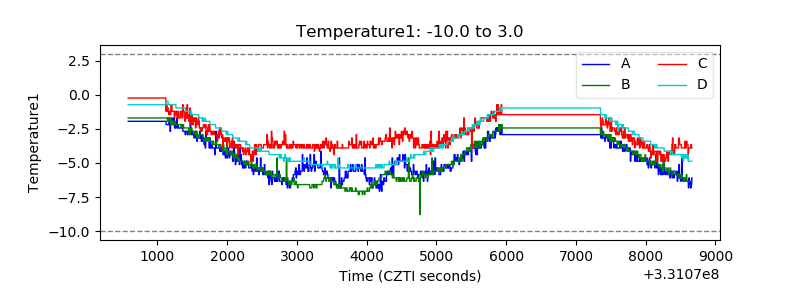 |
| Veto HV Monitor | 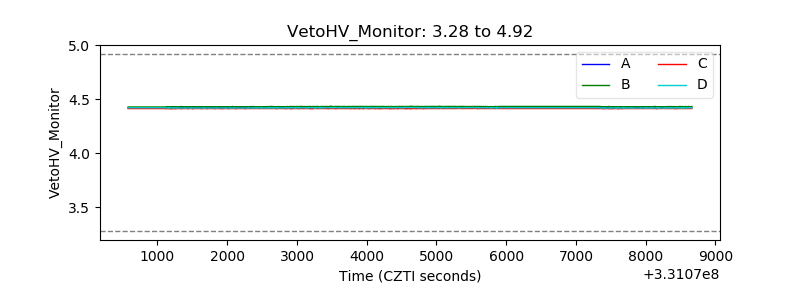 |
| Veto LLD | 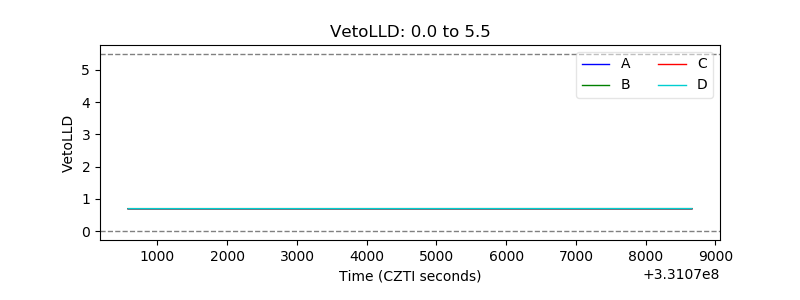 |
| Alpha Counter | 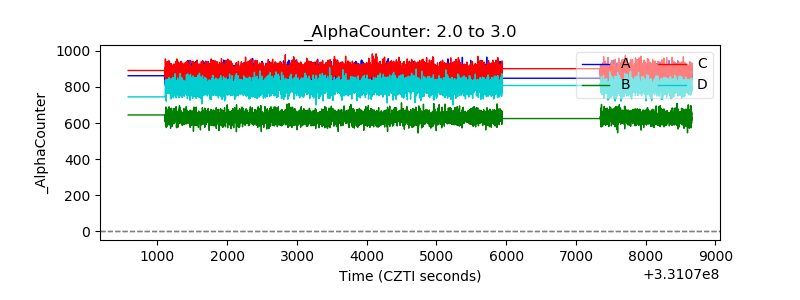 |
| _CPM_Rate | 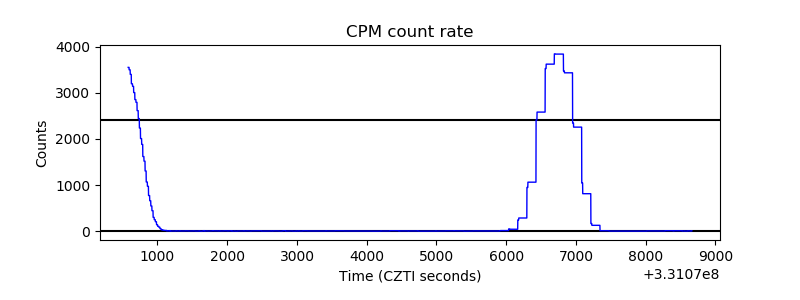 |
| CZT Counter | 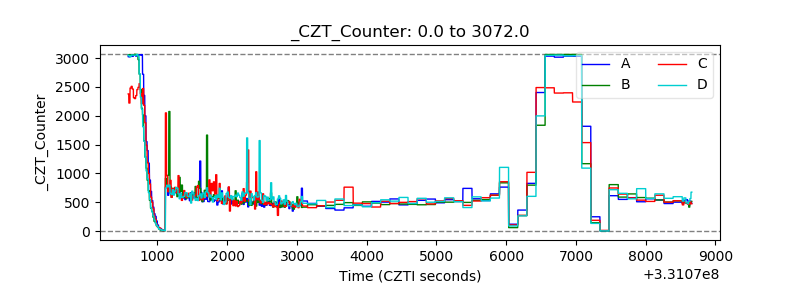 |
| +2.5 Volts monitor | 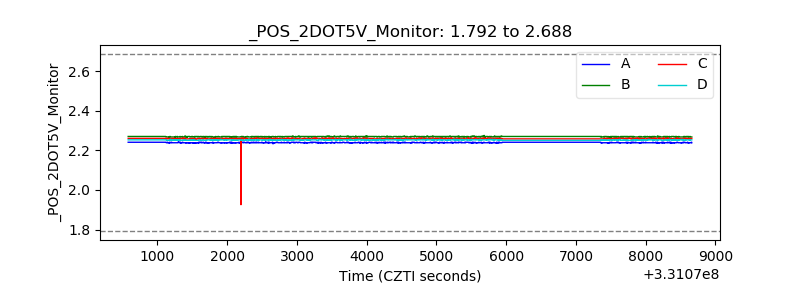 |
| +5 Volts monitor |  |
| _ROLL_ROT | 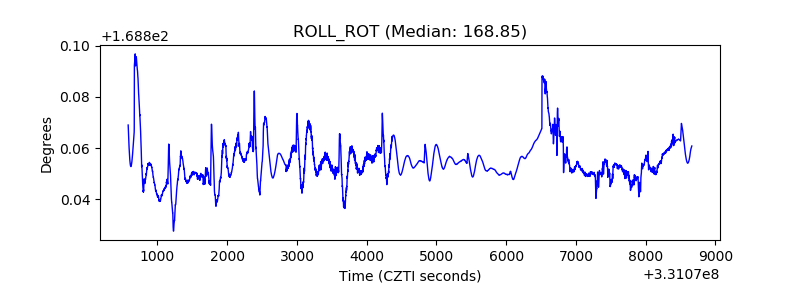 |
| _Roll_DEC | 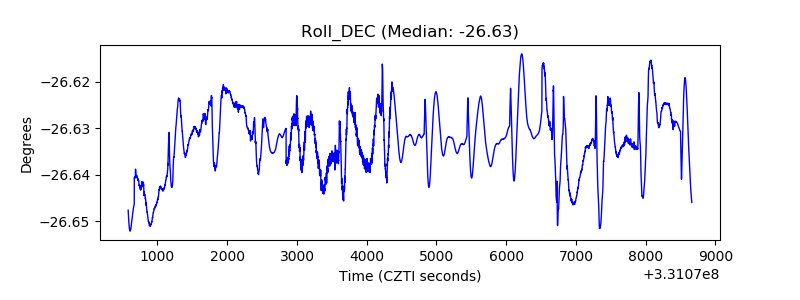 |
| _Roll_RA | 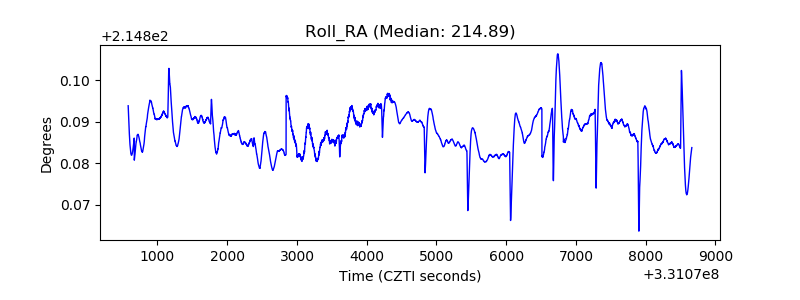 |
| Veto Counter | 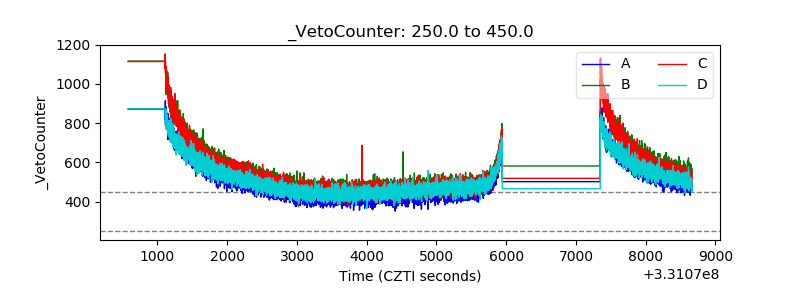 |