| Param | Original file | Final file |
|---|---|---|
| Filename | modeM0/AS1A09_008T03_9000003746_25694cztM0_level2.evt | modeM0/AS1A09_008T03_9000003746_25694cztM0_level2_quad_clean.evt |
| Size (bytes) | 804,409,920 | 133,660,800 |
| Size | 767.1 MB | 127.5 MB |
| Events in quadrant A | 5,692,918 | 849,139 |
| Events in quadrant B | 5,559,020 | 874,597 |
| Events in quadrant C | 5,463,972 | 815,154 |
| Events in quadrant D | 6,929,212 | 775,822 |
| Mode M9 | |||
|---|---|---|---|
| Quadrant | BADHDUFLAG | Total packets | Discarded packets |
| A | 0 | 27 | 0 |
| B | 0 | 27 | 0 |
| C | 0 | 27 | 0 |
| D | 0 | 27 | 0 |
| Mode M0 | |||
|---|---|---|---|
| Quadrant | BADHDUFLAG | Total packets | Discarded packets |
| A | 0 | 23229 | 0 |
| B | 0 | 22614 | 0 |
| C | 0 | 22342 | 0 |
| D | 0 | 27526 | 0 |
| Quadrant | Total seconds | Saturated seconds | Saturation percentage |
|---|---|---|---|
| A | 10588 | 111 | 1.048357% |
| B | 10588 | 102 | 0.963355% |
| C | 10588 | 128 | 1.208916% |
| D | 10588 | 287 | 2.710616% |
Noise dominated data is calculated using 1-second bins in cleaned event files. If a bin has >2000 counts, and if more than 50% of those come from <1% of pixels, then it is considered to be noise-dominated and hence unusable.
| Quadrant | # 1 sec bins | Bins with >0 counts | Bins with >2000 counts | High rate bins dominated by noise | Noise dominated (total time) | Noise dominated (detector-on time) | Marked lightcurve |
|---|---|---|---|---|---|---|---|
| A | 13278 | 10591 | 53 | 53 | 0.40% | 0.50% | 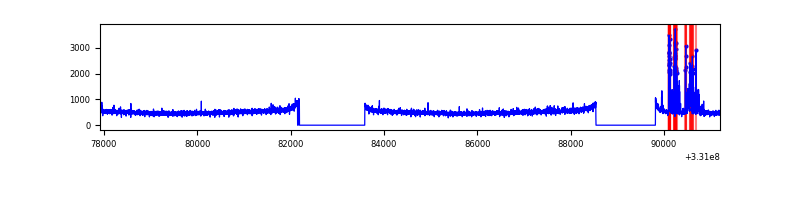 |
| B | 13278 | 10591 | 1 | 1 | 0.01% | 0.01% | 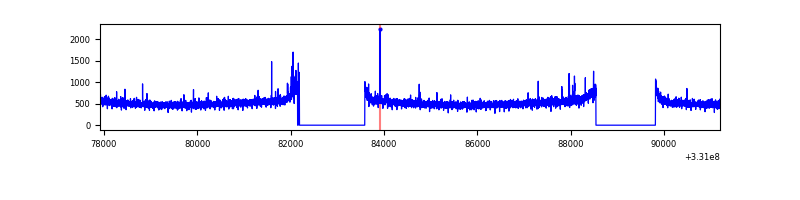 |
| C | 13278 | 10591 | 1 | 1 | 0.01% | 0.01% | 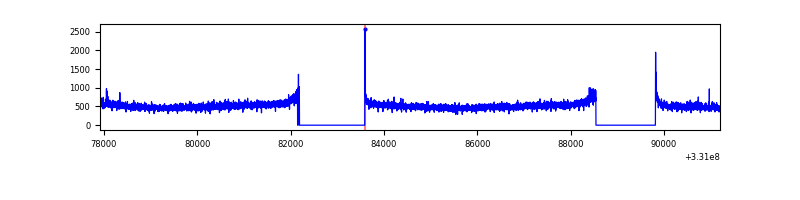 |
| D | 13278 | 10591 | 216 | 216 | 1.63% | 2.04% | 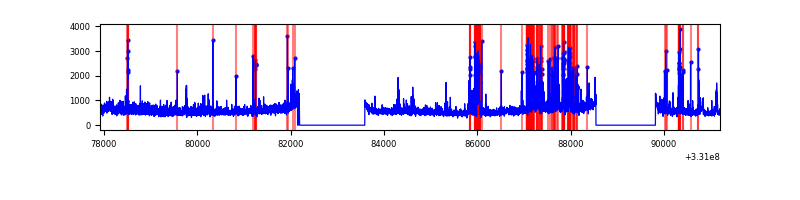 |
Top three noisy pixels from each quadrant. If the there are fewer than three noisy pixels in the level2.evt file, extra rows are filled as -1
| Pixel properties | Quadrant properties | ||||||
|---|---|---|---|---|---|---|---|
| Quadrant | DetID | PixID | Counts | Sigma | Mean | Median | Sigma |
| A | 0 | 13 | 307721 | 1110.51 | 1395 | 1372 | 275.9 |
| A | 13 | 254 | 15982 | 52.96 | 1395 | 1372 | 275.9 |
| A | 3 | 137 | 12376 | 39.89 | 1395 | 1372 | 275.9 |
| B | 0 | 190 | 49278 | 183.12 | 1396 | 1366 | 261.6 |
| B | 12 | 111 | 31620 | 115.63 | 1396 | 1366 | 261.6 |
| B | 11 | 111 | 28577 | 104.0 | 1396 | 1366 | 261.6 |
| C | 14 | 238 | 216975 | 696.49 | 1331 | 1346 | 309.6 |
| C | 3 | 233 | 50535 | 158.88 | 1331 | 1346 | 309.6 |
| C | 0 | 10 | 13474 | 39.17 | 1331 | 1346 | 309.6 |
| D | 8 | 195 | 619190 | 1934.7 | 1317 | 1282 | 319.4 |
| D | 1 | 52 | 555234 | 1734.45 | 1317 | 1282 | 319.4 |
| D | 13 | 104 | 415005 | 1295.39 | 1317 | 1282 | 319.4 |
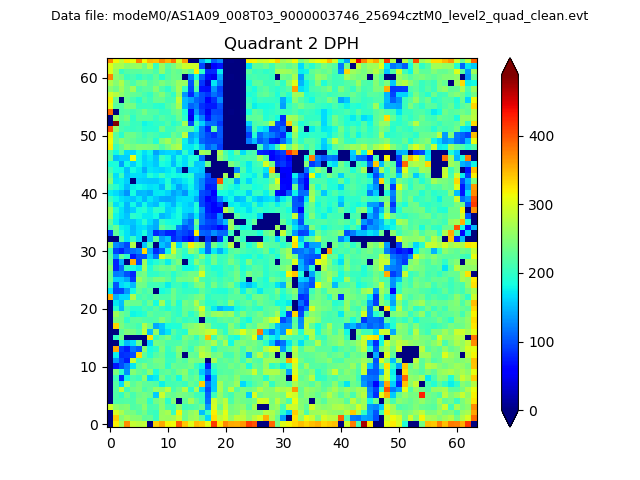
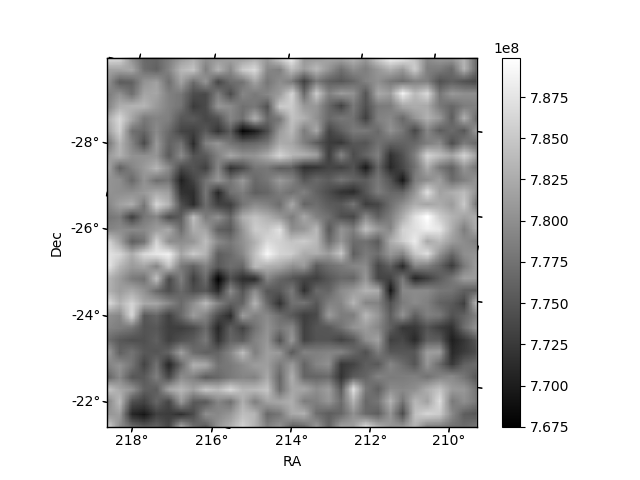
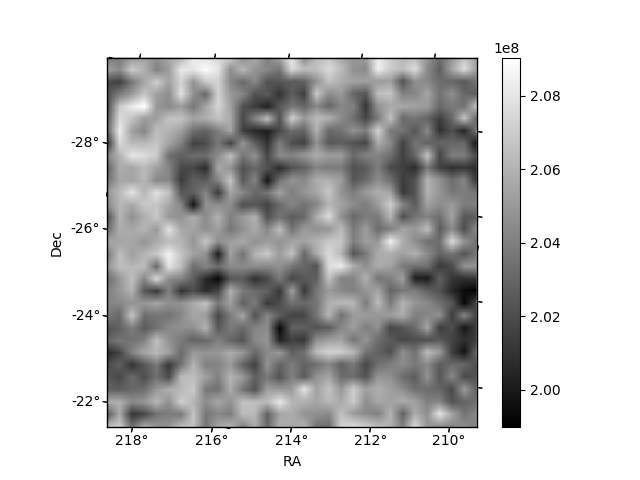
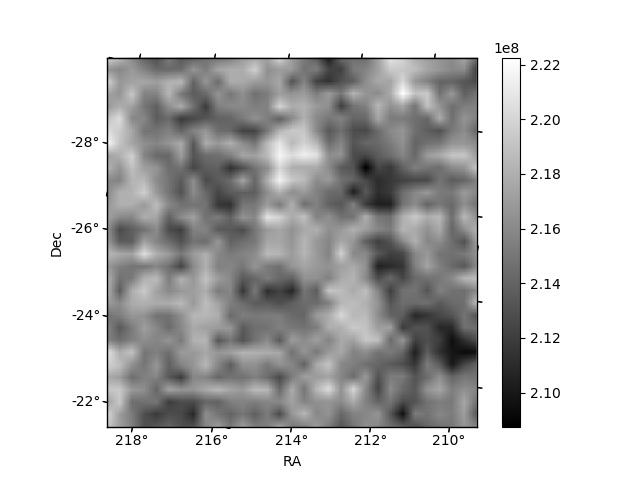
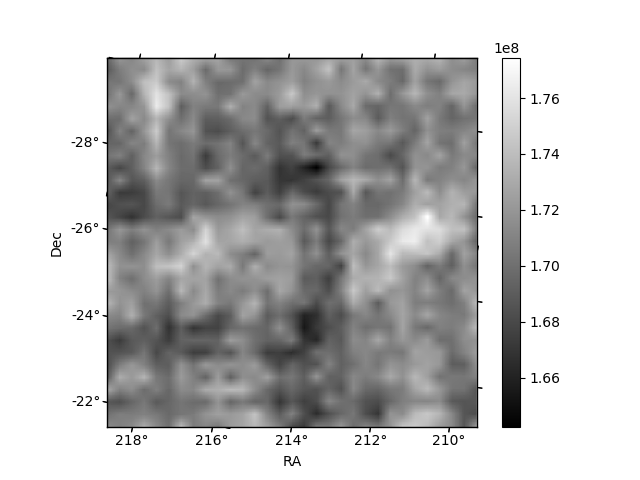
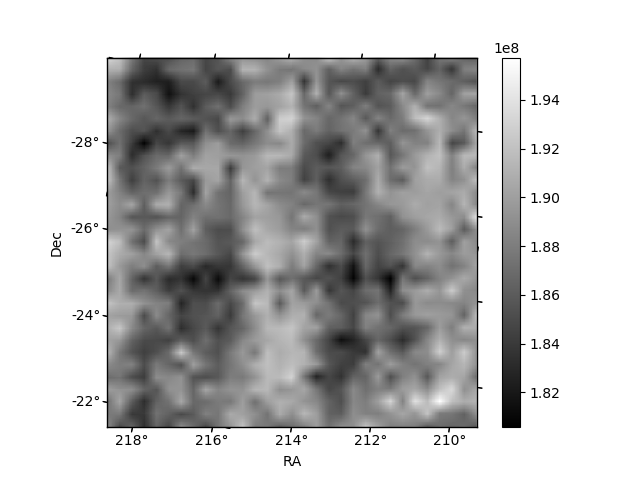
Histogram calculated using DETX and DETY for each event in the final _common_clean file
| Quadrant A | 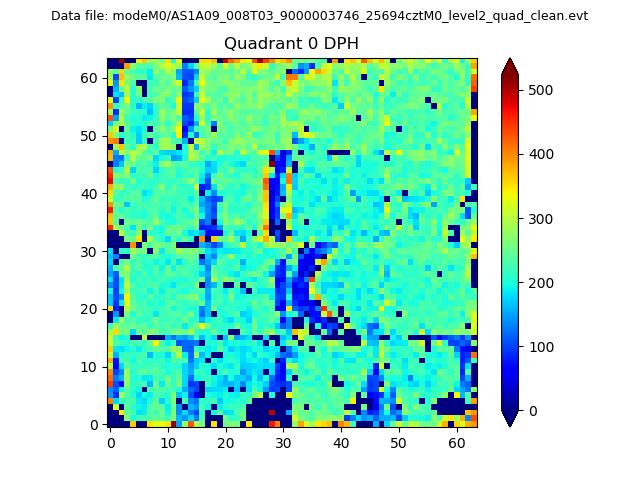 |
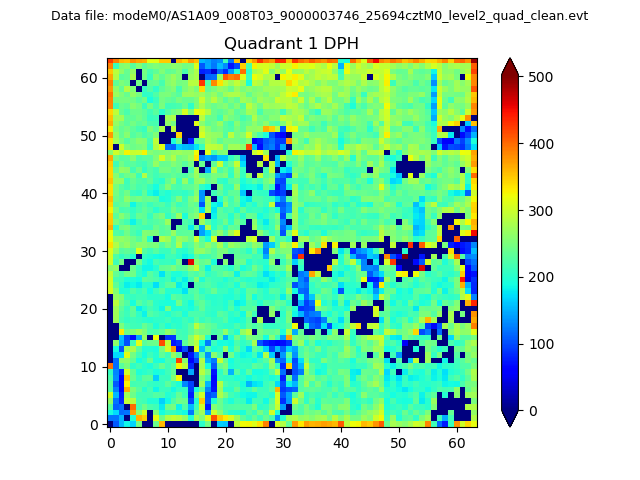 |
Quadrant B |
|---|---|---|---|
| Quadrant D | 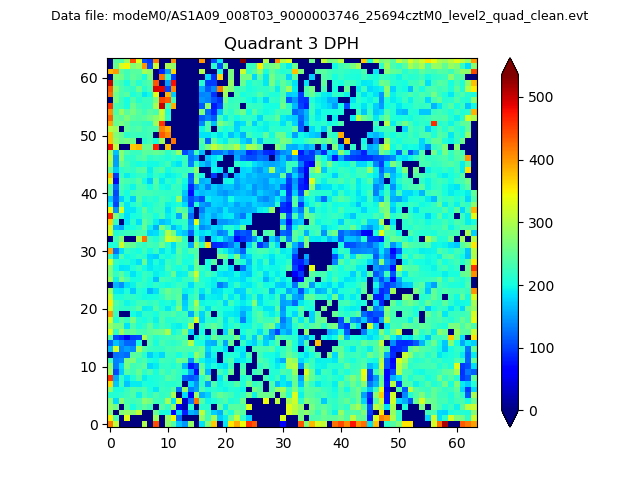 |
 |
Quadrant C |
| Plot type | Count rate plots | Images |
|---|---|---|
| Comparison with Poisson distribution Blue bars denote a histogram of data divided into 1 sec bins. Red curve is a Poisson curve with rate = median count rate of data. |
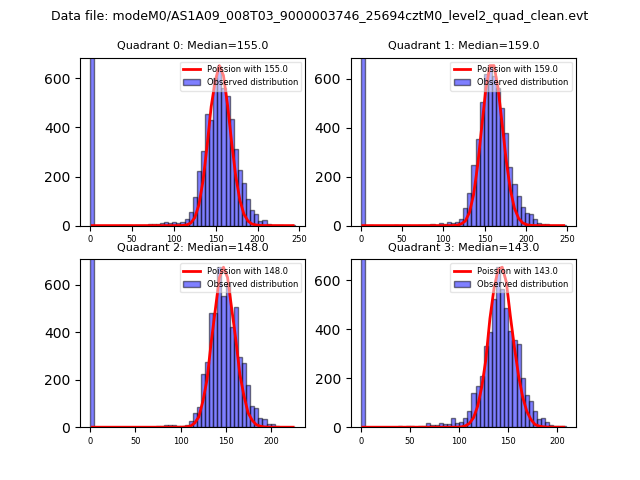 |
 |
| Quadrant-wise count rates Data is divided into 100 sec bins |
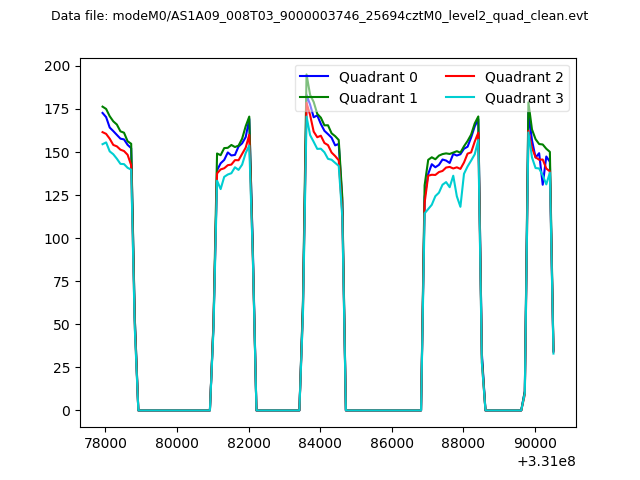 |
|
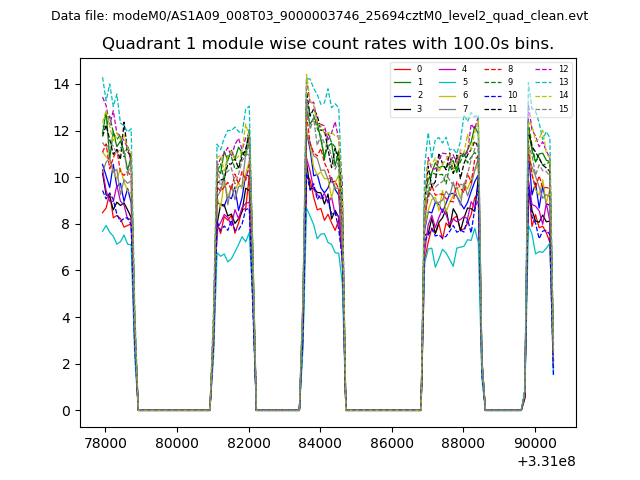
| Module-wise count rates for Quadrant A Data is divided into 100 sec bins |
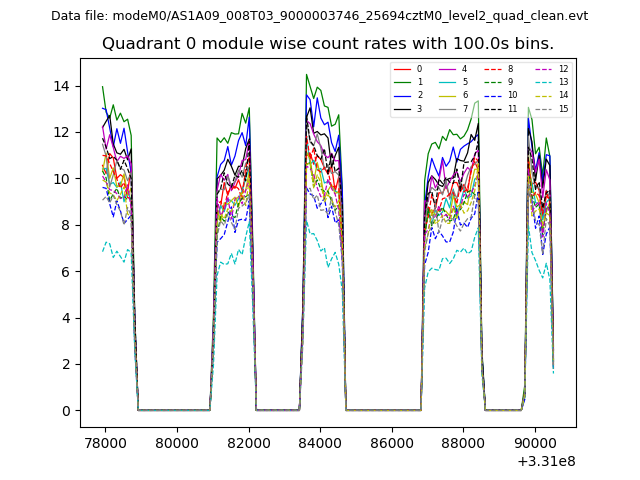 |
 |
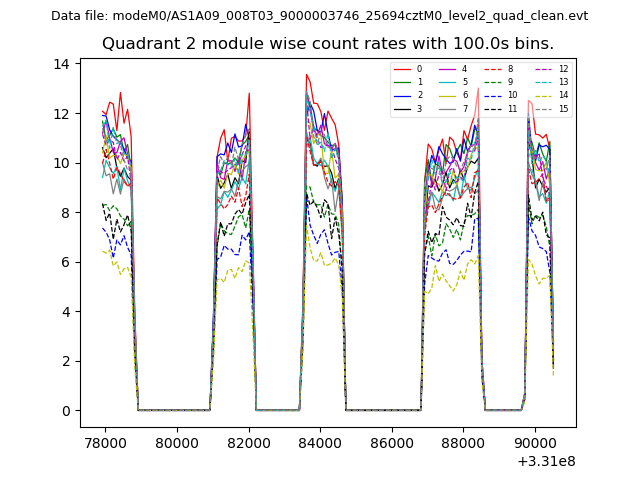
| Module-wise count rates for Quadrant B Data is divided into 100 sec bins |
 |
 |
| Module-wise count rates for Quadrant C Data is divided into 100 sec bins |
 |
 |
| Module-wise count rates for Quadrant D Data is divided into 100 sec bins |
 |
 |
| Parameter | Plot |
|---|---|
| CZT HV Monitor | 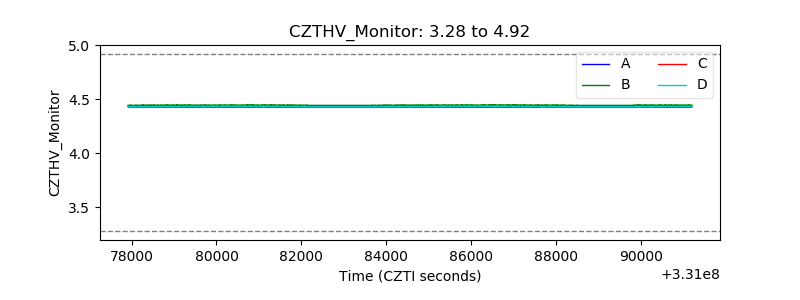 |
| D_VDD | 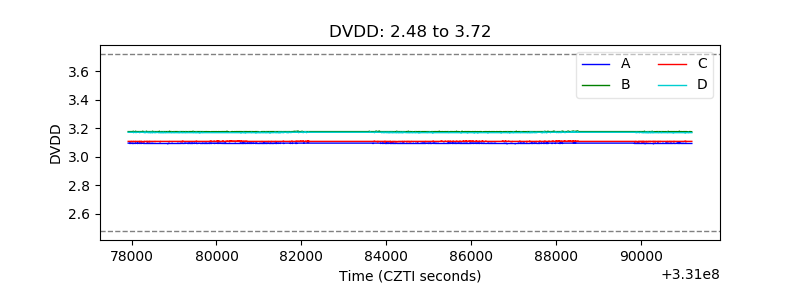 |
| Temperature 1 | 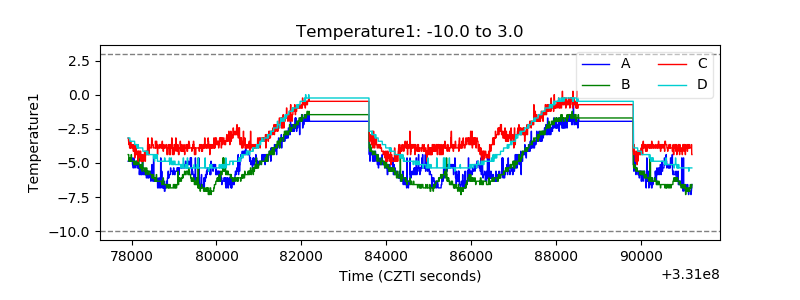 |
| Veto HV Monitor | 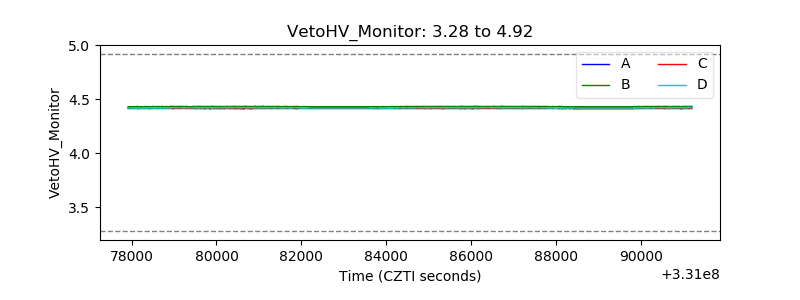 |
| Veto LLD | 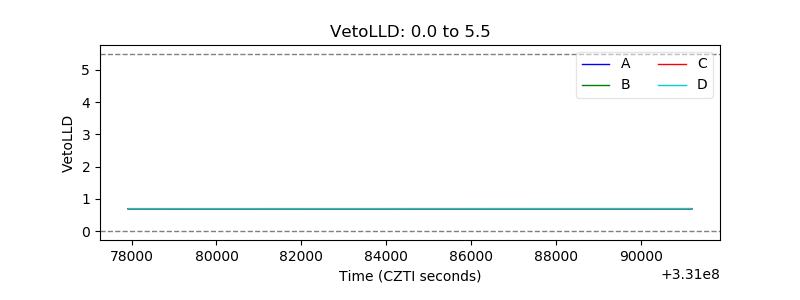 |
| Alpha Counter | 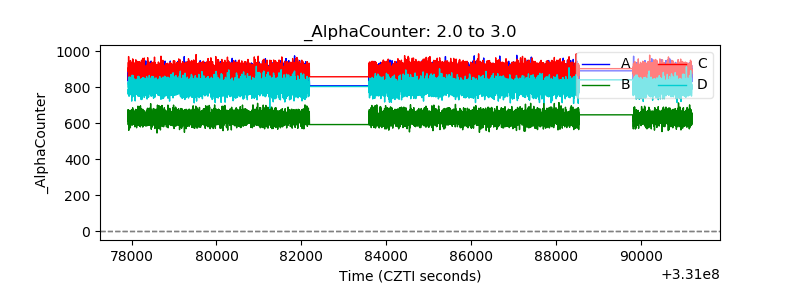 |
| _CPM_Rate |  |
| CZT Counter | 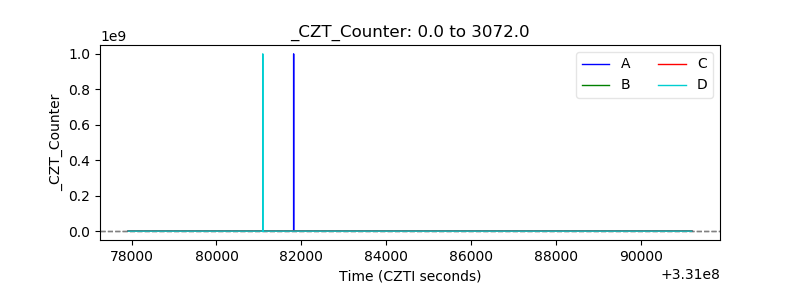 |
| +2.5 Volts monitor |  |
| +5 Volts monitor |  |
| _ROLL_ROT | 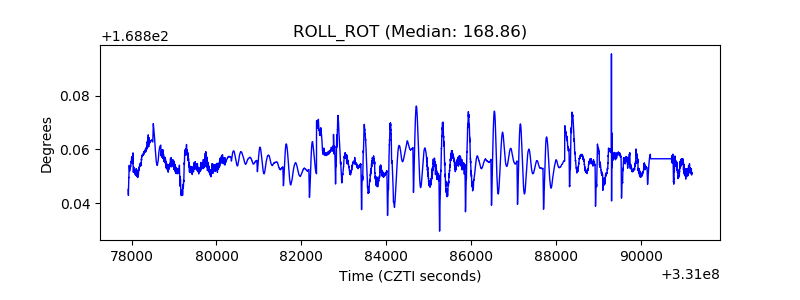 |
| _Roll_DEC | 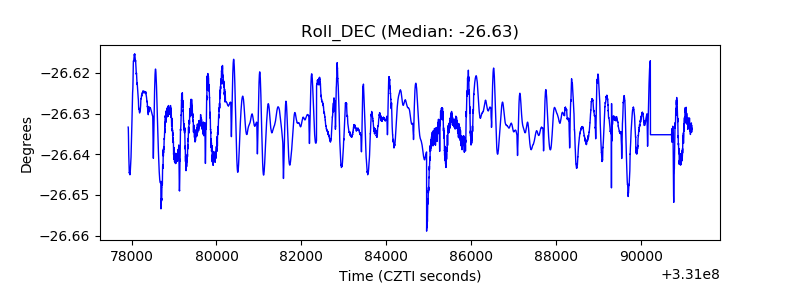 |
| _Roll_RA | 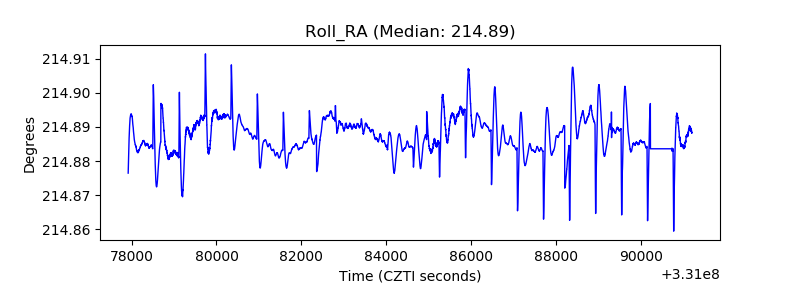 |
| Veto Counter |  |