| Param | Original file | Final file |
|---|---|---|
| Filename | modeM0/AS1A09_008T03_9000003746_25695cztM0_level2.evt | modeM0/AS1A09_008T03_9000003746_25695cztM0_level2_quad_clean.evt |
| Size (bytes) | 596,652,480 | 77,719,680 |
| Size | 569.0 MB | 74.1 MB |
| Events in quadrant A | 6,282,273 | 394,087 |
| Events in quadrant B | 3,431,382 | 526,289 |
| Events in quadrant C | 3,365,250 | 492,748 |
| Events in quadrant D | 4,538,073 | 474,004 |
| Mode M9 | |||
|---|---|---|---|
| Quadrant | BADHDUFLAG | Total packets | Discarded packets |
| A | 0 | 23 | 0 |
| B | 0 | 23 | 0 |
| C | 0 | 23 | 0 |
| D | 0 | 23 | 0 |
| Mode M0 | |||
|---|---|---|---|
| Quadrant | BADHDUFLAG | Total packets | Discarded packets |
| A | 0 | 23028 | 0 |
| B | 0 | 14116 | 0 |
| C | 0 | 13957 | 0 |
| D | 0 | 17791 | 0 |
| Quadrant | Total seconds | Saturated seconds | Saturation percentage |
|---|---|---|---|
| A | 6677 | 1209 | 18.106934% |
| B | 6678 | 87 | 1.302785% |
| C | 6678 | 96 | 1.437556% |
| D | 6678 | 192 | 2.875112% |
Noise dominated data is calculated using 1-second bins in cleaned event files. If a bin has >2000 counts, and if more than 50% of those come from <1% of pixels, then it is considered to be noise-dominated and hence unusable.
| Quadrant | # 1 sec bins | Bins with >0 counts | Bins with >2000 counts | High rate bins dominated by noise | Noise dominated (total time) | Noise dominated (detector-on time) | Marked lightcurve |
|---|---|---|---|---|---|---|---|
| A | 8947 | 6678 | 1059 | 1059 | 11.84% | 15.86% | 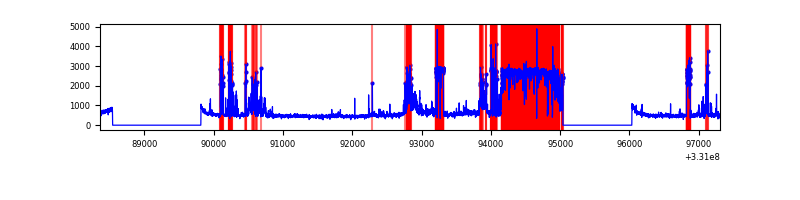 |
| B | 8948 | 6680 | 1 | 1 | 0.01% | 0.01% | 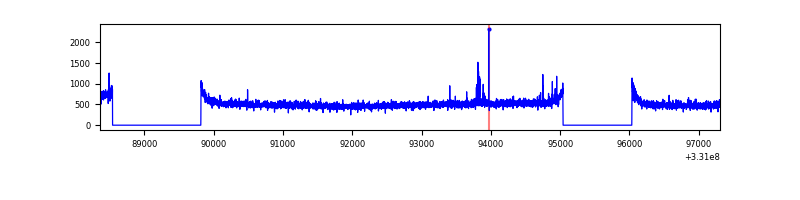 |
| C | 8948 | 6679 | 0 | 0 | 0.00% | 0.00% | 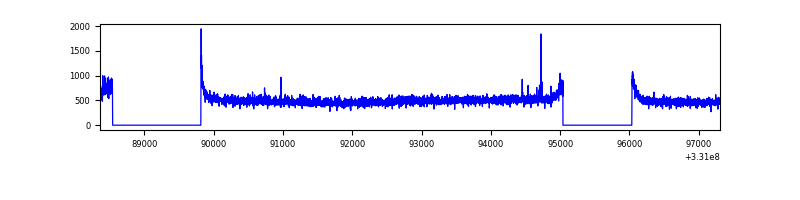 |
| D | 8948 | 6680 | 151 | 151 | 1.69% | 2.26% | 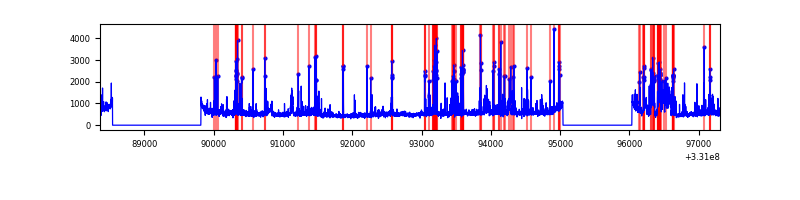 |
Top three noisy pixels from each quadrant. If the there are fewer than three noisy pixels in the level2.evt file, extra rows are filled as -1
| Pixel properties | Quadrant properties | ||||||
|---|---|---|---|---|---|---|---|
| Quadrant | DetID | PixID | Counts | Sigma | Mean | Median | Sigma |
| A | 0 | 13 | 3363591 | 22083.7 | 757 | 745 | 152.3 |
| A | 13 | 254 | 7905 | 47.02 | 757 | 745 | 152.3 |
| A | 3 | 137 | 6906 | 40.46 | 757 | 745 | 152.3 |
| B | 0 | 219 | 23018 | 135.06 | 861 | 839 | 164.2 |
| B | 0 | 245 | 22510 | 131.96 | 861 | 839 | 164.2 |
| B | 12 | 111 | 19847 | 115.75 | 861 | 839 | 164.2 |
| C | 14 | 238 | 132166 | 679.42 | 822 | 827 | 193.3 |
| C | 3 | 233 | 25723 | 128.79 | 822 | 827 | 193.3 |
| C | 0 | 10 | 7480 | 34.42 | 822 | 827 | 193.3 |
| D | 7 | 80 | 567943 | 2816.91 | 822 | 798 | 201.3 |
| D | 1 | 52 | 514293 | 2550.44 | 822 | 798 | 201.3 |
| D | 8 | 195 | 226578 | 1121.41 | 822 | 798 | 201.3 |
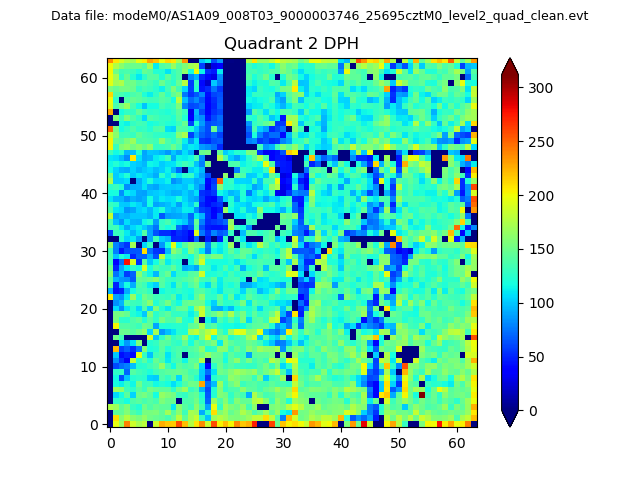
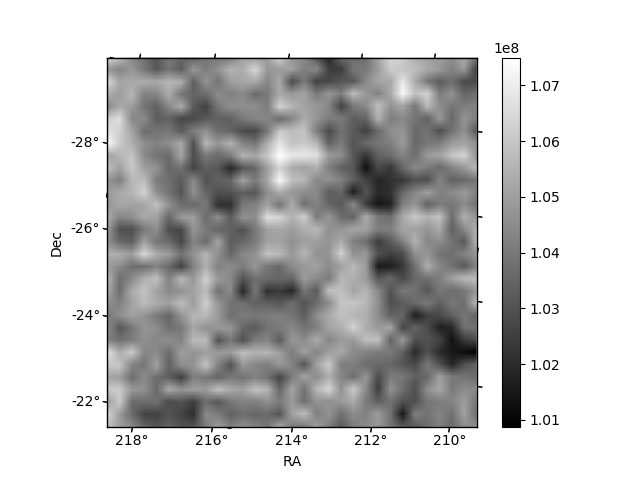
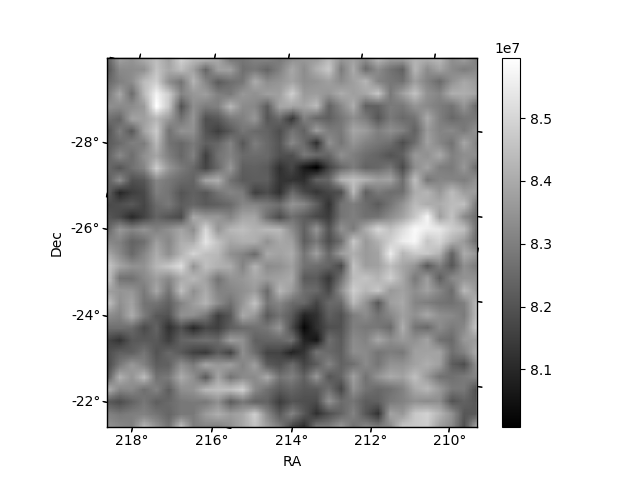
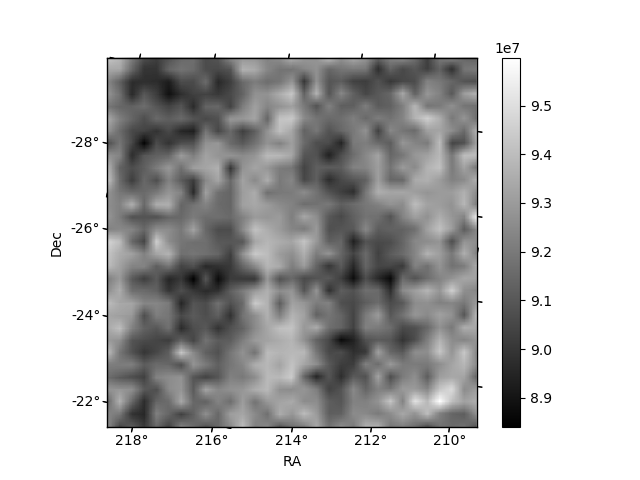
Histogram calculated using DETX and DETY for each event in the final _common_clean file
| Quadrant A | 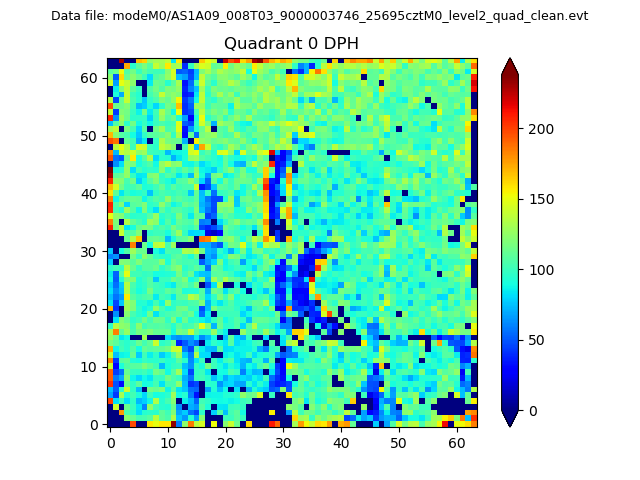 |
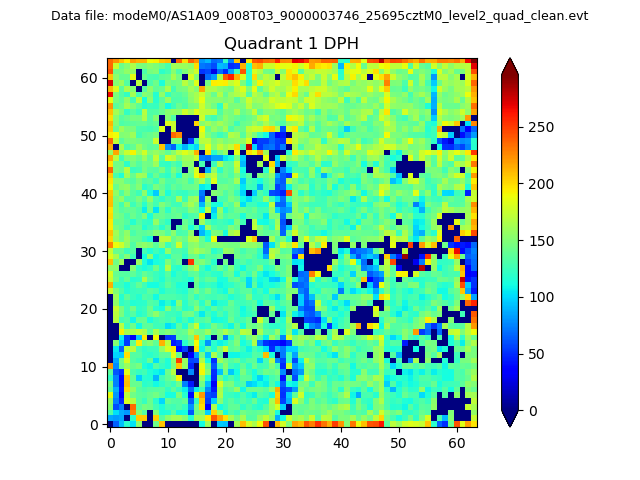 |
Quadrant B |
|---|---|---|---|
| Quadrant D | 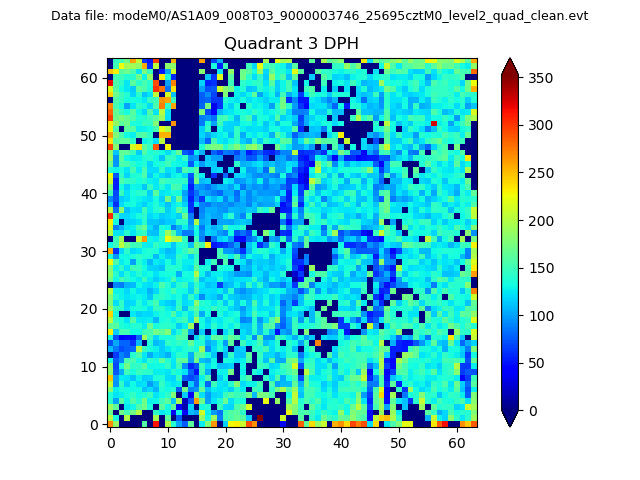 |
 |
Quadrant C |
| Plot type | Count rate plots | Images |
|---|---|---|
| Comparison with Poisson distribution Blue bars denote a histogram of data divided into 1 sec bins. Red curve is a Poisson curve with rate = median count rate of data. |
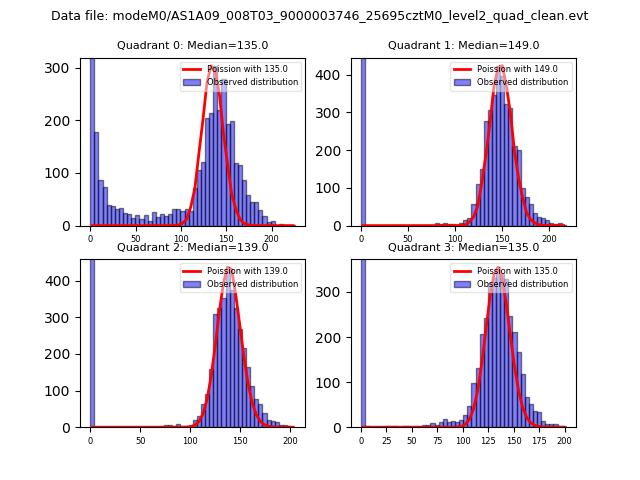 |
 |
| Quadrant-wise count rates Data is divided into 100 sec bins |
 |
|
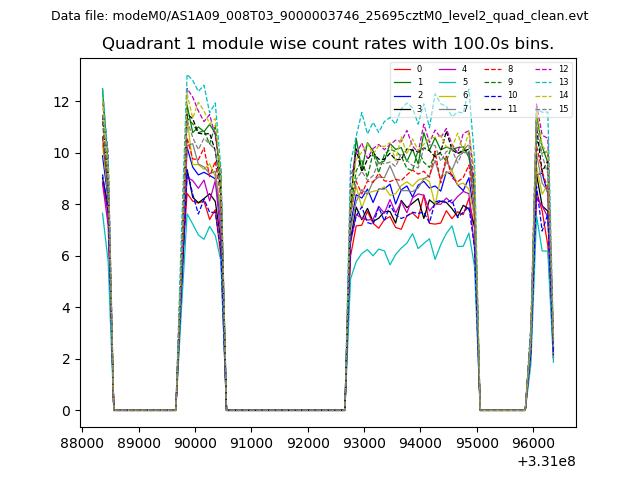
| Module-wise count rates for Quadrant A Data is divided into 100 sec bins |
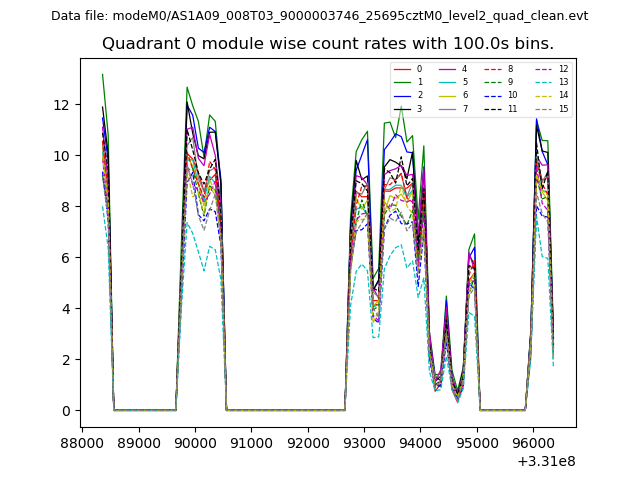 |
 |
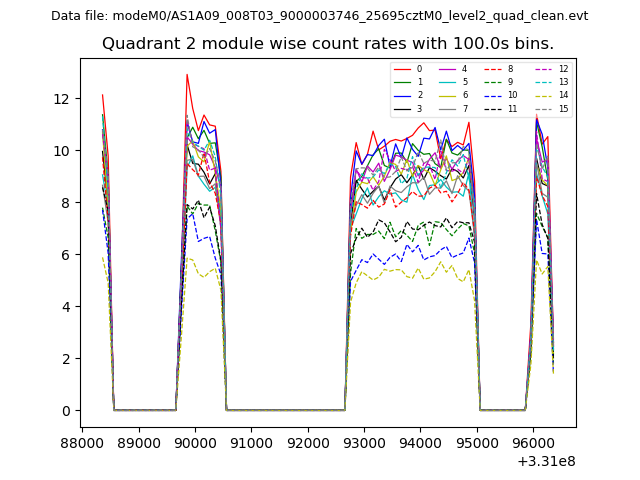
| Module-wise count rates for Quadrant B Data is divided into 100 sec bins |
 |
 |
| Module-wise count rates for Quadrant C Data is divided into 100 sec bins |
 |
 |
| Module-wise count rates for Quadrant D Data is divided into 100 sec bins |
 |
 |
| Parameter | Plot |
|---|---|
| CZT HV Monitor | 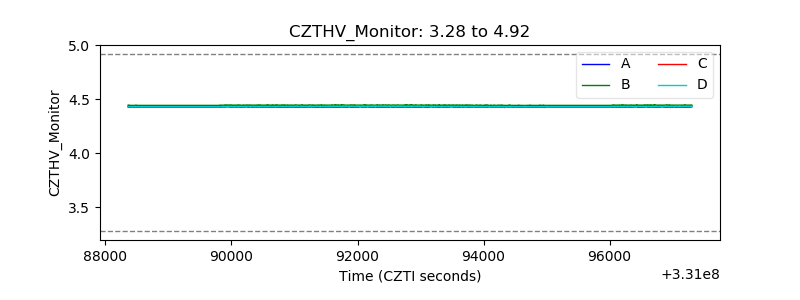 |
| D_VDD | 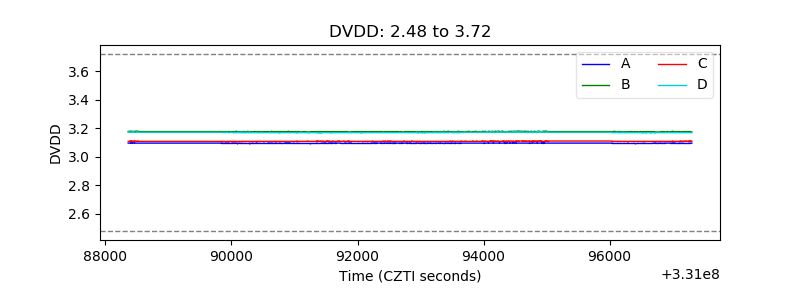 |
| Temperature 1 | 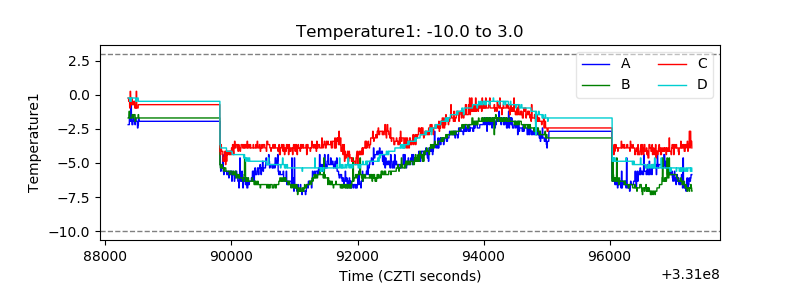 |
| Veto HV Monitor | 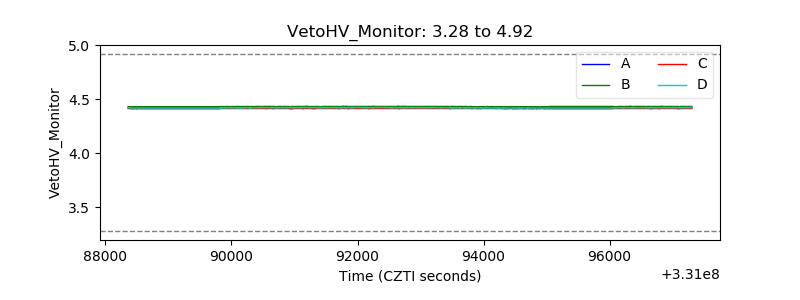 |
| Veto LLD | 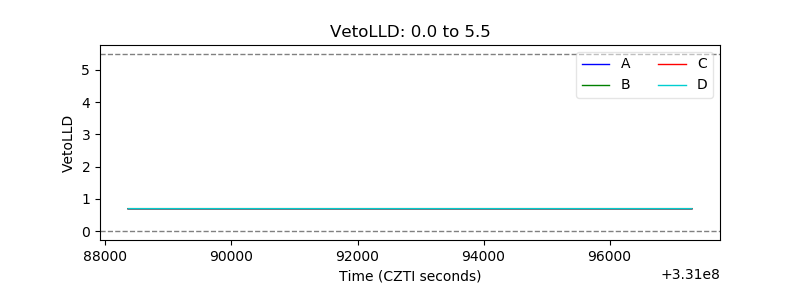 |
| Alpha Counter | 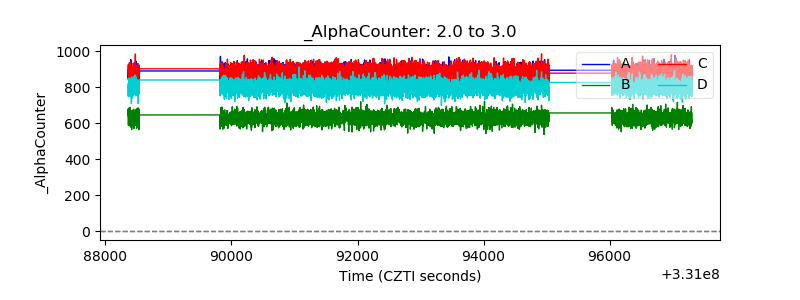 |
| _CPM_Rate | 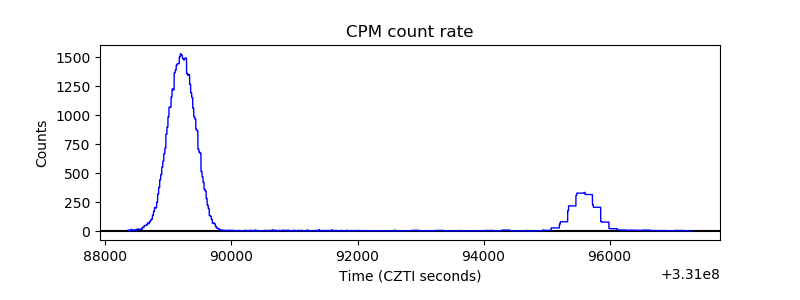 |
| CZT Counter | 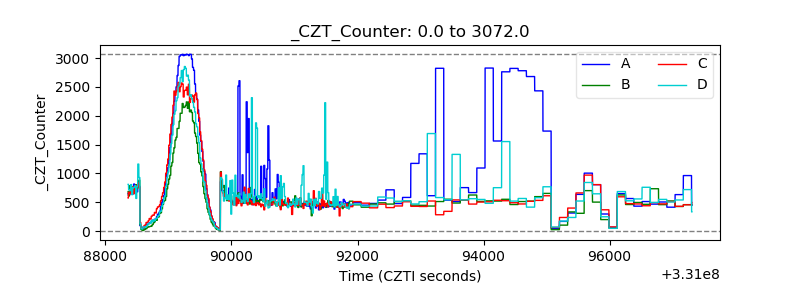 |
| +2.5 Volts monitor | 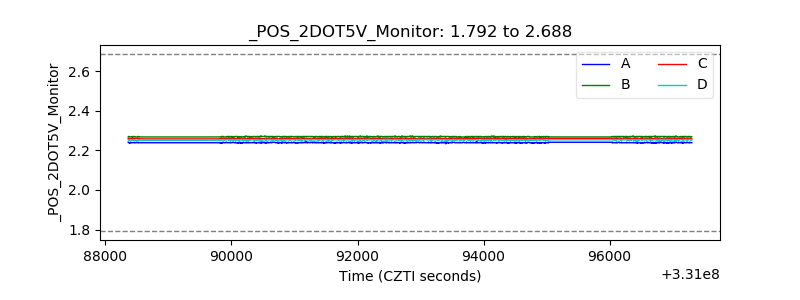 |
| +5 Volts monitor |  |
| _ROLL_ROT | 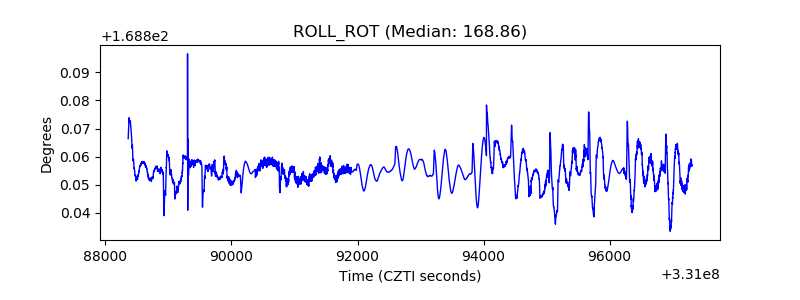 |
| _Roll_DEC | 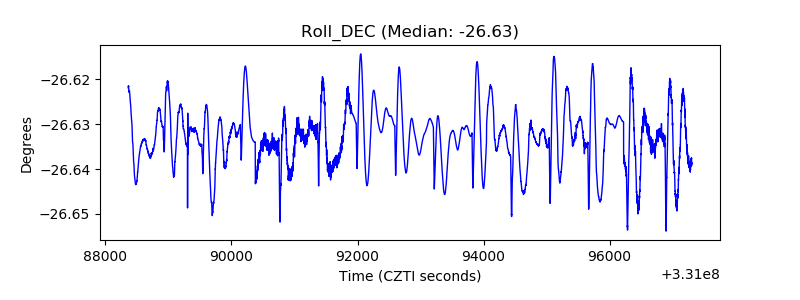 |
| _Roll_RA | 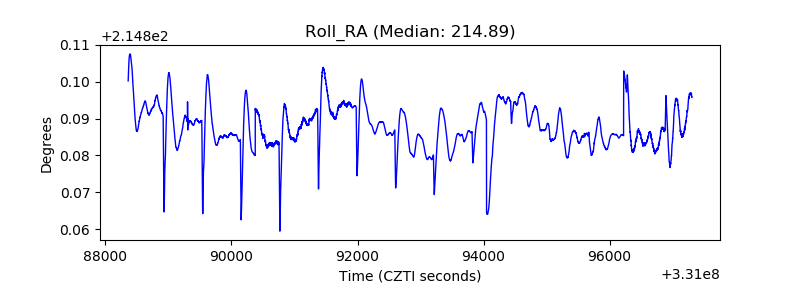 |
| Veto Counter | 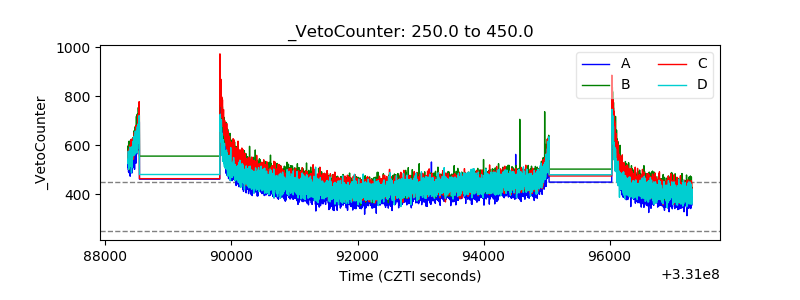 |