| Param | Original file | Final file |
|---|---|---|
| Filename | modeM0/AS1A09_008T03_9000003746_25696cztM0_level2.evt | modeM0/AS1A09_008T03_9000003746_25696cztM0_level2_quad_clean.evt |
| Size (bytes) | 558,316,800 | 77,022,720 |
| Size | 532.5 MB | 73.5 MB |
| Events in quadrant A | 4,382,557 | 465,306 |
| Events in quadrant B | 3,728,685 | 474,306 |
| Events in quadrant C | 3,548,194 | 447,414 |
| Events in quadrant D | 4,754,865 | 437,827 |
| Mode M9 | |||
|---|---|---|---|
| Quadrant | BADHDUFLAG | Total packets | Discarded packets |
| A | 0 | 6 | 0 |
| B | 0 | 7 | 0 |
| C | 0 | 7 | 0 |
| D | 0 | 7 | 0 |
| Mode M0 | |||
|---|---|---|---|
| Quadrant | BADHDUFLAG | Total packets | Discarded packets |
| A | 0 | 17642 | 0 |
| B | 0 | 15497 | 0 |
| C | 0 | 15053 | 0 |
| D | 0 | 18744 | 0 |
| Quadrant | Total seconds | Saturated seconds | Saturation percentage |
|---|---|---|---|
| A | 7288 | 195 | 2.675631% |
| B | 7287 | 171 | 2.346645% |
| C | 7287 | 140 | 1.921230% |
| D | 7287 | 168 | 2.305476% |
Noise dominated data is calculated using 1-second bins in cleaned event files. If a bin has >2000 counts, and if more than 50% of those come from <1% of pixels, then it is considered to be noise-dominated and hence unusable.
| Quadrant | # 1 sec bins | Bins with >0 counts | Bins with >2000 counts | High rate bins dominated by noise | Noise dominated (total time) | Noise dominated (detector-on time) | Marked lightcurve |
|---|---|---|---|---|---|---|---|
| A | 7833 | 7289 | 108 | 108 | 1.38% | 1.48% | 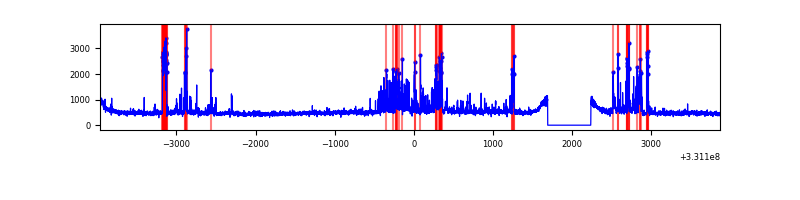 |
| B | 7832 | 7288 | 36 | 36 | 0.46% | 0.49% | 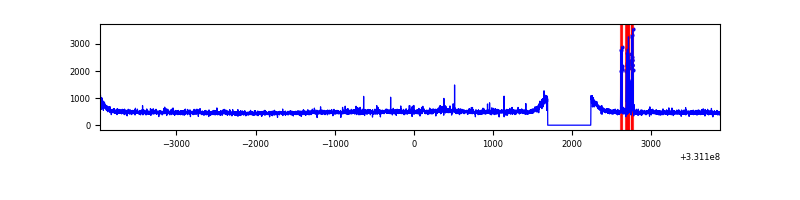 |
| C | 7832 | 7288 | 0 | 0 | 0.00% | 0.00% | 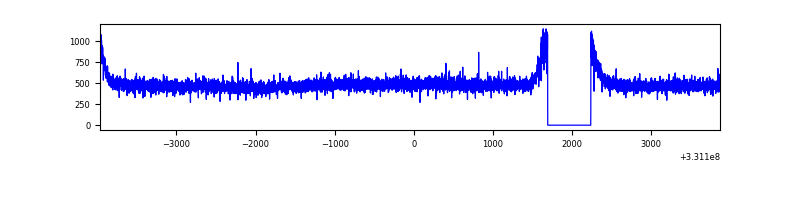 |
| D | 7832 | 7288 | 126 | 126 | 1.61% | 1.73% | 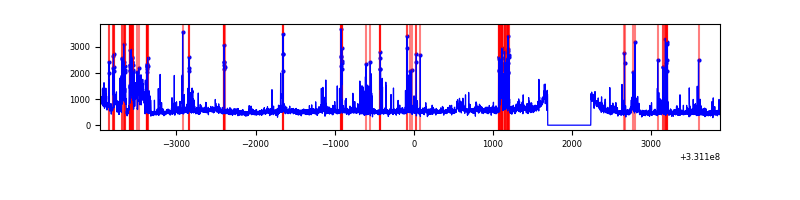 |
Top three noisy pixels from each quadrant. If the there are fewer than three noisy pixels in the level2.evt file, extra rows are filled as -1
| Pixel properties | Quadrant properties | ||||||
|---|---|---|---|---|---|---|---|
| Quadrant | DetID | PixID | Counts | Sigma | Mean | Median | Sigma |
| A | 0 | 13 | 882847 | 4788.78 | 908 | 889 | 184.2 |
| A | 13 | 254 | 9843 | 48.62 | 908 | 889 | 184.2 |
| A | 3 | 137 | 8538 | 41.53 | 908 | 889 | 184.2 |
| B | 4 | 171 | 123003 | 696.35 | 909 | 886 | 175.4 |
| B | 0 | 219 | 26961 | 148.69 | 909 | 886 | 175.4 |
| B | 12 | 111 | 22223 | 121.67 | 909 | 886 | 175.4 |
| C | 14 | 238 | 138990 | 665.97 | 871 | 876 | 207.4 |
| C | 3 | 233 | 17217 | 78.79 | 871 | 876 | 207.4 |
| C | 13 | 61 | 5948 | 24.46 | 871 | 876 | 207.4 |
| D | 1 | 52 | 656379 | 3062.47 | 876 | 853 | 214.1 |
| D | 7 | 80 | 429600 | 2003.01 | 876 | 853 | 214.1 |
| D | 8 | 195 | 233405 | 1086.43 | 876 | 853 | 214.1 |
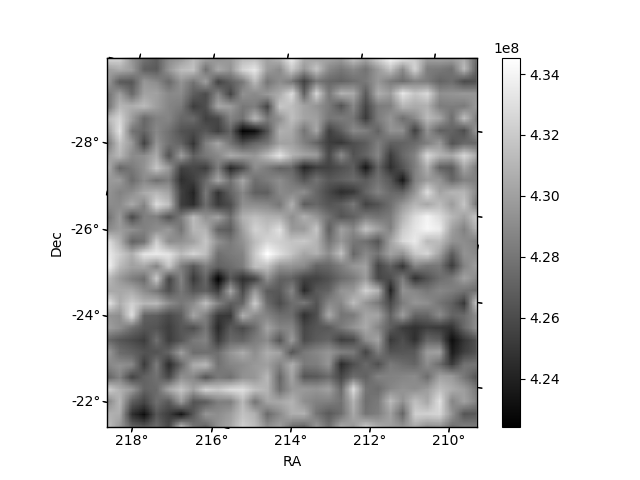
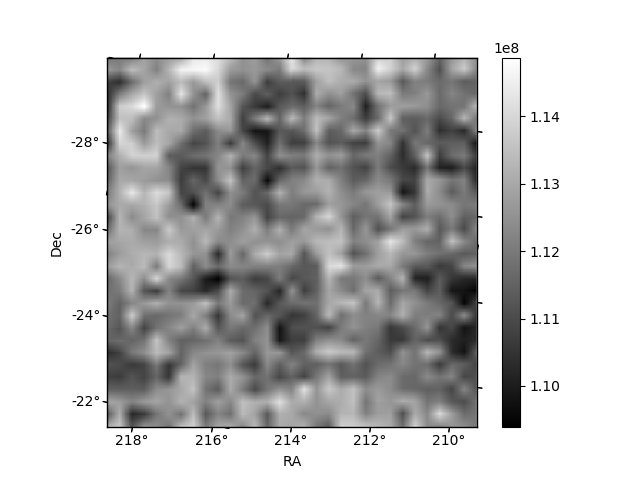
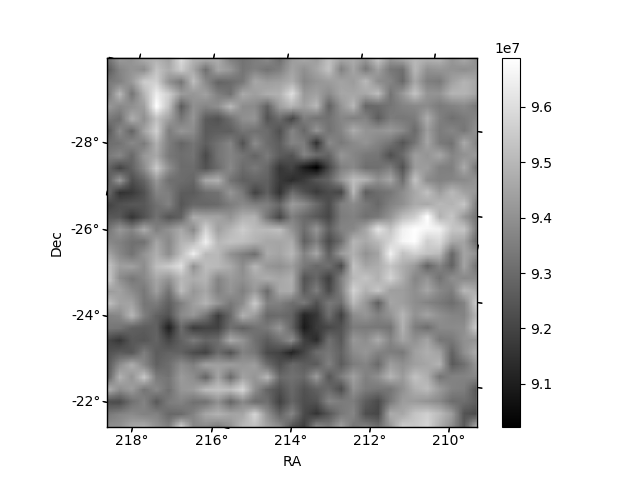
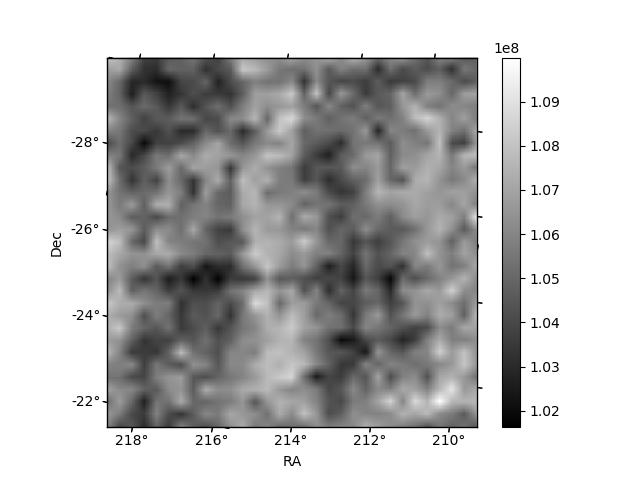
Histogram calculated using DETX and DETY for each event in the final _common_clean file
| Quadrant A | 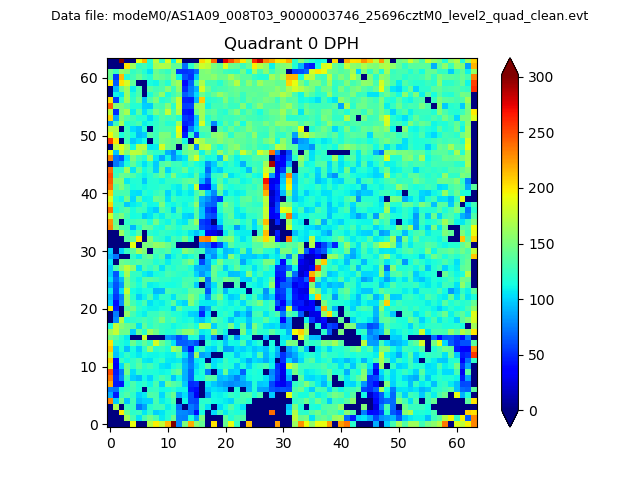 |
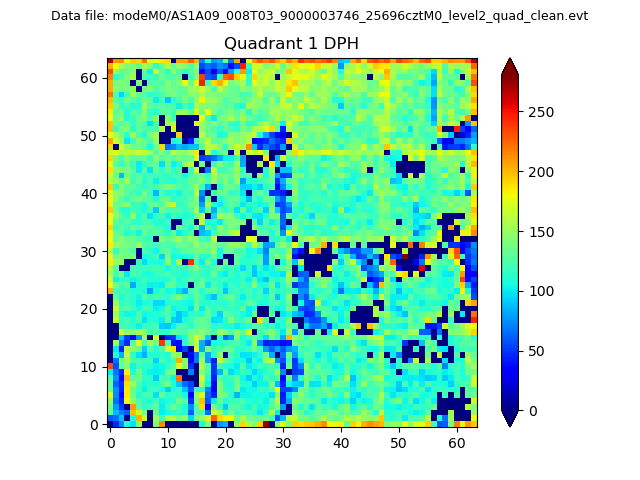 |
Quadrant B |
|---|---|---|---|
| Quadrant D | 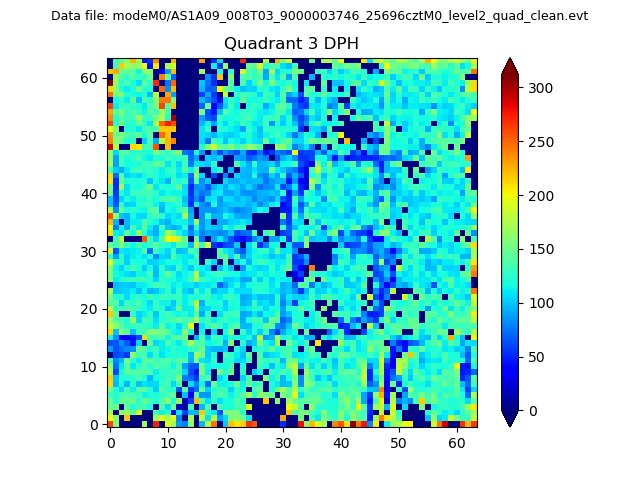 |
 |
Quadrant C |
| Plot type | Count rate plots | Images |
|---|---|---|
| Comparison with Poisson distribution Blue bars denote a histogram of data divided into 1 sec bins. Red curve is a Poisson curve with rate = median count rate of data. |
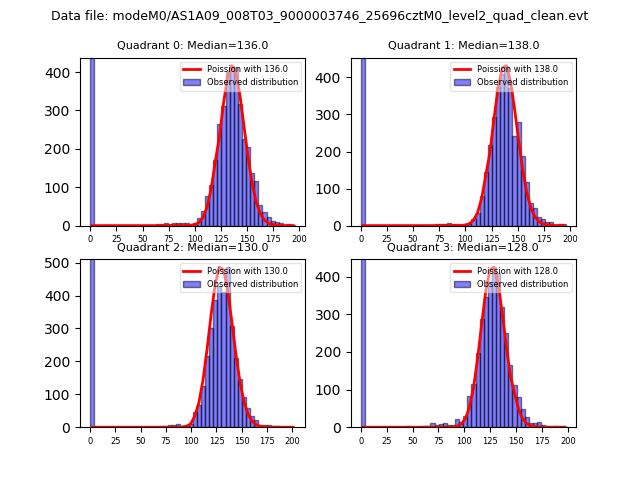 |
 |
| Quadrant-wise count rates Data is divided into 100 sec bins |
 |
|
| Module-wise count rates for Quadrant A Data is divided into 100 sec bins |
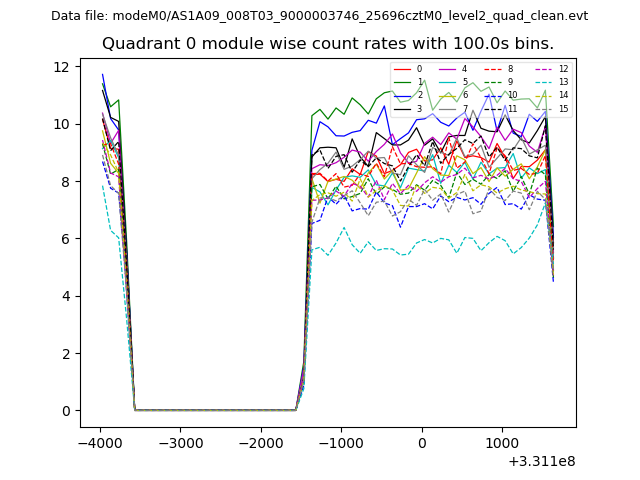 |
 |
| Module-wise count rates for Quadrant B Data is divided into 100 sec bins |
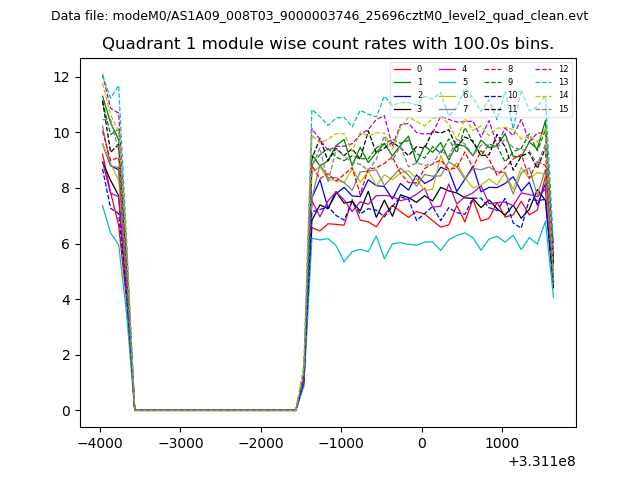 |
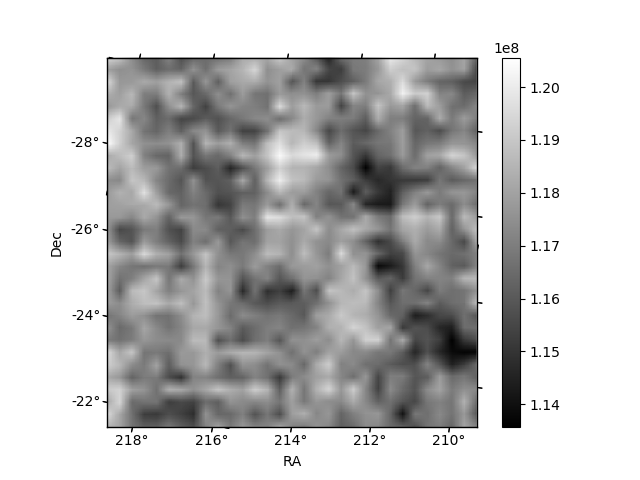 |
| Module-wise count rates for Quadrant C Data is divided into 100 sec bins |
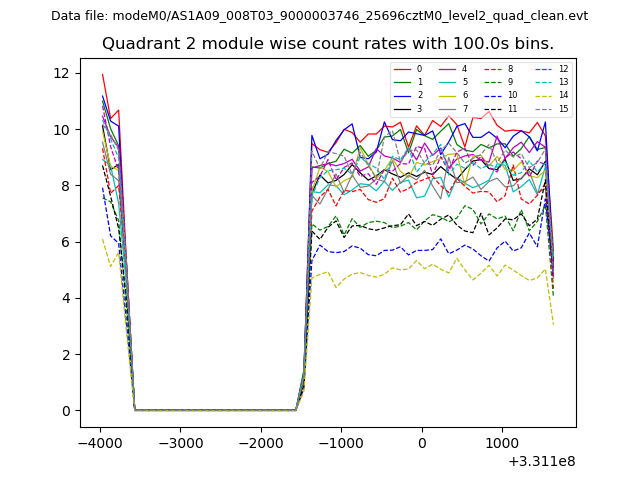 |
 |
| Module-wise count rates for Quadrant D Data is divided into 100 sec bins |
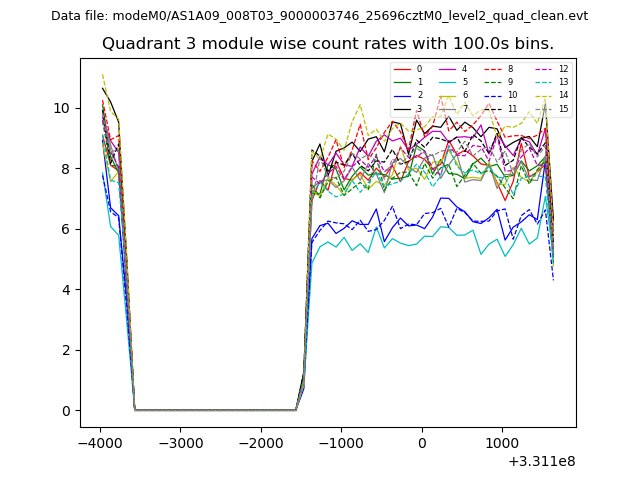 |
 |
| Parameter | Plot |
|---|---|
| CZT HV Monitor | 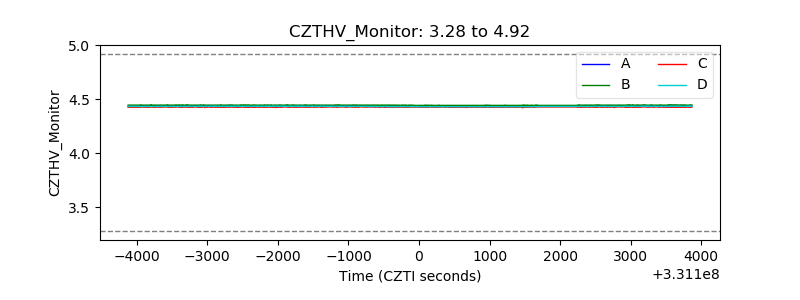 |
| D_VDD | 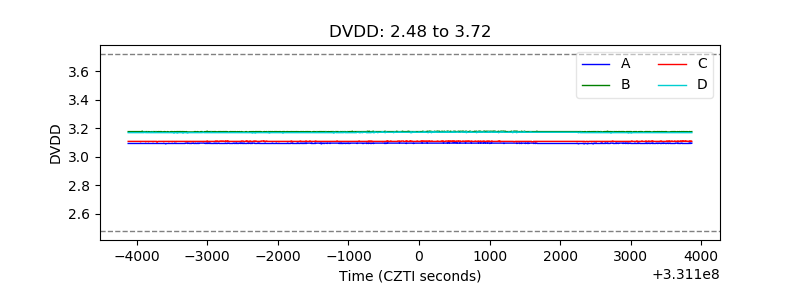 |
| Temperature 1 | 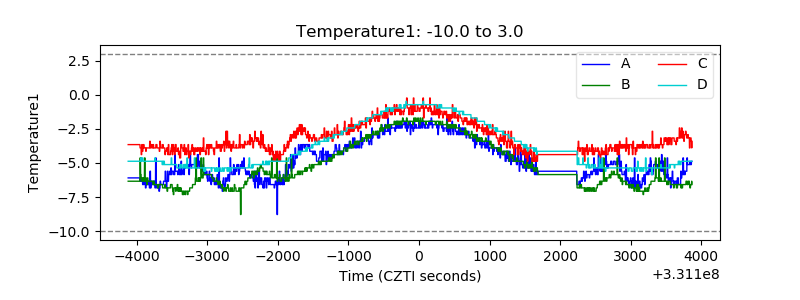 |
| Veto HV Monitor | 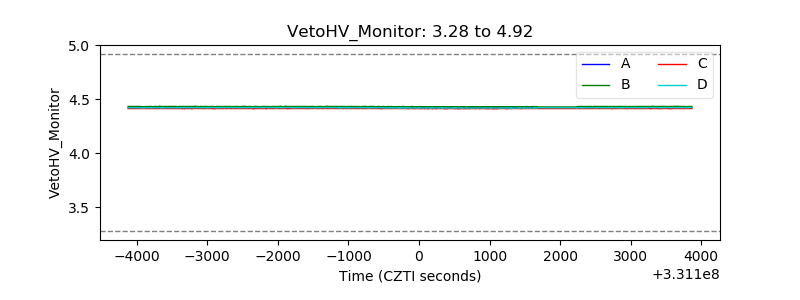 |
| Veto LLD | 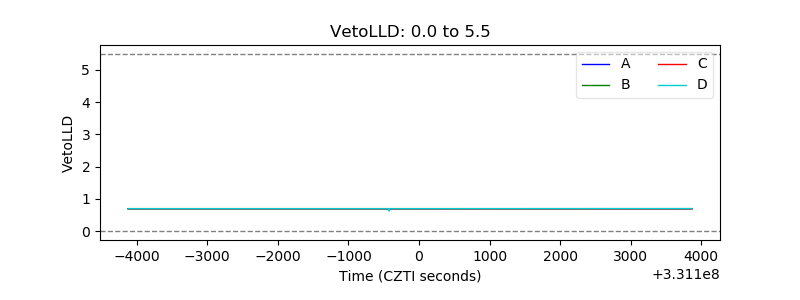 |
| Alpha Counter | 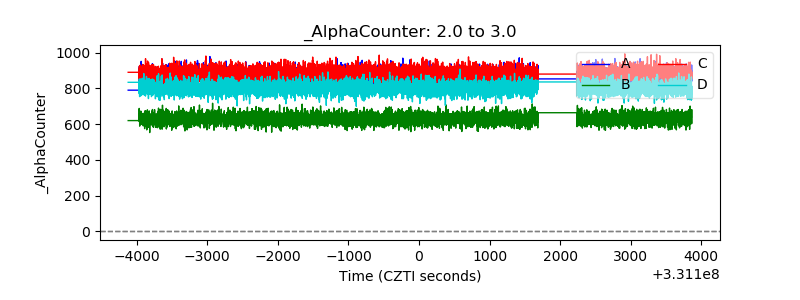 |
| _CPM_Rate | 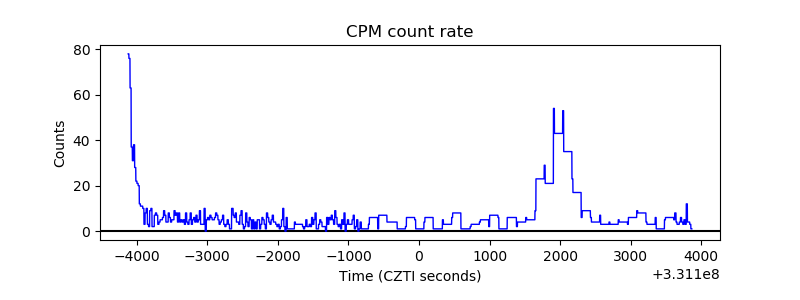 |
| CZT Counter | 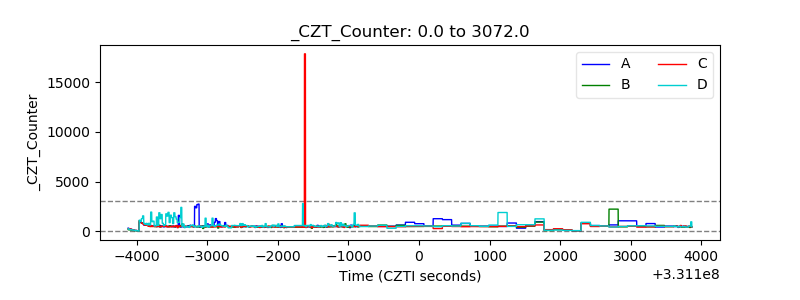 |
| +2.5 Volts monitor |  |
| +5 Volts monitor |  |
| _ROLL_ROT | 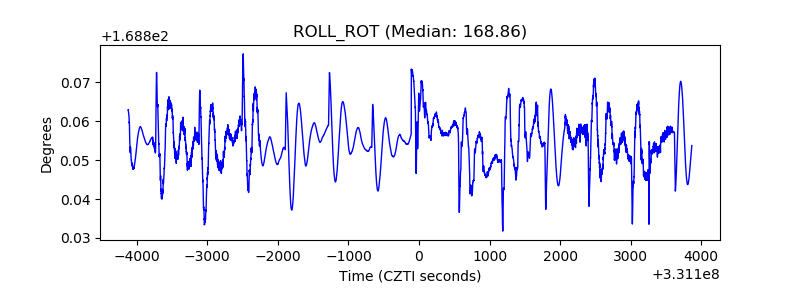 |
| _Roll_DEC | 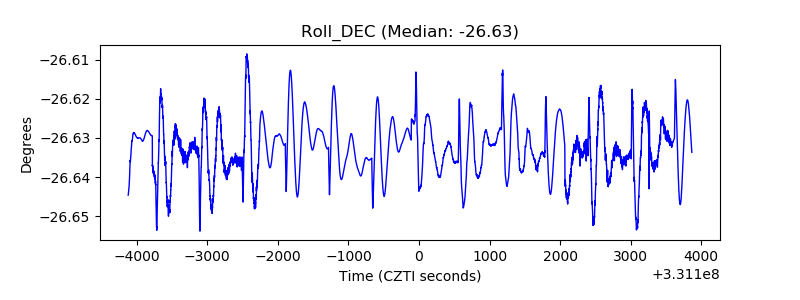 |
| _Roll_RA | 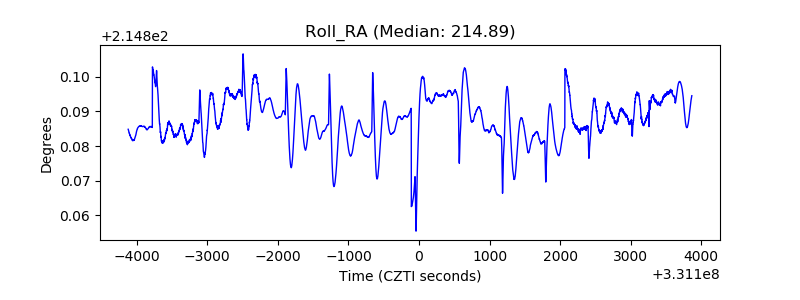 |
| Veto Counter | 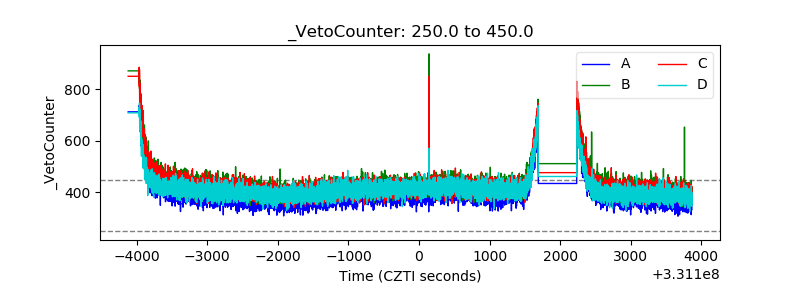 |