| Param | Original file | Final file |
|---|---|---|
| Filename | modeM0/AS1A09_008T03_9000003746_25697cztM0_level2.evt | modeM0/AS1A09_008T03_9000003746_25697cztM0_level2_quad_clean.evt |
| Size (bytes) | 588,945,600 | 80,478,720 |
| Size | 561.7 MB | 76.8 MB |
| Events in quadrant A | 4,554,613 | 481,843 |
| Events in quadrant B | 4,110,341 | 489,747 |
| Events in quadrant C | 3,898,804 | 464,426 |
| Events in quadrant D | 4,738,801 | 454,069 |
| Mode M9 | |||
|---|---|---|---|
| Quadrant | BADHDUFLAG | Total packets | Discarded packets |
| A | 0 | 7 | 0 |
| B | 0 | 7 | 0 |
| C | 0 | 7 | 0 |
| D | 0 | 7 | 0 |
| Mode M0 | |||
|---|---|---|---|
| Quadrant | BADHDUFLAG | Total packets | Discarded packets |
| A | 0 | 18506 | 0 |
| B | 0 | 17059 | 0 |
| C | 0 | 16580 | 0 |
| D | 0 | 19046 | 0 |
| Quadrant | Total seconds | Saturated seconds | Saturation percentage |
|---|---|---|---|
| A | 7868 | 352 | 4.473818% |
| B | 7869 | 363 | 4.613039% |
| C | 7869 | 333 | 4.231796% |
| D | 7869 | 328 | 4.168255% |
Noise dominated data is calculated using 1-second bins in cleaned event files. If a bin has >2000 counts, and if more than 50% of those come from <1% of pixels, then it is considered to be noise-dominated and hence unusable.
| Quadrant | # 1 sec bins | Bins with >0 counts | Bins with >2000 counts | High rate bins dominated by noise | Noise dominated (total time) | Noise dominated (detector-on time) | Marked lightcurve |
|---|---|---|---|---|---|---|---|
| A | 8528 | 7870 | 86 | 86 | 1.01% | 1.09% | 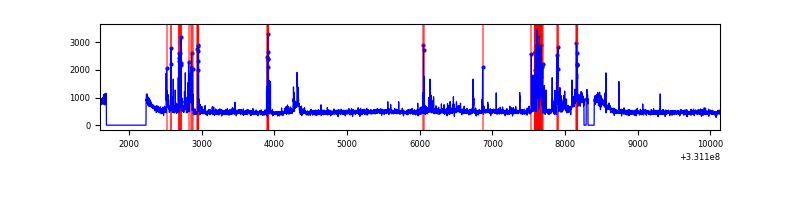 |
| B | 8529 | 7871 | 44 | 44 | 0.52% | 0.56% | 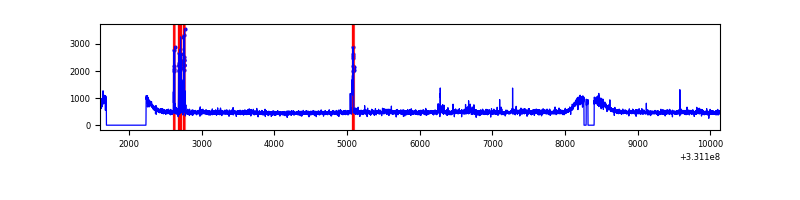 |
| C | 8529 | 7871 | 0 | 0 | 0.00% | 0.00% | 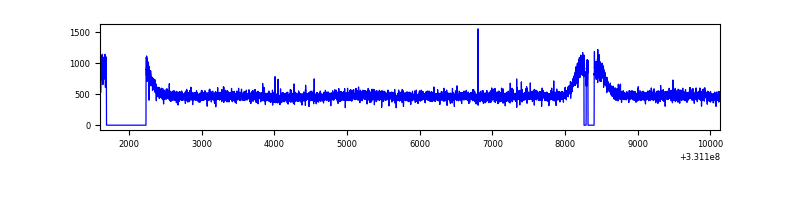 |
| D | 8529 | 7871 | 106 | 106 | 1.24% | 1.35% | 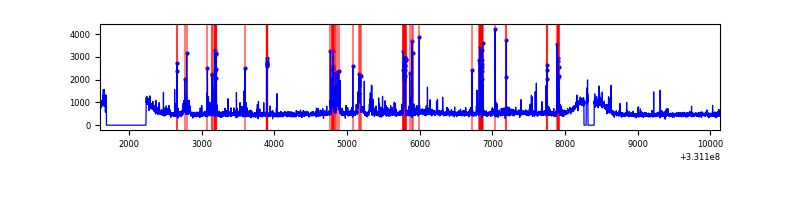 |
Top three noisy pixels from each quadrant. If the there are fewer than three noisy pixels in the level2.evt file, extra rows are filled as -1
| Pixel properties | Quadrant properties | ||||||
|---|---|---|---|---|---|---|---|
| Quadrant | DetID | PixID | Counts | Sigma | Mean | Median | Sigma |
| A | 0 | 13 | 701272 | 3427.53 | 999 | 975 | 204.3 |
| A | 13 | 254 | 10517 | 46.7 | 999 | 975 | 204.3 |
| A | 3 | 137 | 9766 | 43.03 | 999 | 975 | 204.3 |
| B | 4 | 171 | 170182 | 865.95 | 996 | 968 | 195.4 |
| B | 12 | 111 | 24620 | 121.04 | 996 | 968 | 195.4 |
| B | 11 | 111 | 21918 | 107.21 | 996 | 968 | 195.4 |
| C | 14 | 238 | 149851 | 653.02 | 958 | 964 | 228.0 |
| C | 3 | 233 | 16890 | 69.85 | 958 | 964 | 228.0 |
| C | 13 | 61 | 6588 | 24.67 | 958 | 964 | 228.0 |
| D | 8 | 195 | 309403 | 1297.93 | 967 | 938 | 237.7 |
| D | 7 | 80 | 290447 | 1218.17 | 967 | 938 | 237.7 |
| D | 1 | 52 | 280819 | 1177.65 | 967 | 938 | 237.7 |
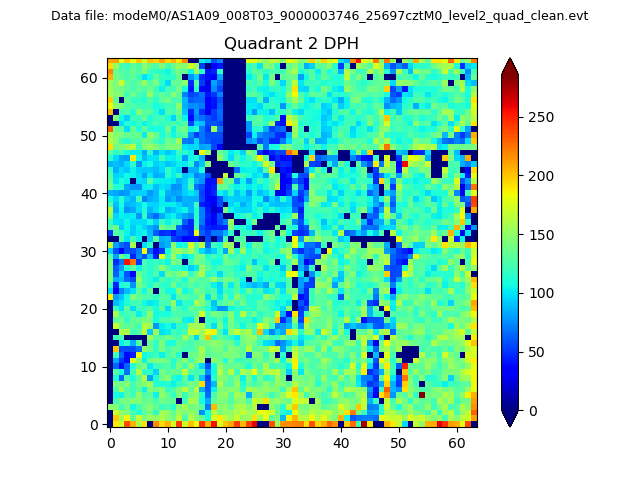
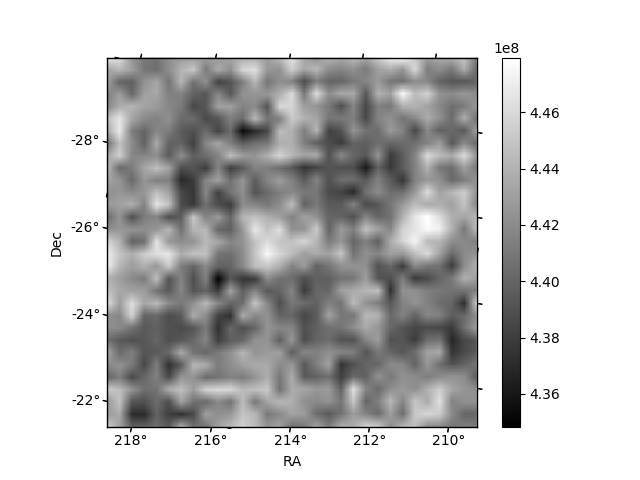
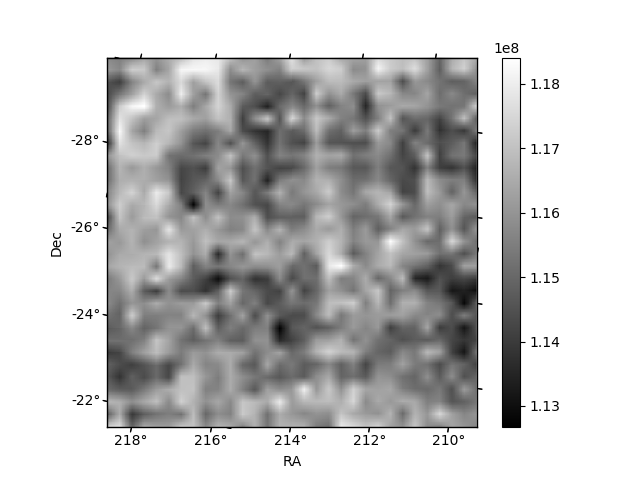
Histogram calculated using DETX and DETY for each event in the final _common_clean file
| Quadrant A | 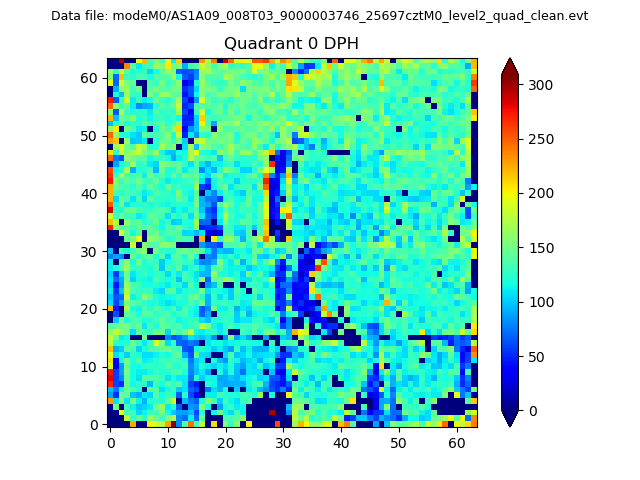 |
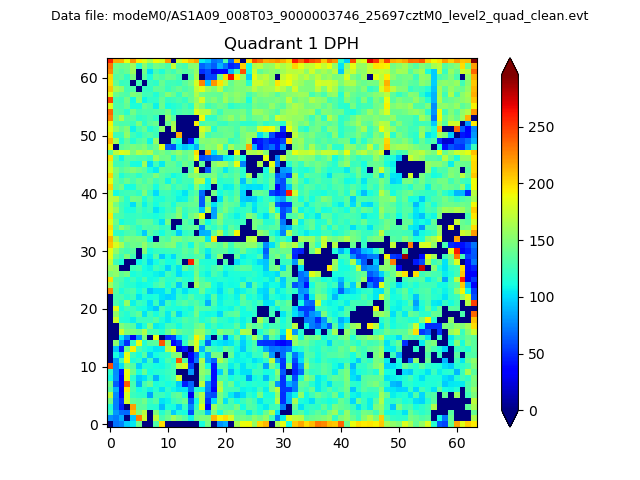 |
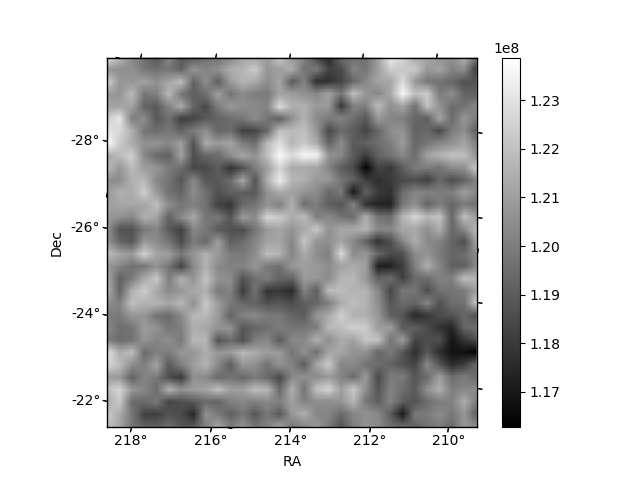
Quadrant B |
|---|---|---|---|
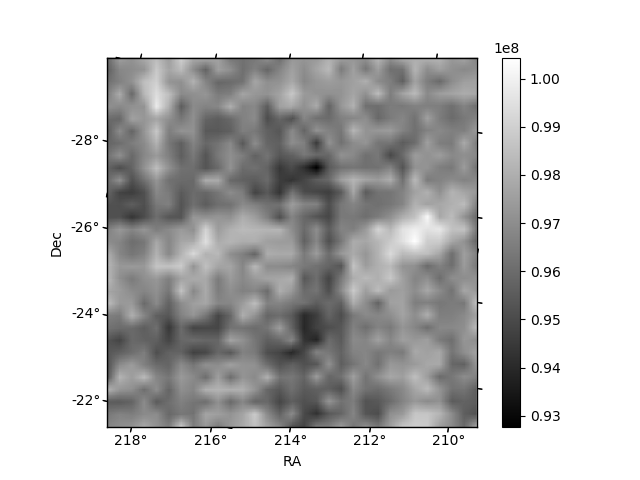
| Quadrant D | 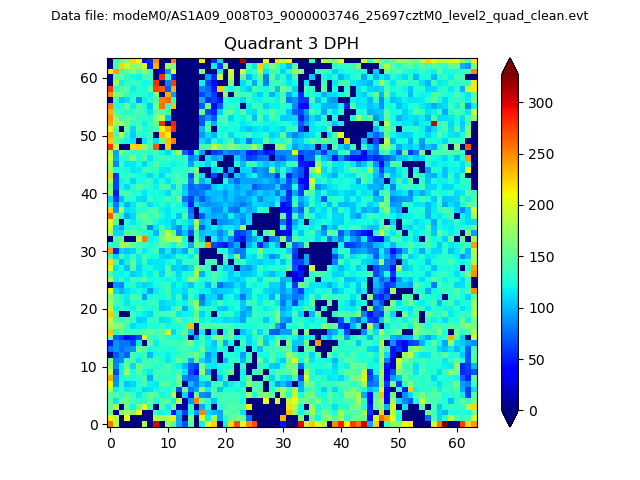 |
 |
Quadrant C |
| Plot type | Count rate plots | Images |
|---|---|---|
| Comparison with Poisson distribution Blue bars denote a histogram of data divided into 1 sec bins. Red curve is a Poisson curve with rate = median count rate of data. |
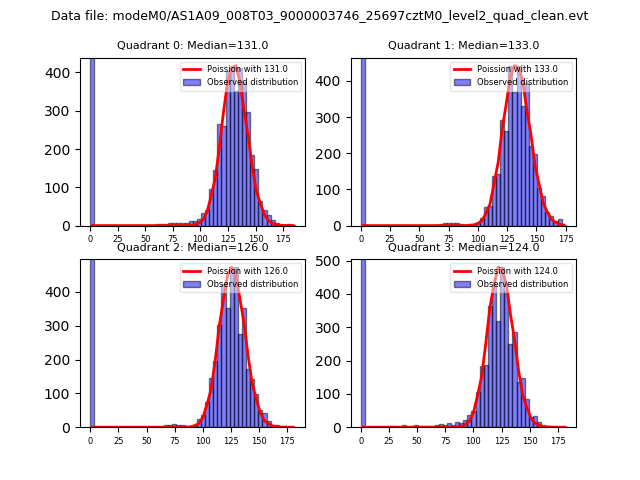 |
 |
| Quadrant-wise count rates Data is divided into 100 sec bins |
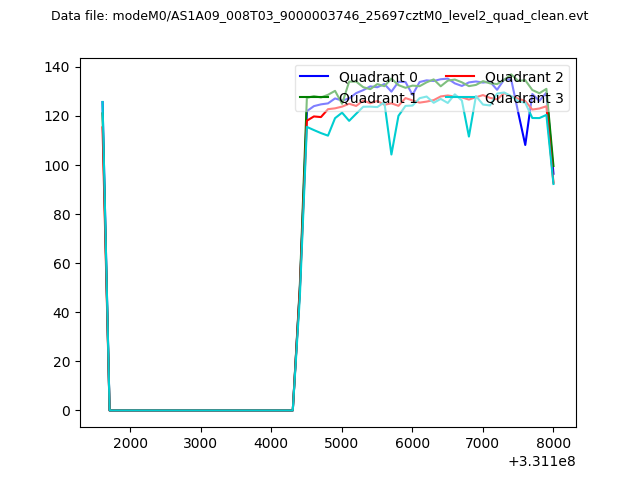 |
|
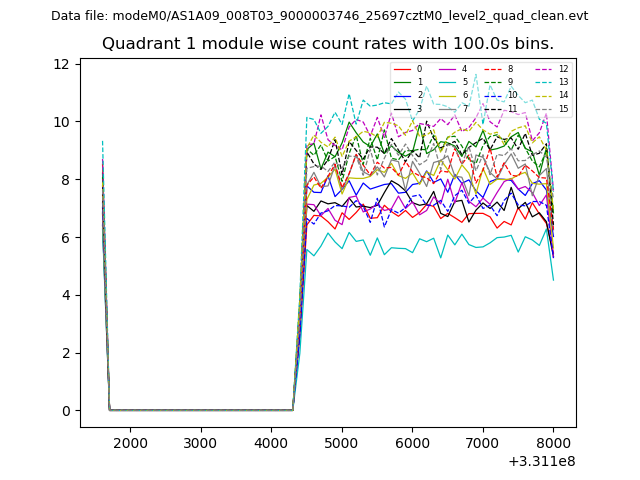
| Module-wise count rates for Quadrant A Data is divided into 100 sec bins |
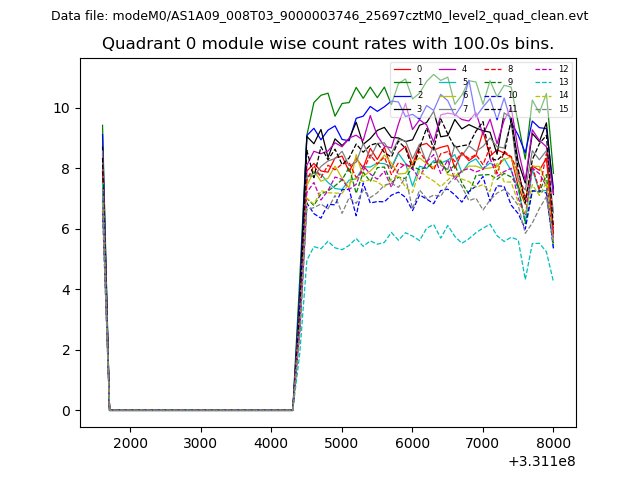 |
 |
| Module-wise count rates for Quadrant B Data is divided into 100 sec bins |
 |
 |
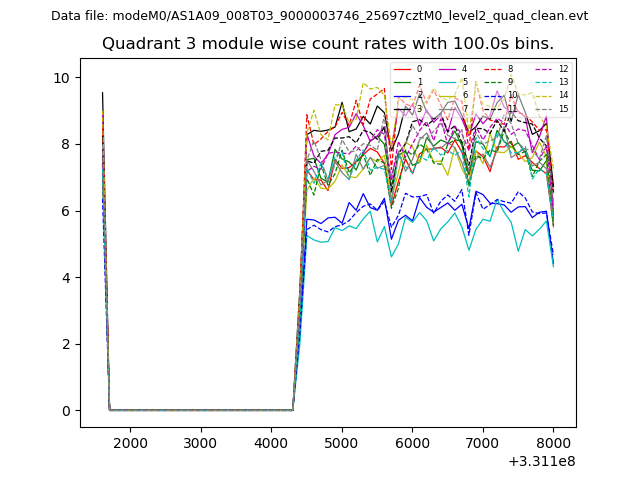
| Module-wise count rates for Quadrant C Data is divided into 100 sec bins |
 |
 |
| Module-wise count rates for Quadrant D Data is divided into 100 sec bins |
 |
 |
| Parameter | Plot |
|---|---|
| CZT HV Monitor | 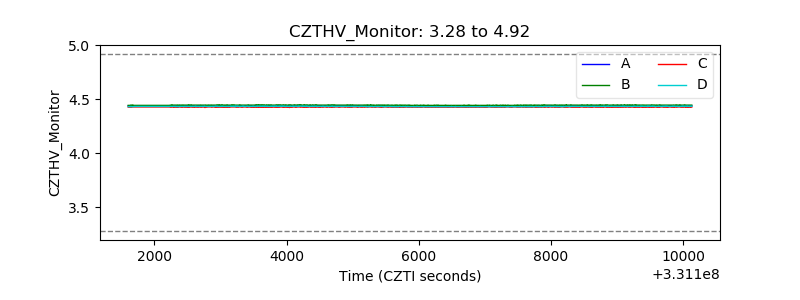 |
| D_VDD | 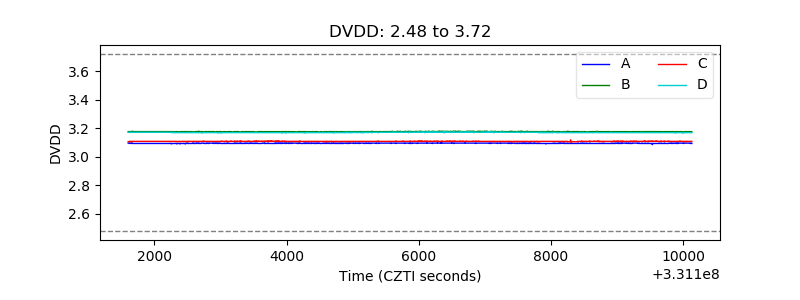 |
| Temperature 1 | 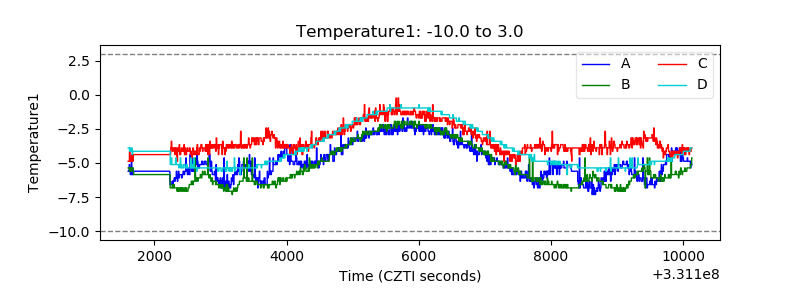 |
| Veto HV Monitor | 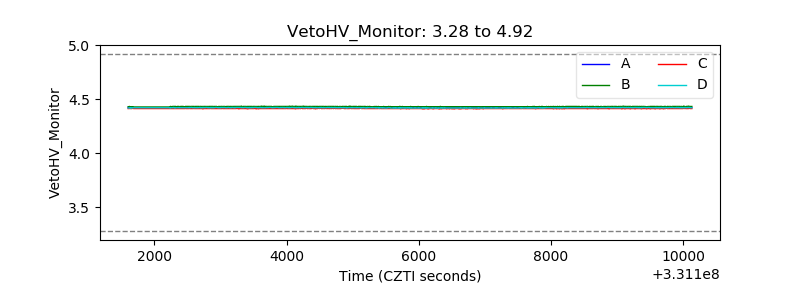 |
| Veto LLD | 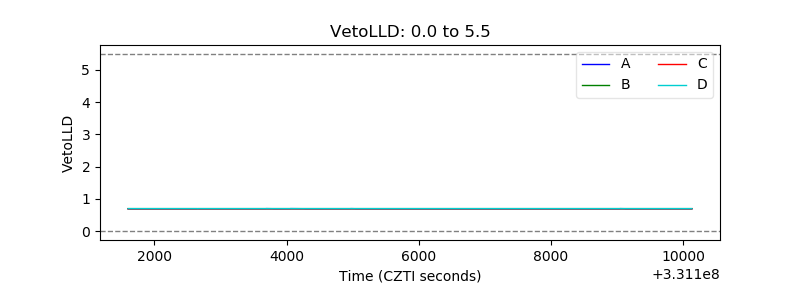 |
| Alpha Counter | 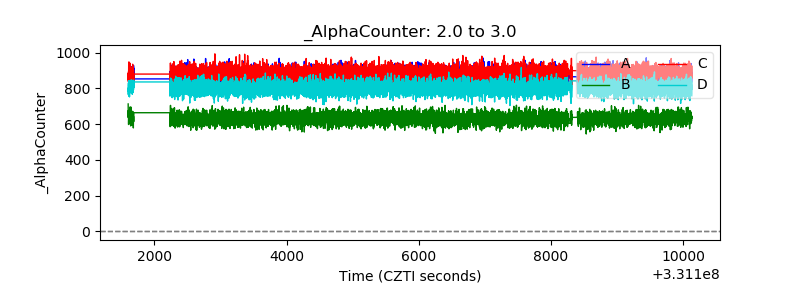 |
| _CPM_Rate | 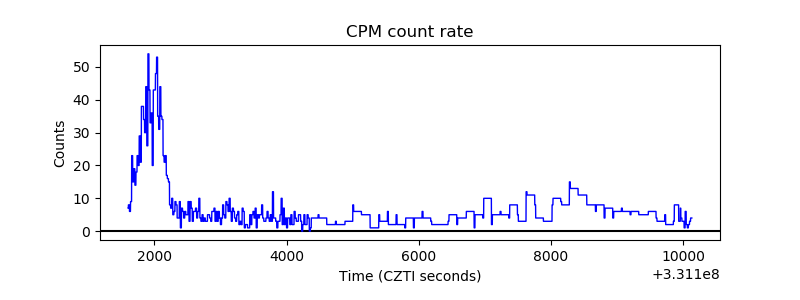 |
| CZT Counter | 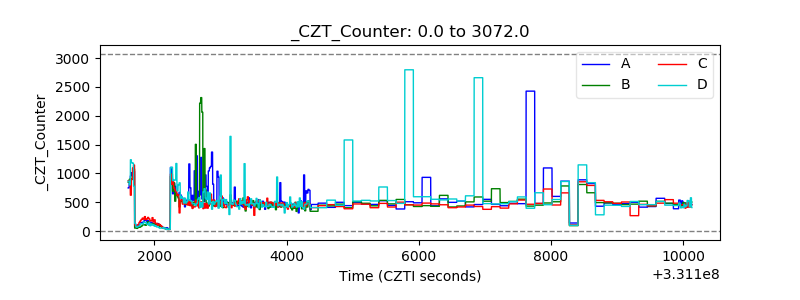 |
| +2.5 Volts monitor |  |
| +5 Volts monitor |  |
| _ROLL_ROT | 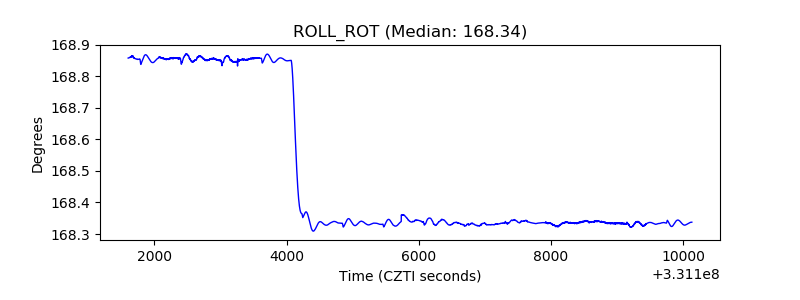 |
| _Roll_DEC | 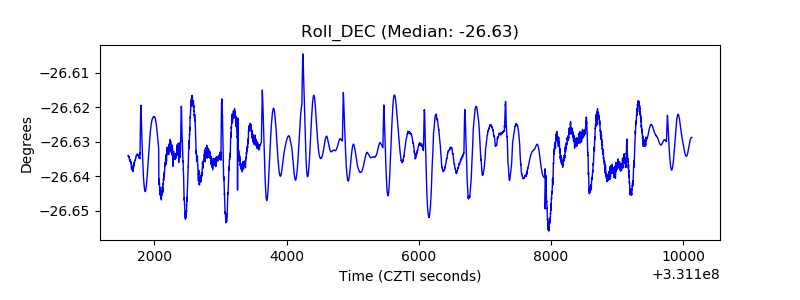 |
| _Roll_RA | 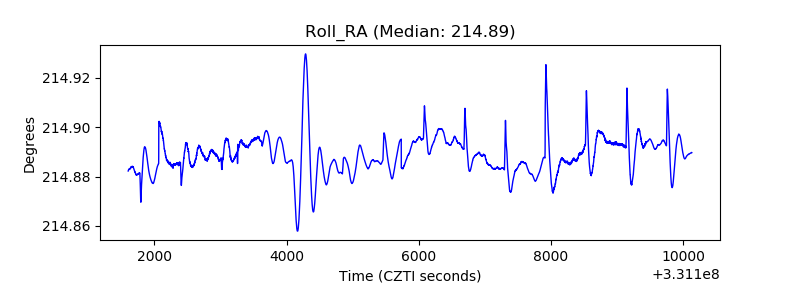 |
| Veto Counter | 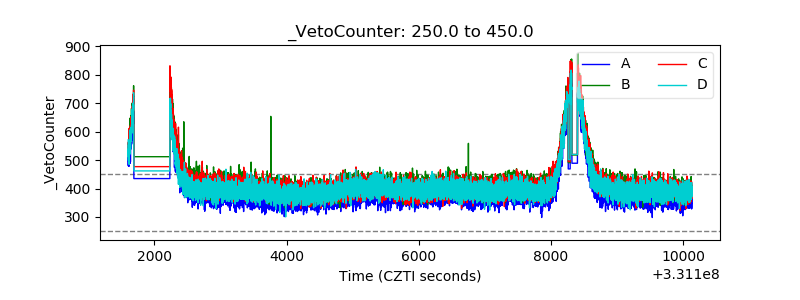 |