| Param | Original file | Final file |
|---|---|---|
| Filename | modeM0/AS1A09_008T03_9000003746_25701cztM0_level2.evt | modeM0/AS1A09_008T03_9000003746_25701cztM0_level2_quad_clean.evt |
| Size (bytes) | 2,088,878,400 | 224,570,880 |
| Size | 1.9 GB | 214.2 MB |
| Events in quadrant A | 30,518,389 | 1,009,723 |
| Events in quadrant B | 8,912,665 | 1,599,905 |
| Events in quadrant C | 8,682,890 | 1,514,306 |
| Events in quadrant D | 13,924,662 | 1,421,033 |
| Mode M9 | |||
|---|---|---|---|
| Quadrant | BADHDUFLAG | Total packets | Discarded packets |
| A | 0 | 19 | 0 |
| B | 0 | 19 | 0 |
| C | 0 | 19 | 0 |
| D | 0 | 19 | 0 |
| Mode M0 | |||
|---|---|---|---|
| Quadrant | BADHDUFLAG | Total packets | Discarded packets |
| A | 0 | 102714 | 0 |
| B | 0 | 37620 | 0 |
| C | 0 | 37287 | 0 |
| D | 0 | 52856 | 0 |
| Quadrant | Total seconds | Saturated seconds | Saturation percentage |
|---|---|---|---|
| A | 18175 | 9228 | 50.773040% |
| B | 18175 | 197 | 1.083906% |
| C | 18176 | 284 | 1.562500% |
| D | 18176 | 1390 | 7.647447% |
Noise dominated data is calculated using 1-second bins in cleaned event files. If a bin has >2000 counts, and if more than 50% of those come from <1% of pixels, then it is considered to be noise-dominated and hence unusable.
| Quadrant | # 1 sec bins | Bins with >0 counts | Bins with >2000 counts | High rate bins dominated by noise | Noise dominated (total time) | Noise dominated (detector-on time) | Marked lightcurve |
|---|---|---|---|---|---|---|---|
| A | 20070 | 18175 | 8369 | 8369 | 41.70% | 46.05% | 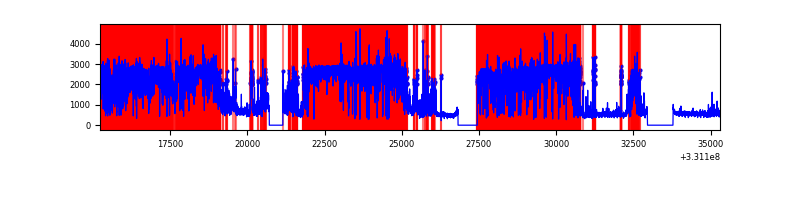 |
| B | 20070 | 18175 | 2 | 2 | 0.01% | 0.01% | 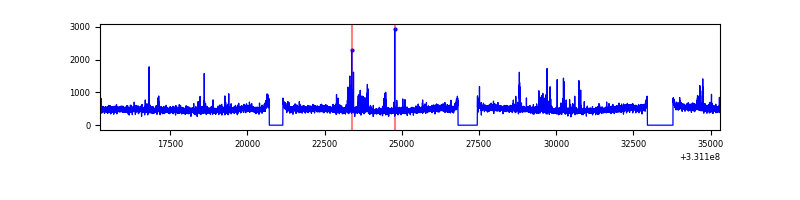 |
| C | 20071 | 18177 | 5 | 5 | 0.02% | 0.03% | 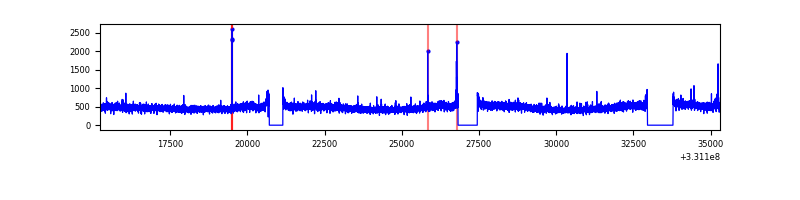 |
| D | 20071 | 18176 | 1048 | 1048 | 5.22% | 5.77% | 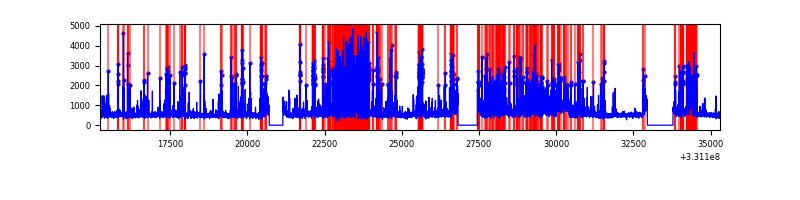 |
Top three noisy pixels from each quadrant. If the there are fewer than three noisy pixels in the level2.evt file, extra rows are filled as -1
| Pixel properties | Quadrant properties | ||||||
|---|---|---|---|---|---|---|---|
| Quadrant | DetID | PixID | Counts | Sigma | Mean | Median | Sigma |
| A | 0 | 13 | 23842005 | 69001.18 | 1722 | 1683 | 345.5 |
| A | 6 | 16 | 31355 | 85.88 | 1722 | 1683 | 345.5 |
| A | 13 | 254 | 19952 | 52.88 | 1722 | 1683 | 345.5 |
| B | 0 | 245 | 69380 | 158.87 | 2207 | 2150 | 423.2 |
| B | 0 | 190 | 59939 | 136.56 | 2207 | 2150 | 423.2 |
| B | 0 | 219 | 58547 | 133.27 | 2207 | 2150 | 423.2 |
| C | 14 | 238 | 337253 | 675.22 | 2115 | 2125 | 496.3 |
| C | 3 | 233 | 69399 | 135.55 | 2115 | 2125 | 496.3 |
| C | 0 | 207 | 19757 | 35.53 | 2115 | 2125 | 496.3 |
| D | 1 | 52 | 3906784 | 7686.48 | 2092 | 2031 | 508.0 |
| D | 8 | 195 | 806918 | 1584.41 | 2092 | 2031 | 508.0 |
| D | 7 | 80 | 806434 | 1583.46 | 2092 | 2031 | 508.0 |
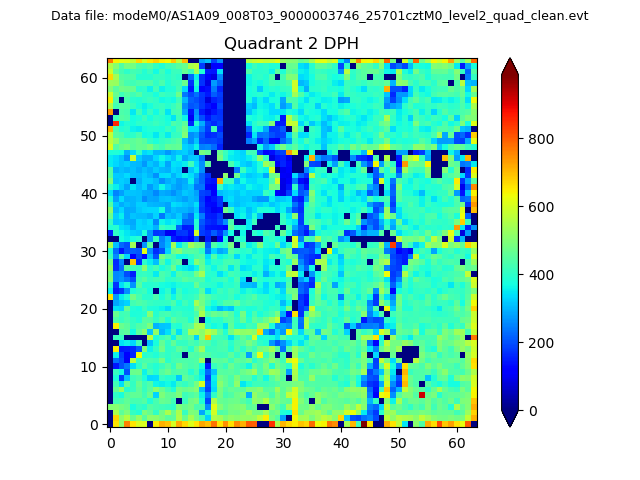
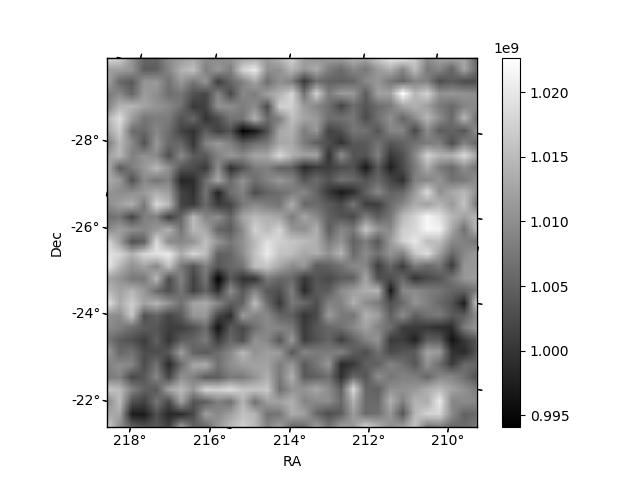
Histogram calculated using DETX and DETY for each event in the final _common_clean file
| Quadrant A | 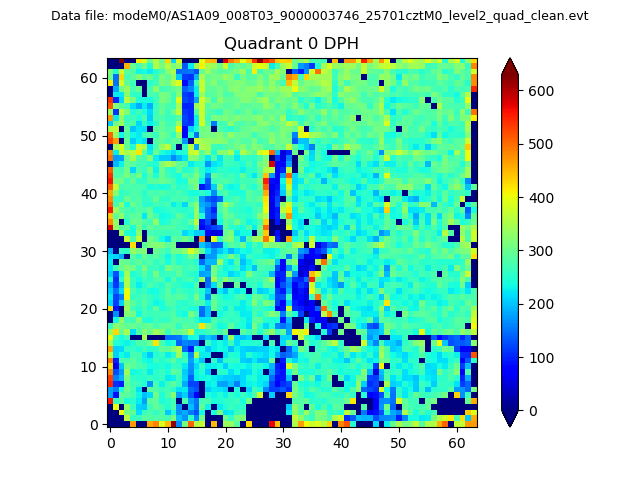 |
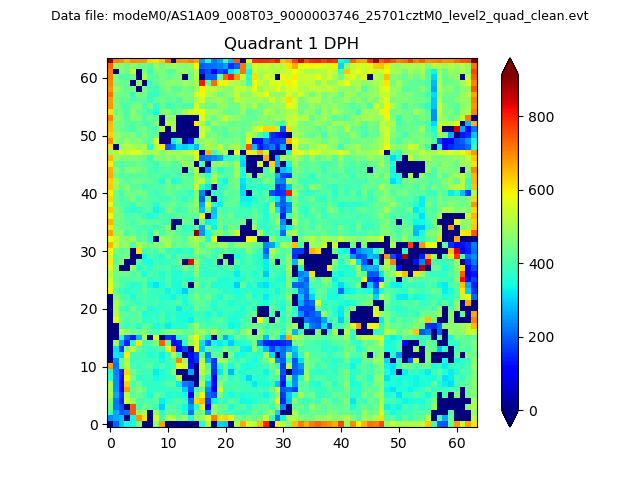 |
Quadrant B |
|---|---|---|---|
| Quadrant D | 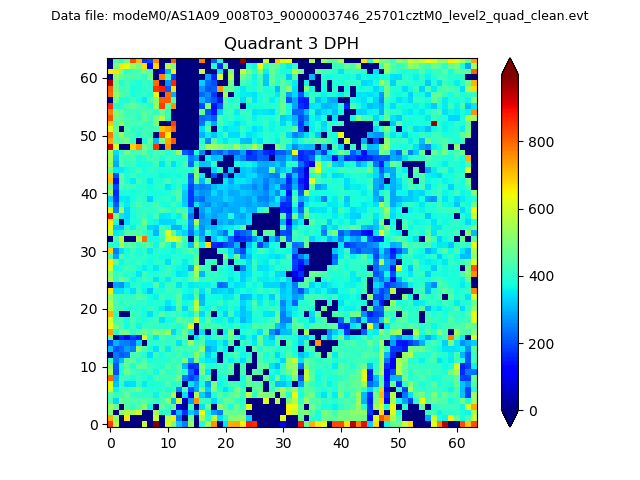 |
 |
Quadrant C |
| Plot type | Count rate plots | Images |
|---|---|---|
| Comparison with Poisson distribution Blue bars denote a histogram of data divided into 1 sec bins. Red curve is a Poisson curve with rate = median count rate of data. |
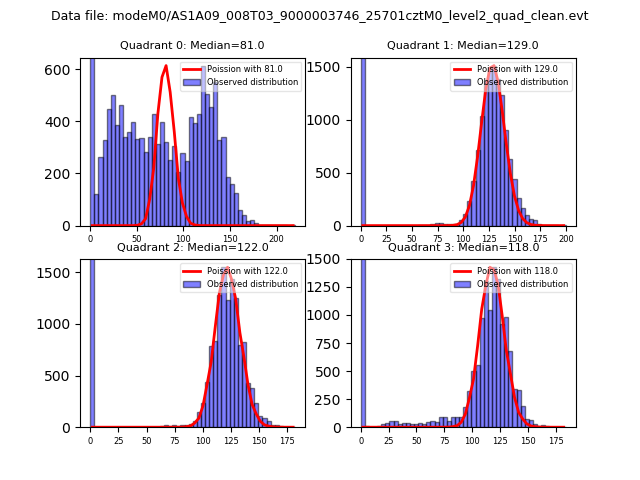 |
 |
| Quadrant-wise count rates Data is divided into 100 sec bins |
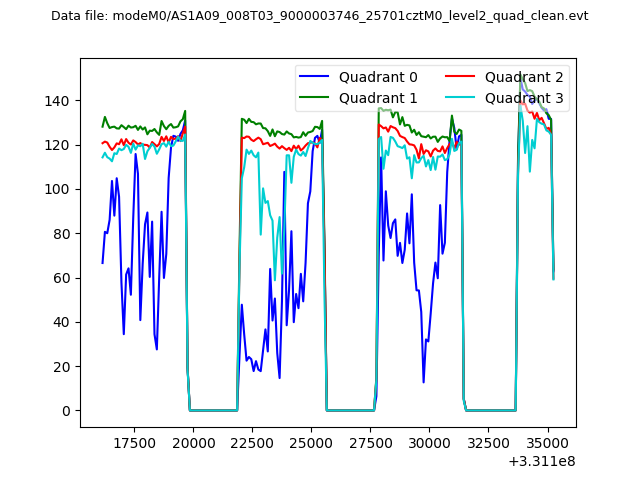 |
|
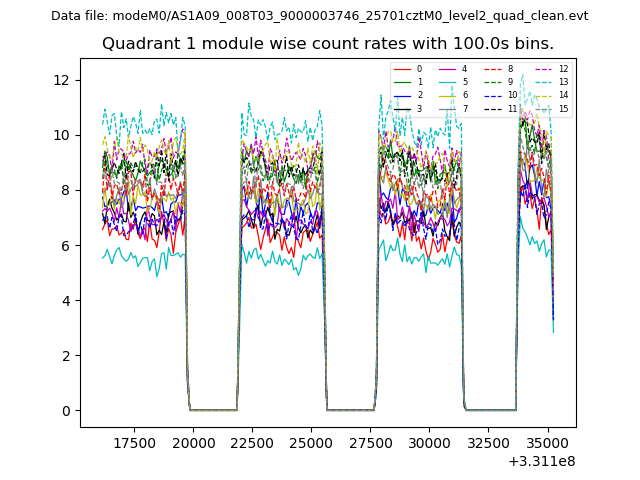
| Module-wise count rates for Quadrant A Data is divided into 100 sec bins |
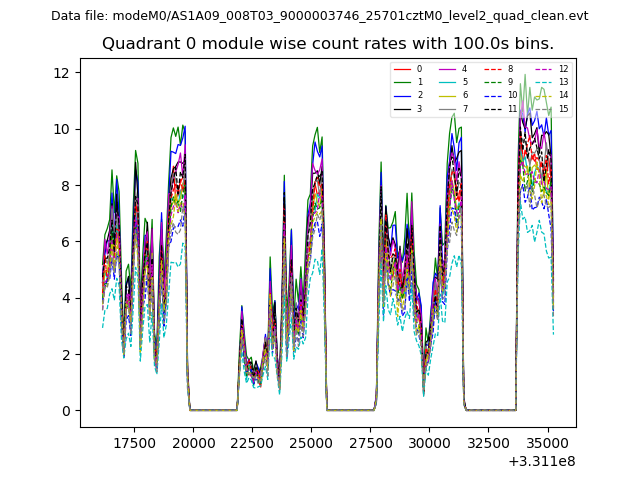 |
 |
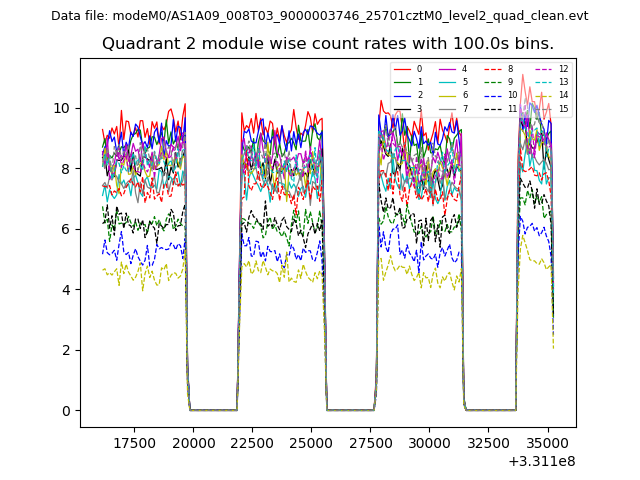
| Module-wise count rates for Quadrant B Data is divided into 100 sec bins |
 |
 |
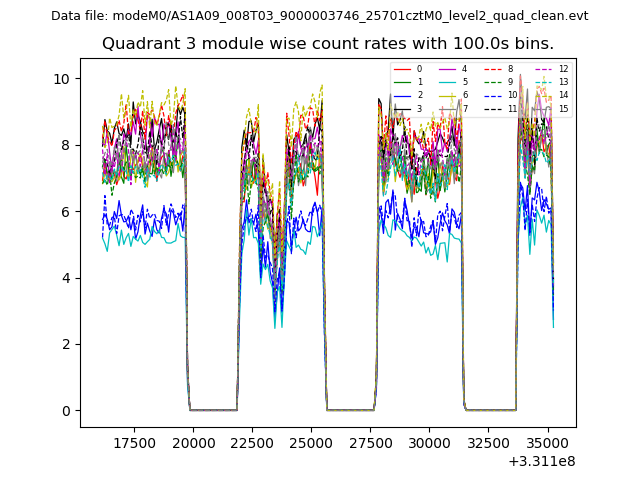
| Module-wise count rates for Quadrant C Data is divided into 100 sec bins |
 |
 |
| Module-wise count rates for Quadrant D Data is divided into 100 sec bins |
 |
 |
| Parameter | Plot |
|---|---|
| CZT HV Monitor | 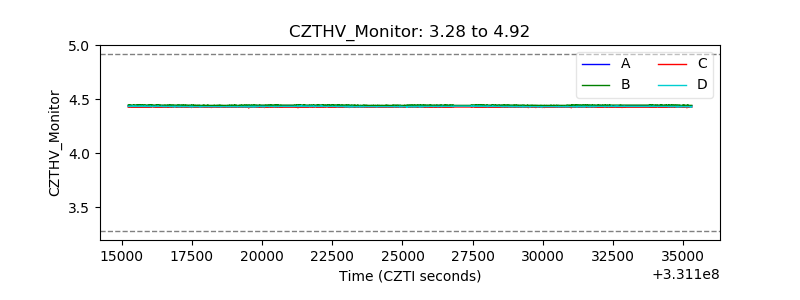 |
| D_VDD | 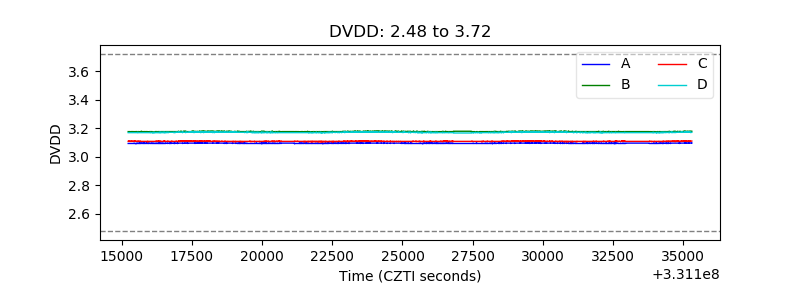 |
| Temperature 1 | 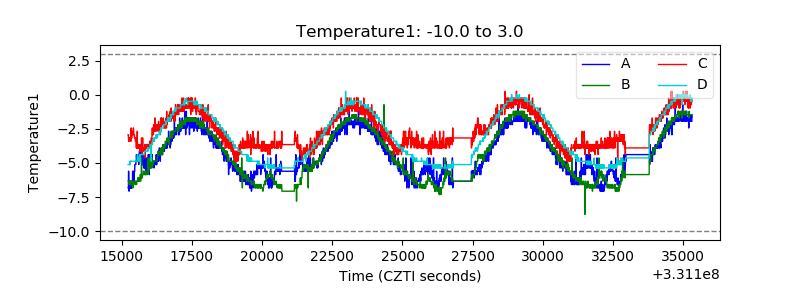 |
| Veto HV Monitor | 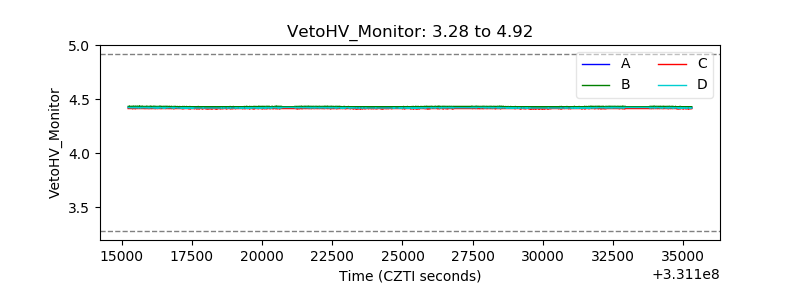 |
| Veto LLD | 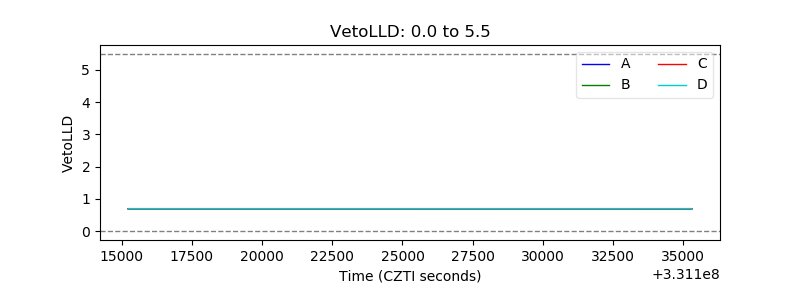 |
| Alpha Counter | 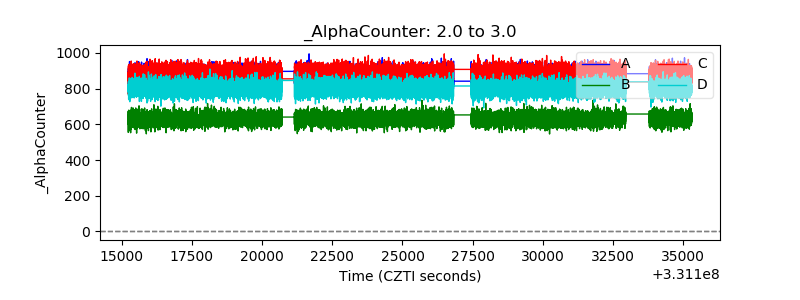 |
| _CPM_Rate | 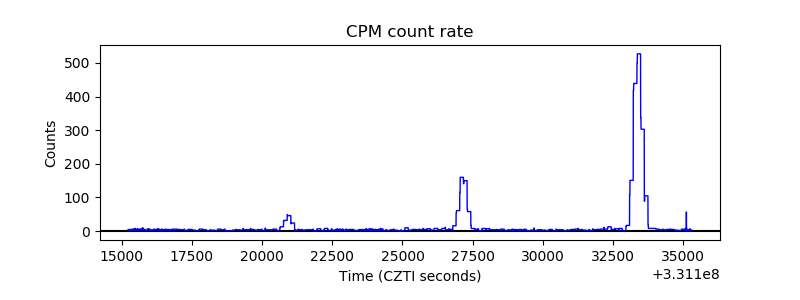 |
| CZT Counter | 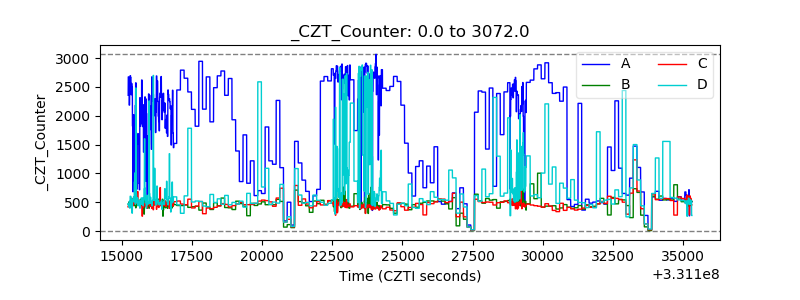 |
| +2.5 Volts monitor |  |
| +5 Volts monitor | 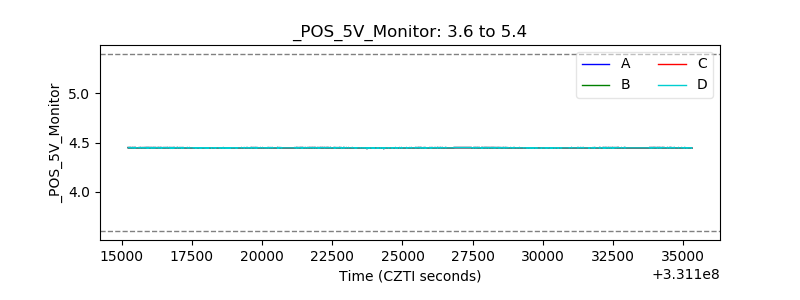 |
| _ROLL_ROT | 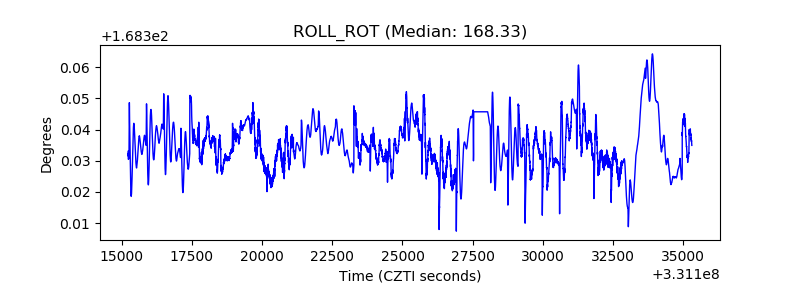 |
| _Roll_DEC | 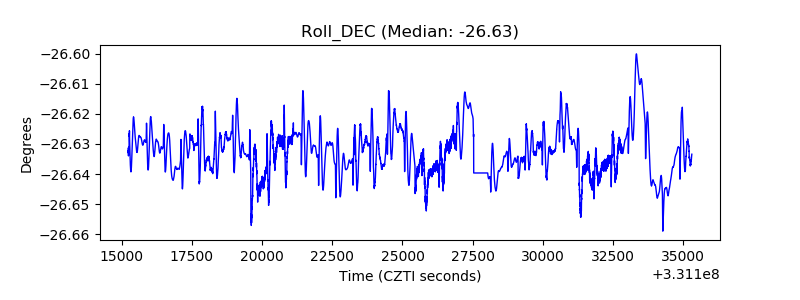 |
| _Roll_RA | 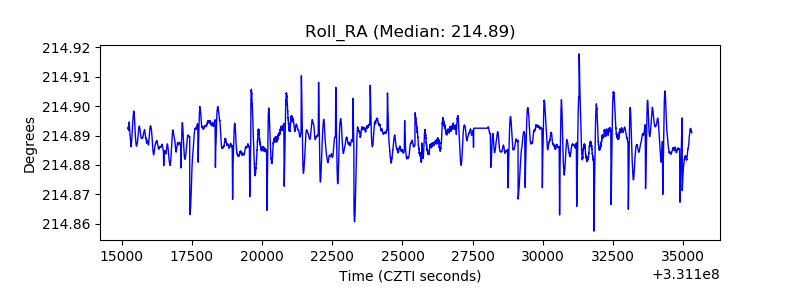 |
| Veto Counter | 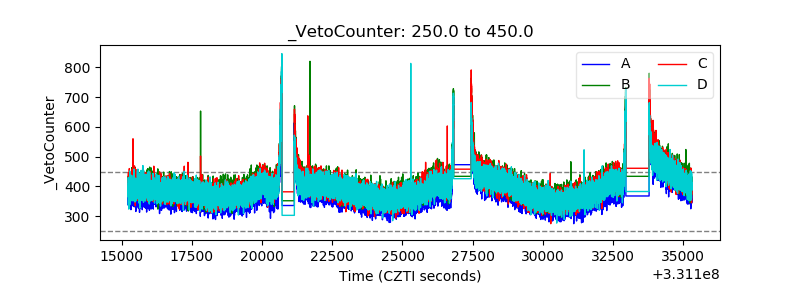 |