| Param | Original file | Final file |
|---|---|---|
| Filename | modeM0/AS1A09_008T03_9000003746_25702cztM0_level2.evt | modeM0/AS1A09_008T03_9000003746_25702cztM0_level2_quad_clean.evt |
| Size (bytes) | 489,133,440 | 99,322,560 |
| Size | 466.5 MB | 94.7 MB |
| Events in quadrant A | 3,553,998 | 658,424 |
| Events in quadrant B | 3,317,100 | 659,313 |
| Events in quadrant C | 3,290,433 | 621,076 |
| Events in quadrant D | 4,204,232 | 609,175 |
| Mode M9 | |||
|---|---|---|---|
| Quadrant | BADHDUFLAG | Total packets | Discarded packets |
| A | 0 | 9 | 0 |
| B | 0 | 9 | 0 |
| C | 0 | 9 | 0 |
| D | 0 | 9 | 0 |
| Mode M0 | |||
|---|---|---|---|
| Quadrant | BADHDUFLAG | Total packets | Discarded packets |
| A | 0 | 14630 | 0 |
| B | 0 | 13979 | 0 |
| C | 0 | 13941 | 0 |
| D | 0 | 16827 | 0 |
| Quadrant | Total seconds | Saturated seconds | Saturation percentage |
|---|---|---|---|
| A | 6594 | 53 | 0.803761% |
| B | 6595 | 51 | 0.773313% |
| C | 6595 | 80 | 1.213040% |
| D | 6594 | 269 | 4.079466% |
Noise dominated data is calculated using 1-second bins in cleaned event files. If a bin has >2000 counts, and if more than 50% of those come from <1% of pixels, then it is considered to be noise-dominated and hence unusable.
| Quadrant | # 1 sec bins | Bins with >0 counts | Bins with >2000 counts | High rate bins dominated by noise | Noise dominated (total time) | Noise dominated (detector-on time) | Marked lightcurve |
|---|---|---|---|---|---|---|---|
| A | 7569 | 6594 | 4 | 4 | 0.05% | 0.06% | 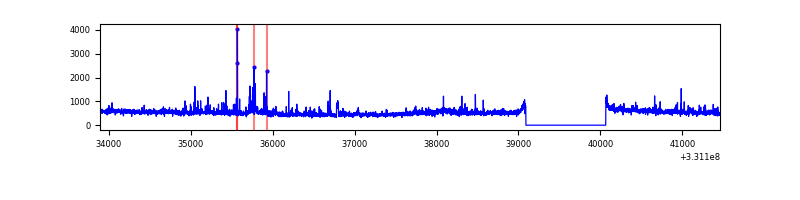 |
| B | 7570 | 6595 | 0 | 0 | 0.00% | 0.00% | 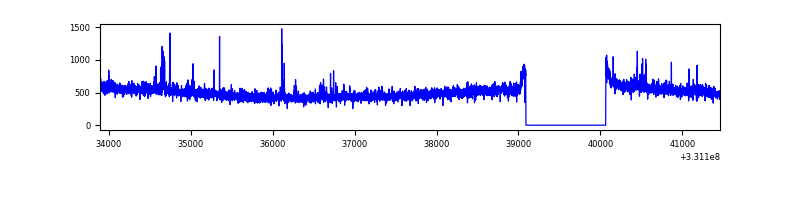 |
| C | 7570 | 6596 | 0 | 0 | 0.00% | 0.00% | 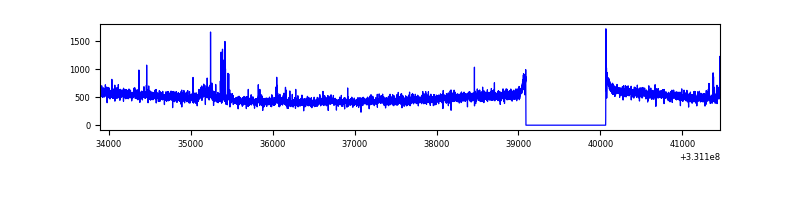 |
| D | 7569 | 6594 | 171 | 171 | 2.26% | 2.59% | 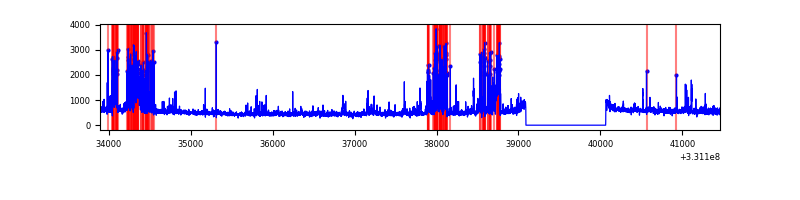 |
Top three noisy pixels from each quadrant. If the there are fewer than three noisy pixels in the level2.evt file, extra rows are filled as -1
| Pixel properties | Quadrant properties | ||||||
|---|---|---|---|---|---|---|---|
| Quadrant | DetID | PixID | Counts | Sigma | Mean | Median | Sigma |
| A | 0 | 13 | 267874 | 1590.41 | 838 | 824 | 167.9 |
| A | 6 | 16 | 29579 | 171.25 | 838 | 824 | 167.9 |
| A | 3 | 1 | 28076 | 162.3 | 838 | 824 | 167.9 |
| B | 0 | 190 | 38485 | 239.15 | 823 | 803 | 157.6 |
| B | 0 | 219 | 23620 | 144.81 | 823 | 803 | 157.6 |
| B | 0 | 245 | 21152 | 129.15 | 823 | 803 | 157.6 |
| C | 14 | 238 | 124303 | 668.19 | 788 | 792 | 184.8 |
| C | 3 | 233 | 73256 | 392.03 | 788 | 792 | 184.8 |
| C | 0 | 207 | 16166 | 83.17 | 788 | 792 | 184.8 |
| D | 7 | 80 | 851057 | 4379.95 | 796 | 775 | 194.1 |
| D | 8 | 195 | 243256 | 1249.06 | 796 | 775 | 194.1 |
| D | 13 | 104 | 33318 | 167.63 | 796 | 775 | 194.1 |
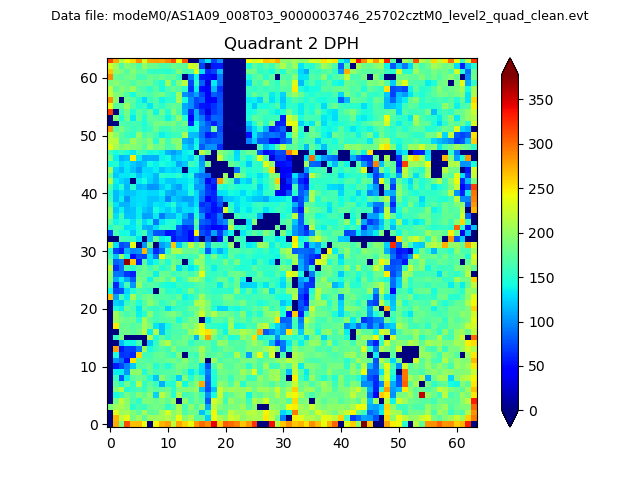
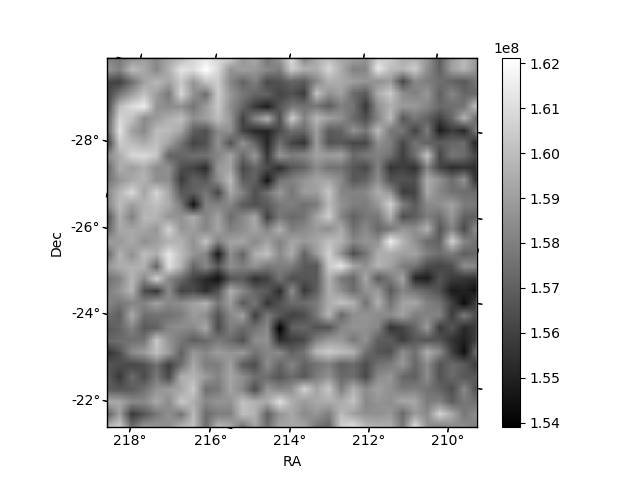
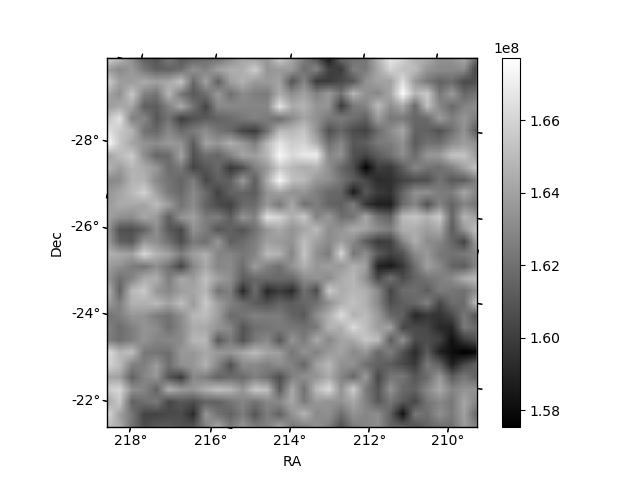
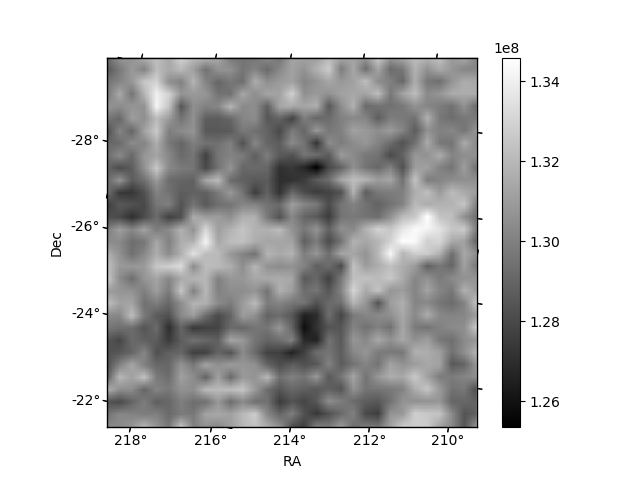
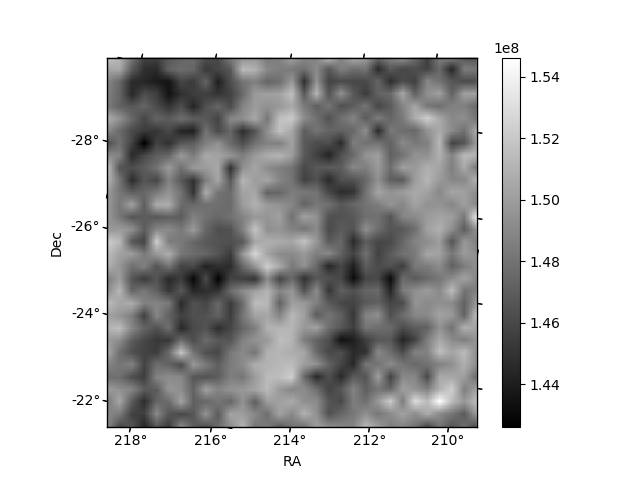
Histogram calculated using DETX and DETY for each event in the final _common_clean file
| Quadrant A | 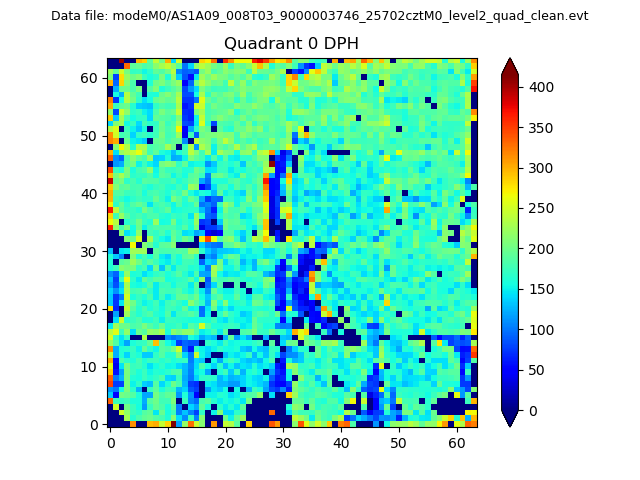 |
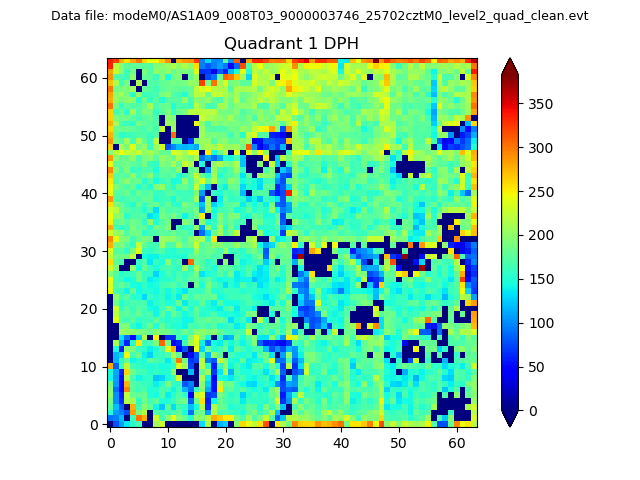 |
Quadrant B |
|---|---|---|---|
| Quadrant D | 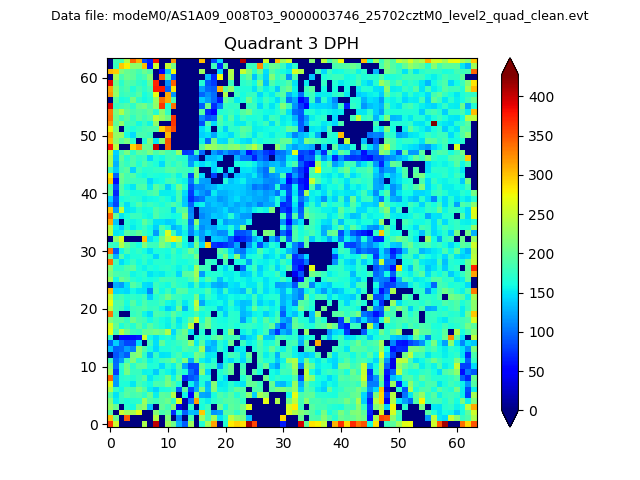 |
 |
Quadrant C |
| Plot type | Count rate plots | Images |
|---|---|---|
| Comparison with Poisson distribution Blue bars denote a histogram of data divided into 1 sec bins. Red curve is a Poisson curve with rate = median count rate of data. |
 |
 |
| Quadrant-wise count rates Data is divided into 100 sec bins |
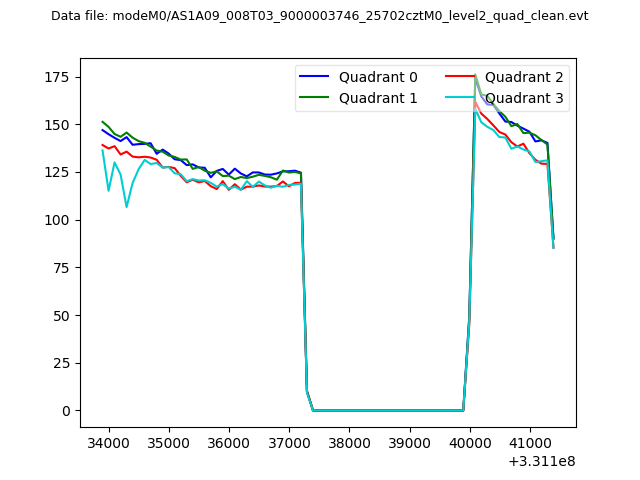 |
|
| Module-wise count rates for Quadrant A Data is divided into 100 sec bins |
 |
 |
| Module-wise count rates for Quadrant B Data is divided into 100 sec bins |
 |
 |
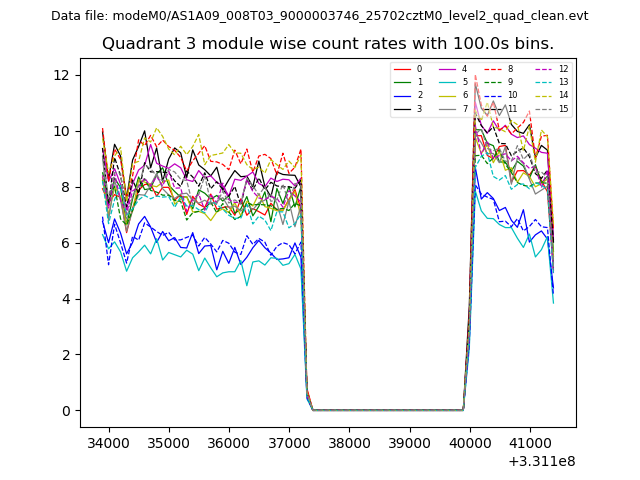
| Module-wise count rates for Quadrant C Data is divided into 100 sec bins |
 |
 |
| Module-wise count rates for Quadrant D Data is divided into 100 sec bins |
 |
 |
| Parameter | Plot |
|---|---|
| CZT HV Monitor | 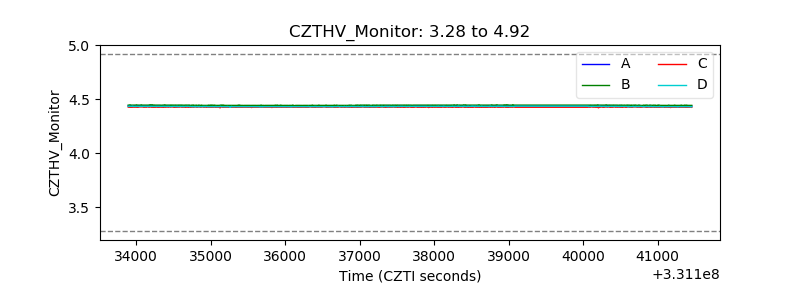 |
| D_VDD | 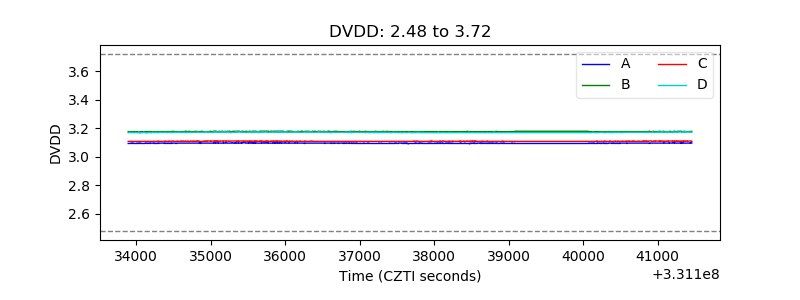 |
| Temperature 1 | 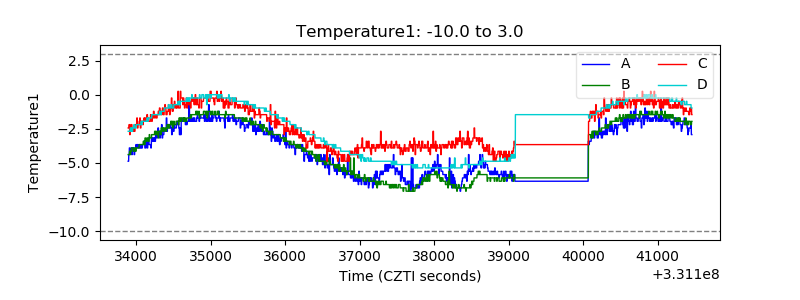 |
| Veto HV Monitor | 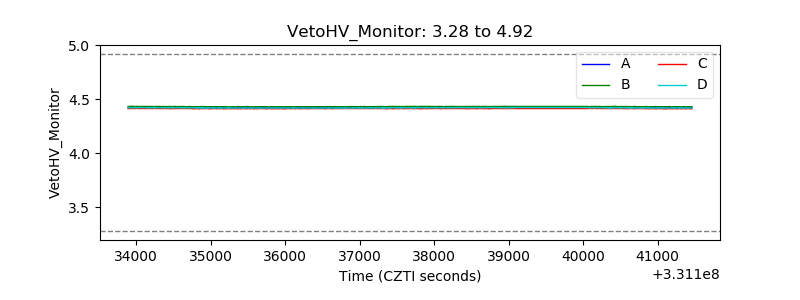 |
| Veto LLD | 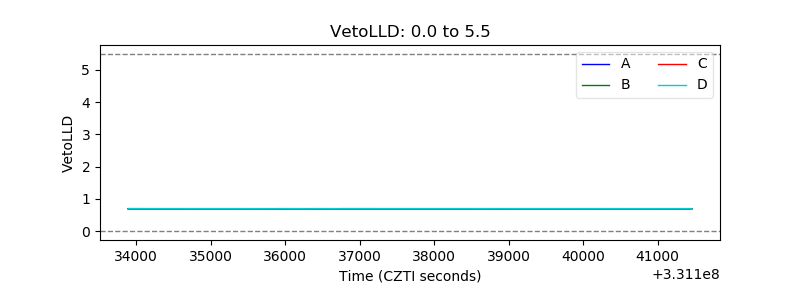 |
| Alpha Counter | 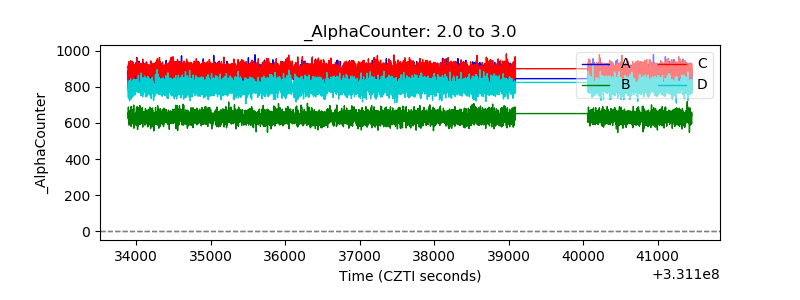 |
| _CPM_Rate | 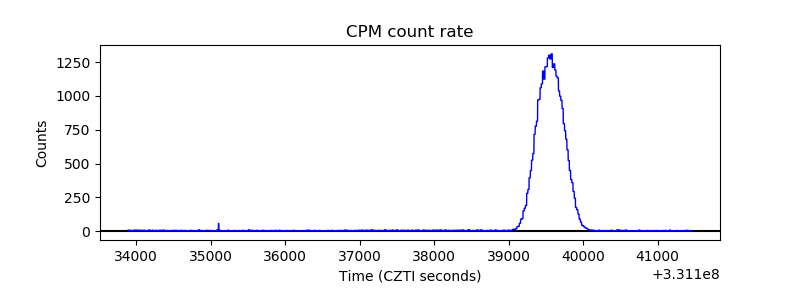 |
| CZT Counter |  |
| +2.5 Volts monitor |  |
| +5 Volts monitor |  |
| _ROLL_ROT |  |
| _Roll_DEC | 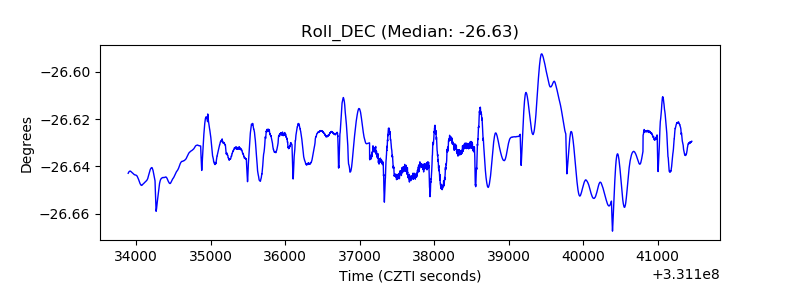 |
| _Roll_RA |  |
| Veto Counter |  |