| Param | Original file | Final file |
|---|---|---|
| Filename | modeM0/AS1A09_008T03_9000003746_25705cztM0_level2.evt | modeM0/AS1A09_008T03_9000003746_25705cztM0_level2_quad_clean.evt |
| Size (bytes) | 505,088,640 | 94,608,000 |
| Size | 481.7 MB | 90.2 MB |
| Events in quadrant A | 3,294,658 | 634,891 |
| Events in quadrant B | 3,310,991 | 642,128 |
| Events in quadrant C | 3,269,912 | 592,489 |
| Events in quadrant D | 4,996,021 | 558,291 |
| Mode M9 | |||
|---|---|---|---|
| Quadrant | BADHDUFLAG | Total packets | Discarded packets |
| A | 0 | 14 | 0 |
| B | 0 | 15 | 0 |
| C | 0 | 15 | 0 |
| D | 0 | 15 | 0 |
| Mode M0 | |||
|---|---|---|---|
| Quadrant | BADHDUFLAG | Total packets | Discarded packets |
| A | 0 | 13811 | 0 |
| B | 0 | 13745 | 0 |
| C | 0 | 13724 | 0 |
| D | 0 | 18959 | 0 |
| Quadrant | Total seconds | Saturated seconds | Saturation percentage |
|---|---|---|---|
| A | 6262 | 61 | 0.974130% |
| B | 6262 | 70 | 1.117854% |
| C | 6262 | 128 | 2.044075% |
| D | 6262 | 406 | 6.483552% |
Noise dominated data is calculated using 1-second bins in cleaned event files. If a bin has >2000 counts, and if more than 50% of those come from <1% of pixels, then it is considered to be noise-dominated and hence unusable.
| Quadrant | # 1 sec bins | Bins with >0 counts | Bins with >2000 counts | High rate bins dominated by noise | Noise dominated (total time) | Noise dominated (detector-on time) | Marked lightcurve |
|---|---|---|---|---|---|---|---|
| A | 7502 | 6262 | 0 | 0 | 0.00% | 0.00% | 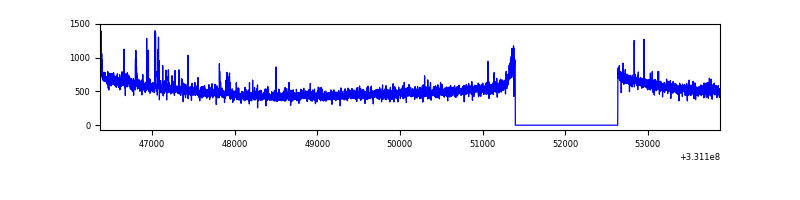 |
| B | 7502 | 6262 | 1 | 1 | 0.01% | 0.02% | 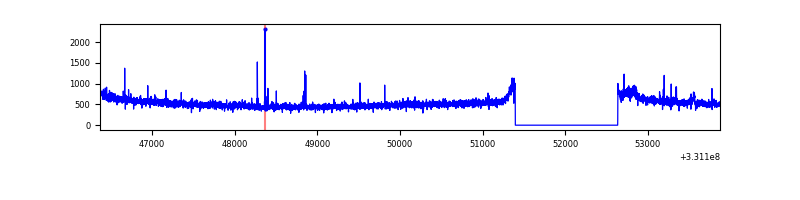 |
| C | 7502 | 6262 | 15 | 15 | 0.20% | 0.24% | 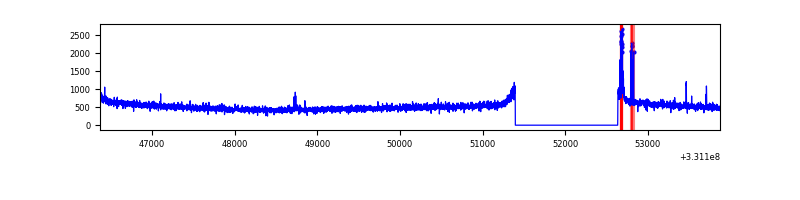 |
| D | 7502 | 6262 | 343 | 343 | 4.57% | 5.48% | 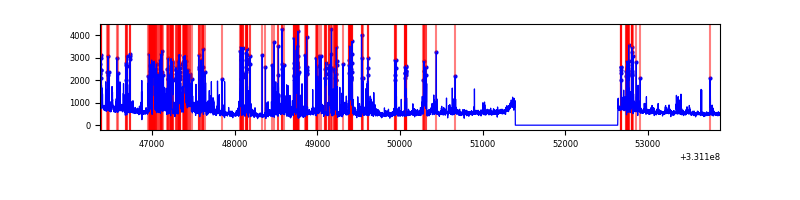 |
Top three noisy pixels from each quadrant. If the there are fewer than three noisy pixels in the level2.evt file, extra rows are filled as -1
| Pixel properties | Quadrant properties | ||||||
|---|---|---|---|---|---|---|---|
| Quadrant | DetID | PixID | Counts | Sigma | Mean | Median | Sigma |
| A | 0 | 13 | 64551 | 380.13 | 836 | 821 | 167.7 |
| A | 13 | 254 | 8798 | 47.58 | 836 | 821 | 167.7 |
| A | 3 | 1 | 7470 | 39.66 | 836 | 821 | 167.7 |
| B | 0 | 190 | 30149 | 186.32 | 827 | 809 | 157.5 |
| B | 12 | 111 | 18241 | 110.7 | 827 | 809 | 157.5 |
| B | 0 | 245 | 17660 | 107.01 | 827 | 809 | 157.5 |
| C | 14 | 238 | 126158 | 683.22 | 782 | 789 | 183.5 |
| C | 3 | 233 | 94055 | 508.27 | 782 | 789 | 183.5 |
| C | 13 | 61 | 5606 | 26.25 | 782 | 789 | 183.5 |
| D | 7 | 80 | 1586844 | 8377.24 | 776 | 753 | 189.3 |
| D | 8 | 195 | 242429 | 1276.46 | 776 | 753 | 189.3 |
| D | 2 | 244 | 94192 | 493.52 | 776 | 753 | 189.3 |
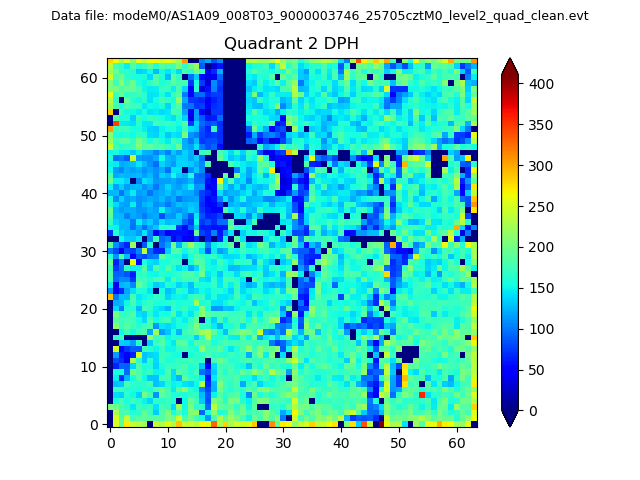
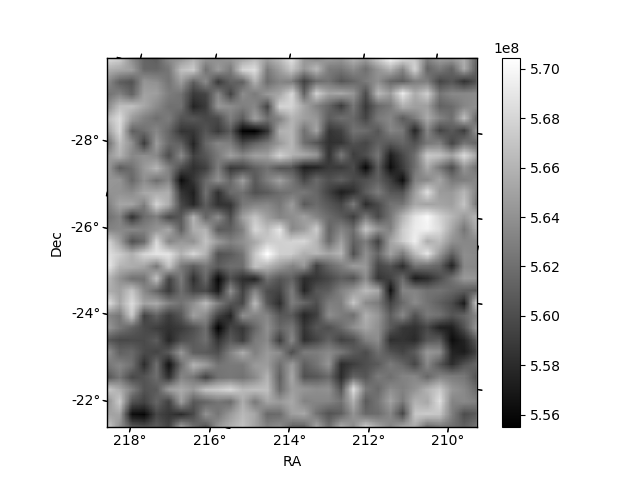
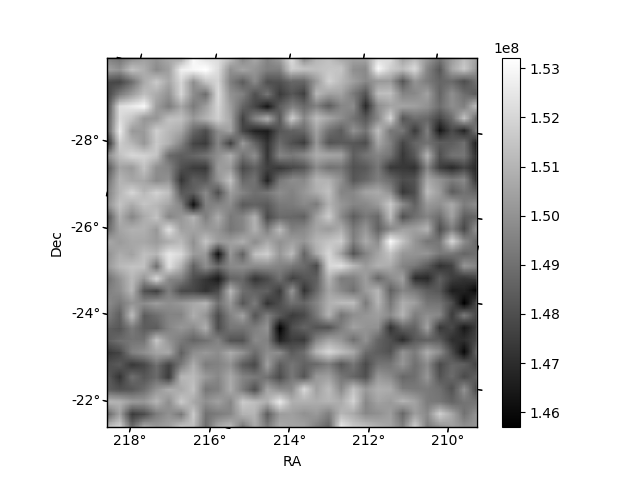
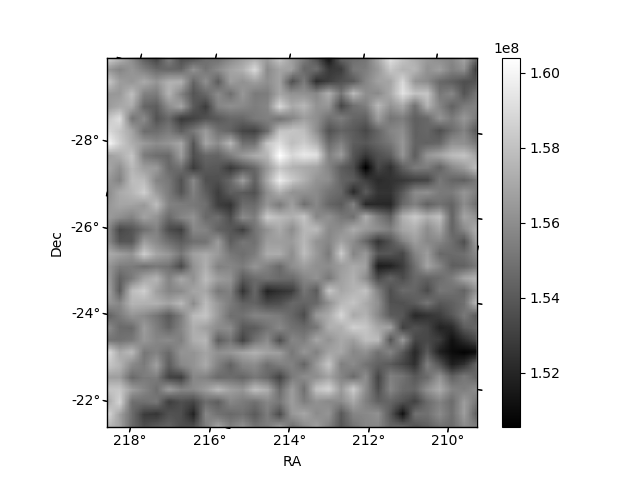
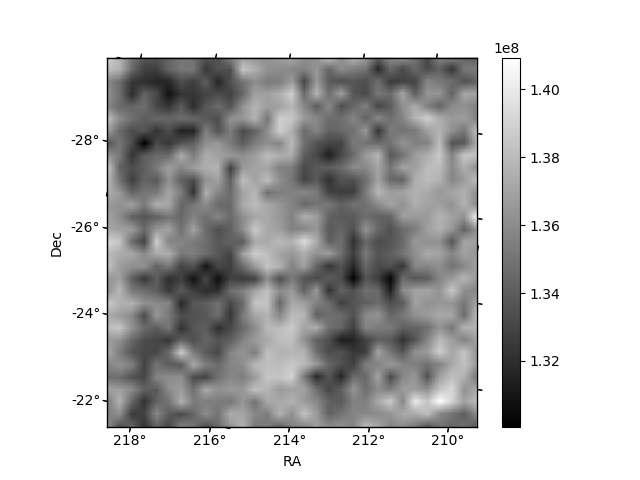
Histogram calculated using DETX and DETY for each event in the final _common_clean file
| Quadrant A | 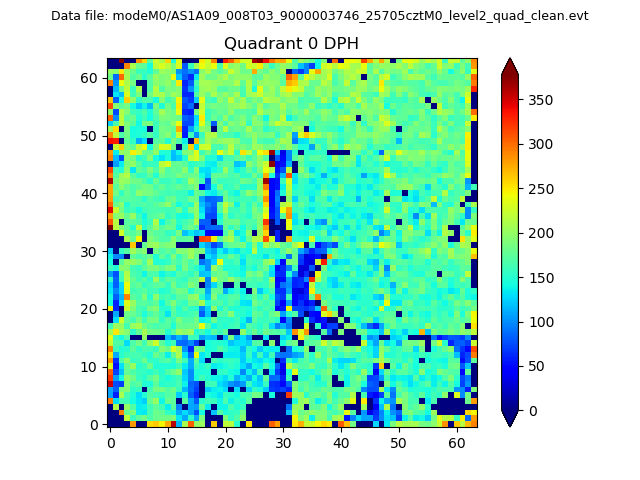 |
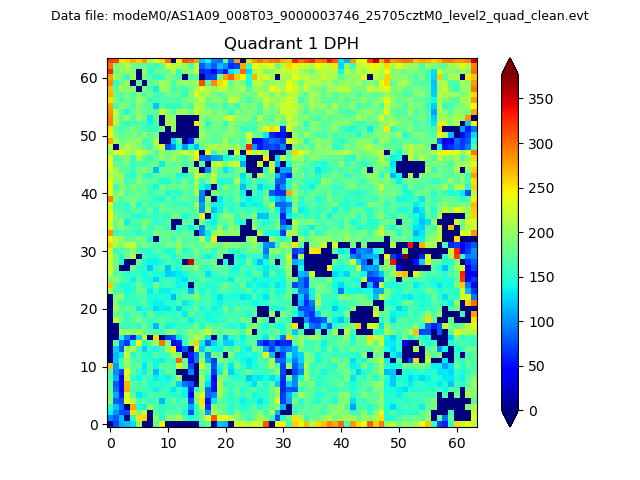 |
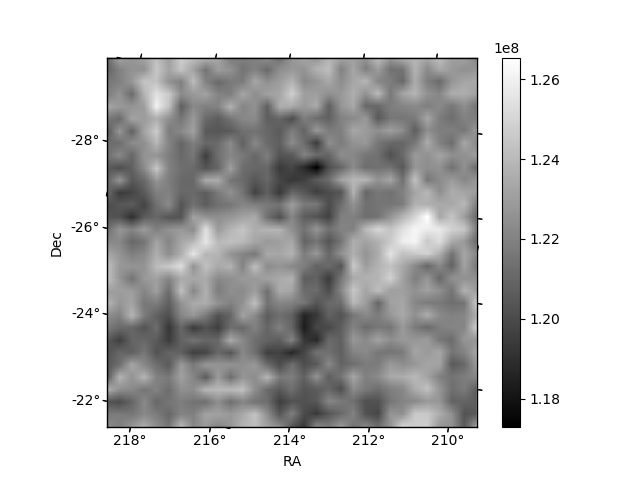
Quadrant B |
|---|---|---|---|
| Quadrant D | 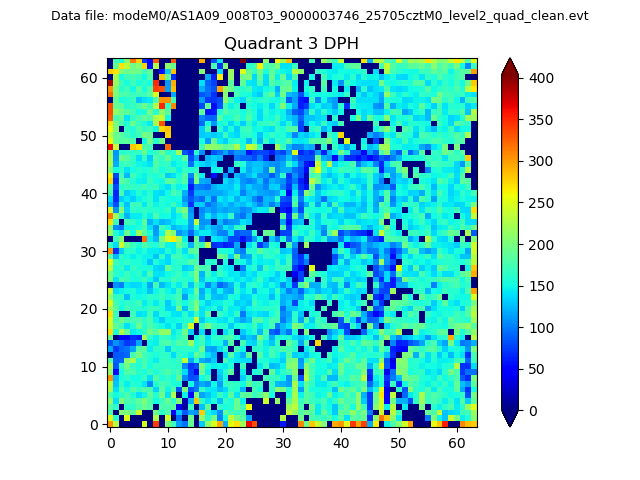 |
 |
Quadrant C |
| Plot type | Count rate plots | Images |
|---|---|---|
| Comparison with Poisson distribution Blue bars denote a histogram of data divided into 1 sec bins. Red curve is a Poisson curve with rate = median count rate of data. |
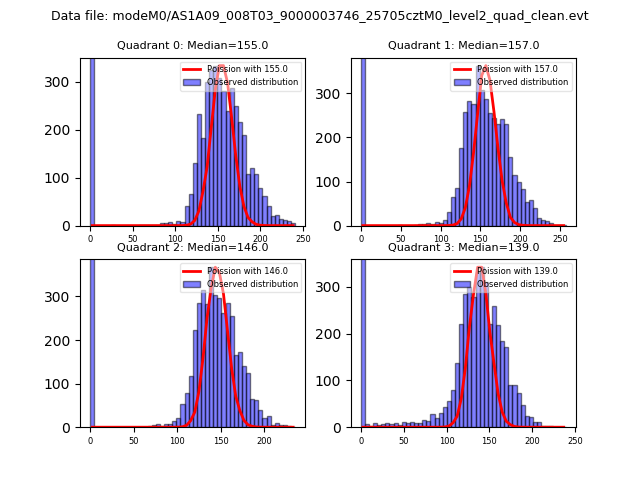 |
 |
| Quadrant-wise count rates Data is divided into 100 sec bins |
 |
|
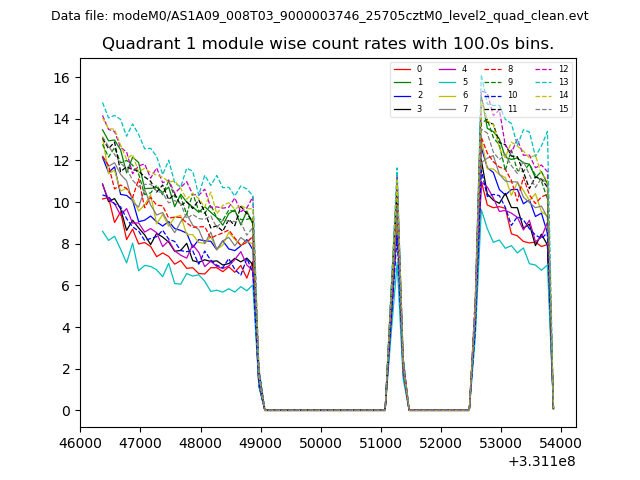
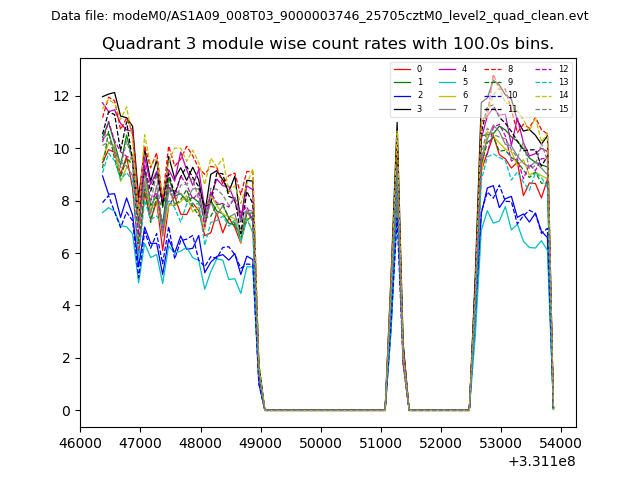
| Module-wise count rates for Quadrant A Data is divided into 100 sec bins |
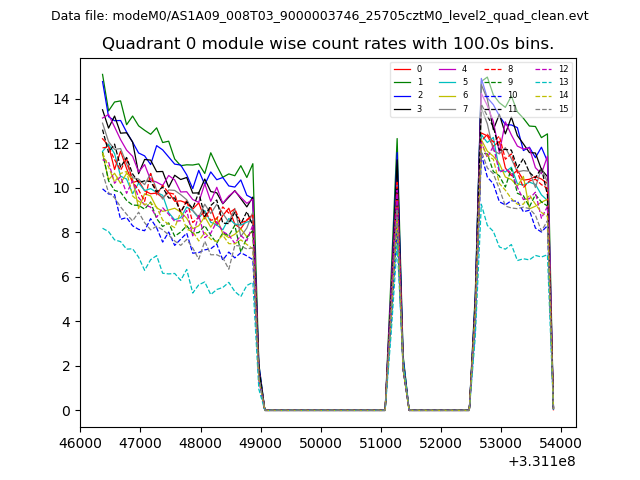 |
 |
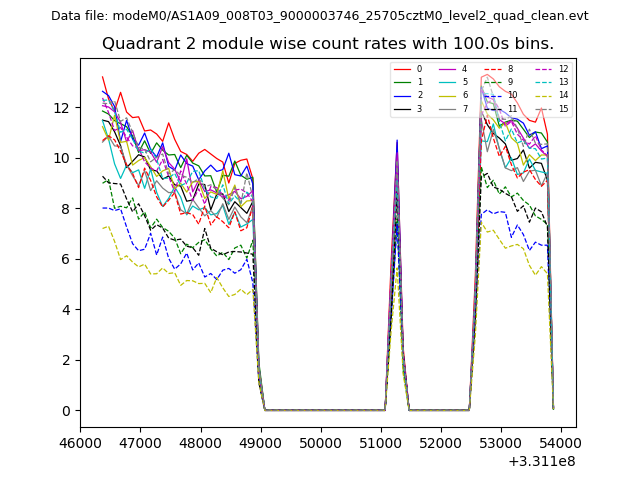
| Module-wise count rates for Quadrant B Data is divided into 100 sec bins |
 |
 |
| Module-wise count rates for Quadrant C Data is divided into 100 sec bins |
 |
 |
| Module-wise count rates for Quadrant D Data is divided into 100 sec bins |
 |
 |
| Parameter | Plot |
|---|---|
| CZT HV Monitor | 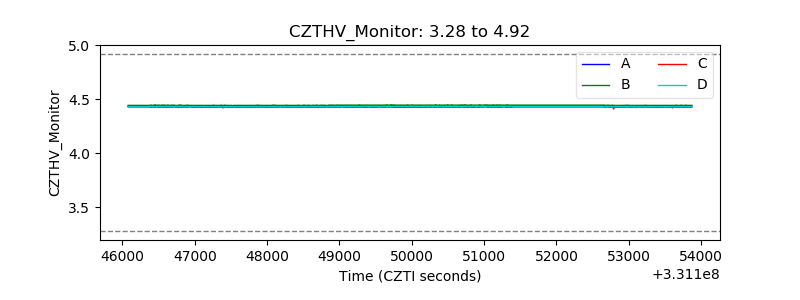 |
| D_VDD | 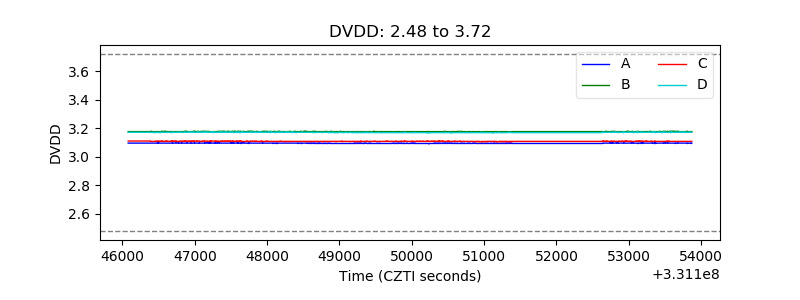 |
| Temperature 1 | 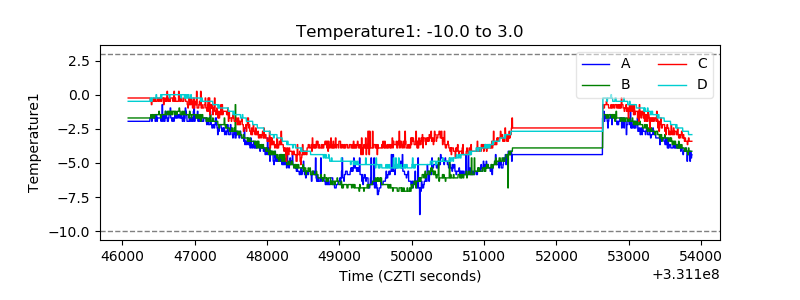 |
| Veto HV Monitor | 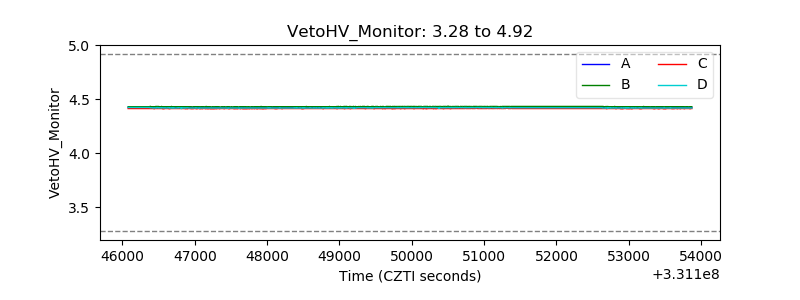 |
| Veto LLD | 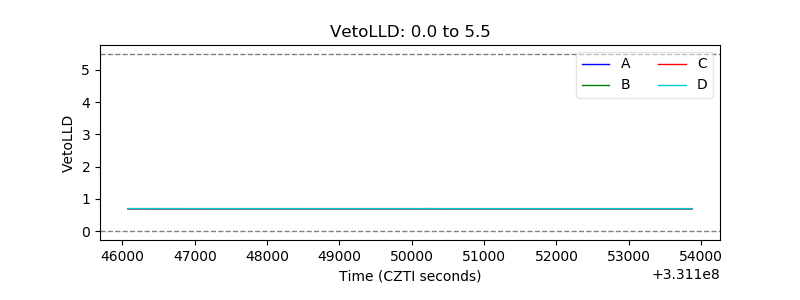 |
| Alpha Counter | 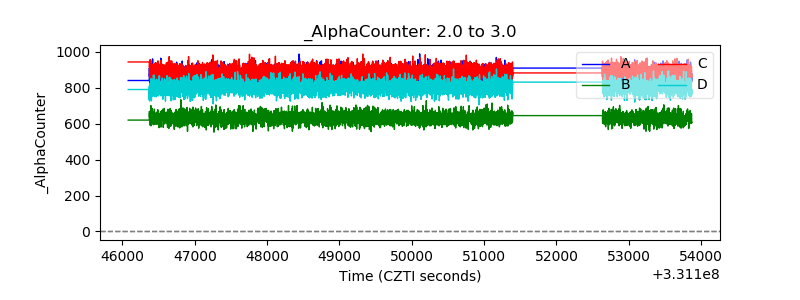 |
| _CPM_Rate | 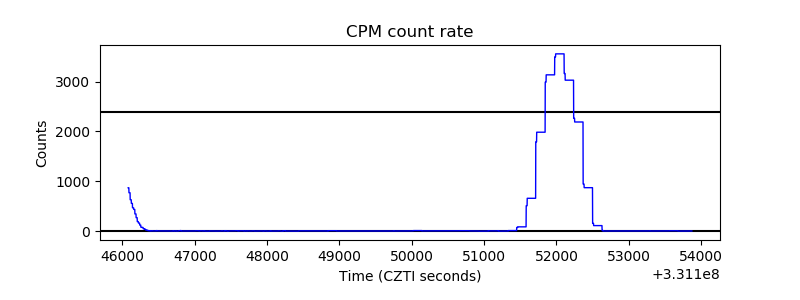 |
| CZT Counter | 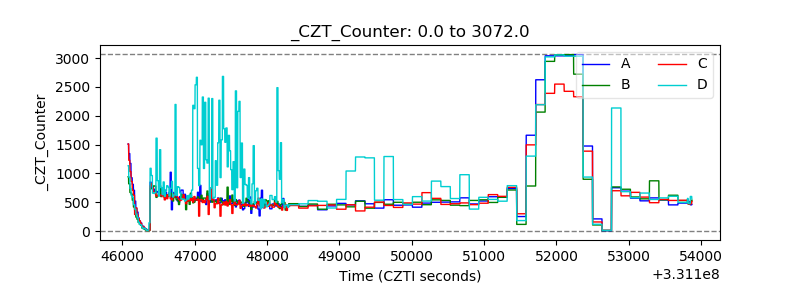 |
| +2.5 Volts monitor | 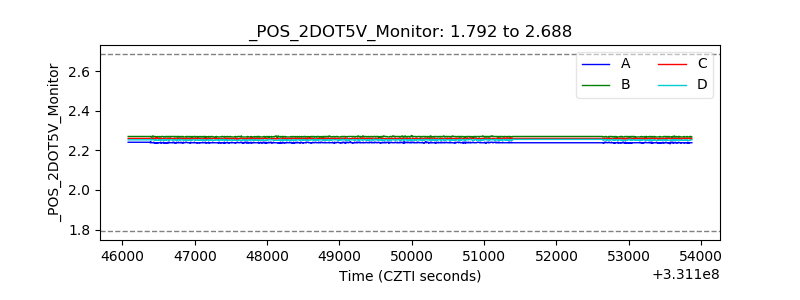 |
| +5 Volts monitor |  |
| _ROLL_ROT | 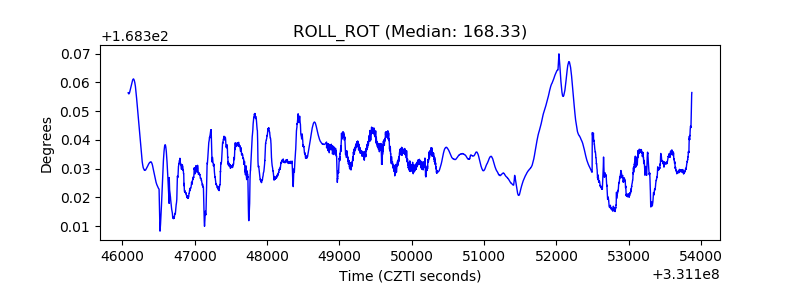 |
| _Roll_DEC | 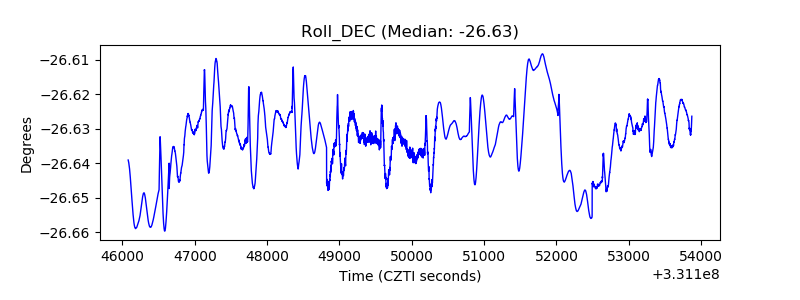 |
| _Roll_RA | 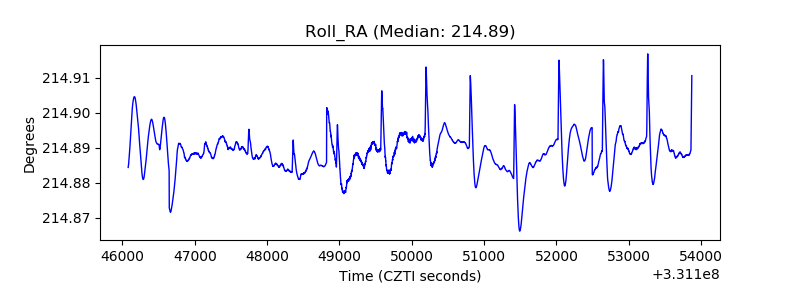 |
| Veto Counter | 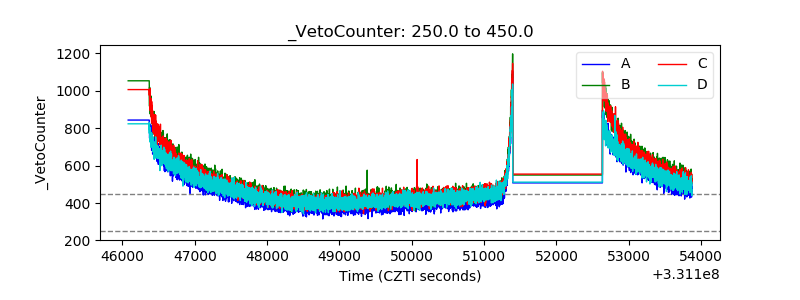 |