| Param | Original file | Final file |
|---|---|---|
| Filename | modeM0/AS1A09_008T03_9000003746_25706cztM0_level2.evt | modeM0/AS1A09_008T03_9000003746_25706cztM0_level2_quad_clean.evt |
| Size (bytes) | 462,997,440 | 95,160,960 |
| Size | 441.5 MB | 90.8 MB |
| Events in quadrant A | 3,200,792 | 635,260 |
| Events in quadrant B | 3,321,277 | 650,260 |
| Events in quadrant C | 3,495,444 | 594,694 |
| Events in quadrant D | 3,591,714 | 577,200 |
| Mode M9 | |||
|---|---|---|---|
| Quadrant | BADHDUFLAG | Total packets | Discarded packets |
| A | 0 | 17 | 0 |
| B | 0 | 18 | 0 |
| C | 0 | 18 | 0 |
| D | 0 | 18 | 0 |
| Mode M0 | |||
|---|---|---|---|
| Quadrant | BADHDUFLAG | Total packets | Discarded packets |
| A | 0 | 13279 | 0 |
| B | 0 | 13620 | 0 |
| C | 0 | 14215 | 0 |
| D | 0 | 14562 | 0 |
| Quadrant | Total seconds | Saturated seconds | Saturation percentage |
|---|---|---|---|
| A | 6078 | 40 | 0.658111% |
| B | 6078 | 53 | 0.871997% |
| C | 6078 | 173 | 2.846331% |
| D | 6078 | 116 | 1.908523% |
Noise dominated data is calculated using 1-second bins in cleaned event files. If a bin has >2000 counts, and if more than 50% of those come from <1% of pixels, then it is considered to be noise-dominated and hence unusable.
| Quadrant | # 1 sec bins | Bins with >0 counts | Bins with >2000 counts | High rate bins dominated by noise | Noise dominated (total time) | Noise dominated (detector-on time) | Marked lightcurve |
|---|---|---|---|---|---|---|---|
| A | 7423 | 6079 | 0 | 0 | 0.00% | 0.00% | 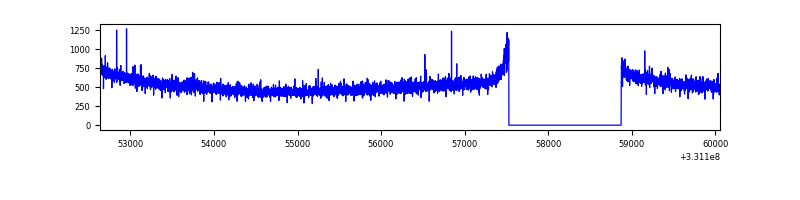 |
| B | 7423 | 6079 | 0 | 0 | 0.00% | 0.00% | 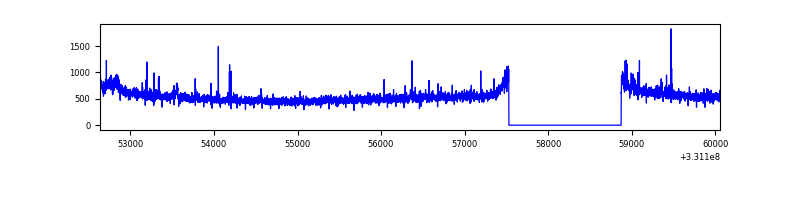 |
| C | 7423 | 6078 | 54 | 54 | 0.73% | 0.89% | 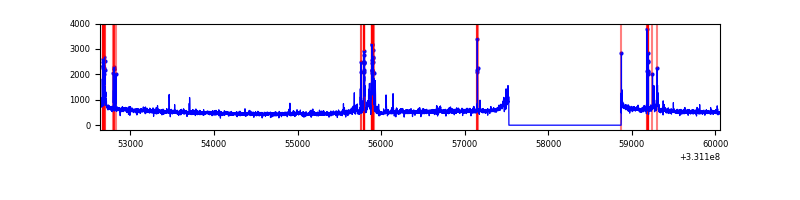 |
| D | 7423 | 6079 | 78 | 78 | 1.05% | 1.28% | 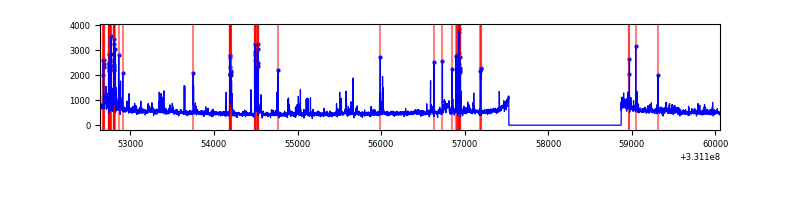 |
Top three noisy pixels from each quadrant. If the there are fewer than three noisy pixels in the level2.evt file, extra rows are filled as -1
| Pixel properties | Quadrant properties | ||||||
|---|---|---|---|---|---|---|---|
| Quadrant | DetID | PixID | Counts | Sigma | Mean | Median | Sigma |
| A | 0 | 13 | 10598 | 58.97 | 827 | 813 | 165.9 |
| A | 13 | 254 | 8728 | 47.7 | 827 | 813 | 165.9 |
| A | 0 | 226 | 7160 | 38.25 | 827 | 813 | 165.9 |
| B | 0 | 190 | 36009 | 229.5 | 823 | 807 | 153.4 |
| B | 0 | 219 | 28630 | 181.39 | 823 | 807 | 153.4 |
| B | 4 | 171 | 26131 | 165.1 | 823 | 807 | 153.4 |
| C | 3 | 233 | 355904 | 1969.74 | 773 | 781 | 180.3 |
| C | 14 | 238 | 126580 | 697.76 | 773 | 781 | 180.3 |
| C | 13 | 61 | 5524 | 26.31 | 773 | 781 | 180.3 |
| D | 7 | 80 | 357768 | 1874.72 | 779 | 757 | 190.4 |
| D | 8 | 195 | 112832 | 588.52 | 779 | 757 | 190.4 |
| D | 2 | 244 | 80667 | 419.62 | 779 | 757 | 190.4 |
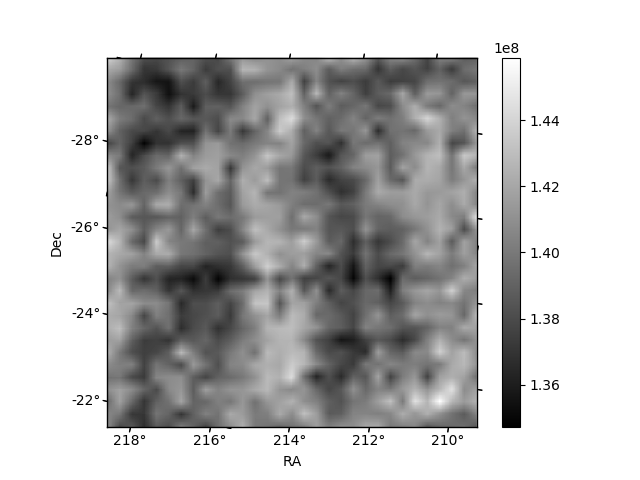
Histogram calculated using DETX and DETY for each event in the final _common_clean file
| Quadrant A | 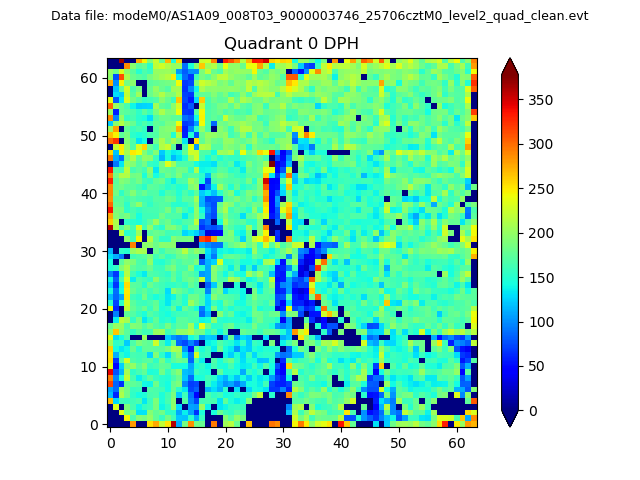 |
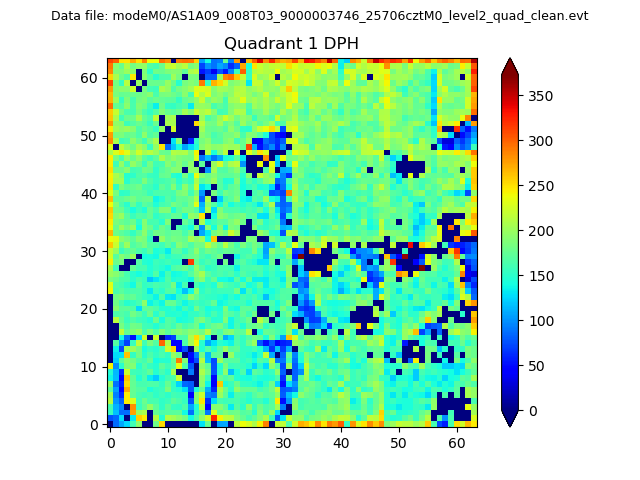 |
Quadrant B |
|---|---|---|---|
| Quadrant D | 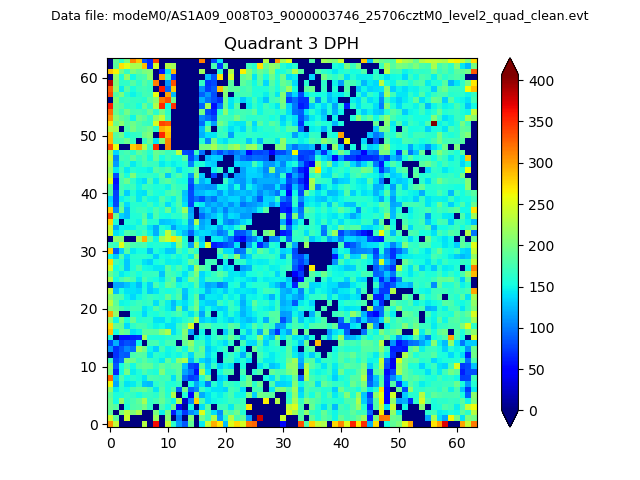 |
 |
Quadrant C |
| Plot type | Count rate plots | Images |
|---|---|---|
| Comparison with Poisson distribution Blue bars denote a histogram of data divided into 1 sec bins. Red curve is a Poisson curve with rate = median count rate of data. |
 |
 |
| Quadrant-wise count rates Data is divided into 100 sec bins |
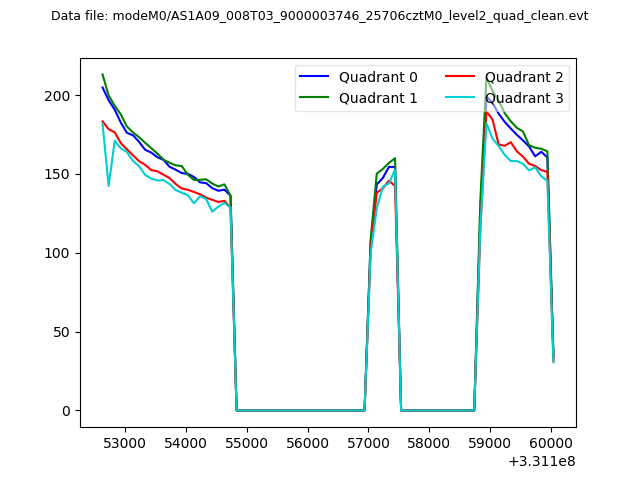 |
|
| Module-wise count rates for Quadrant A Data is divided into 100 sec bins |
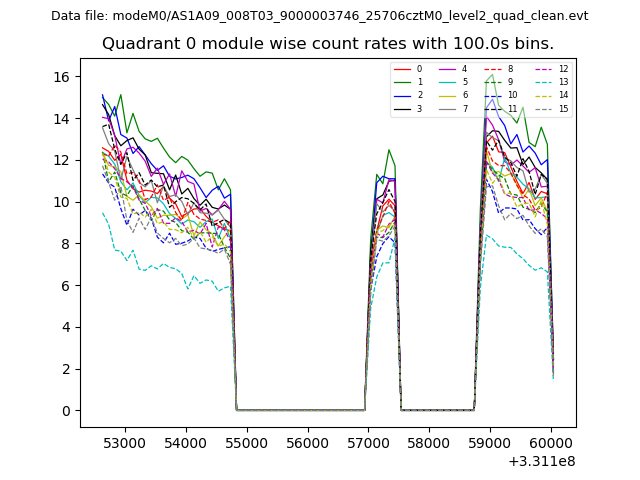 |
 |
| Module-wise count rates for Quadrant B Data is divided into 100 sec bins |
 |
 |
| Module-wise count rates for Quadrant C Data is divided into 100 sec bins |
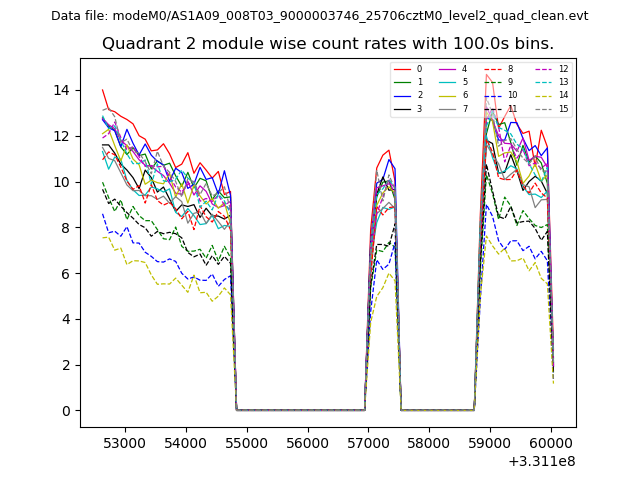 |
 |
| Module-wise count rates for Quadrant D Data is divided into 100 sec bins |
 |
 |
| Parameter | Plot |
|---|---|
| CZT HV Monitor | 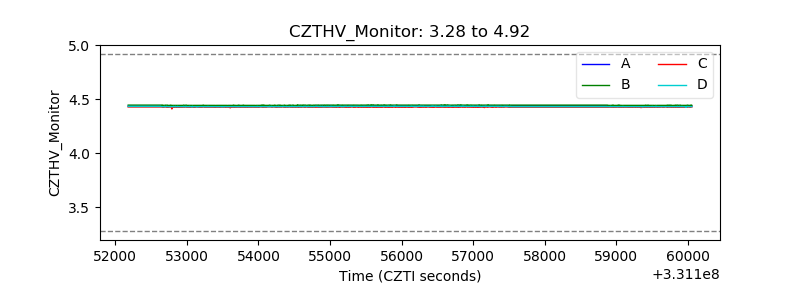 |
| D_VDD | 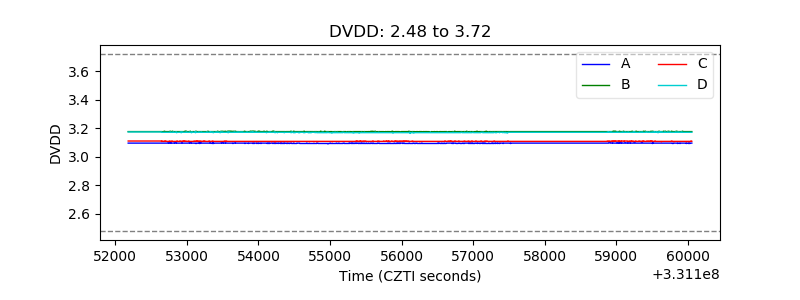 |
| Temperature 1 | 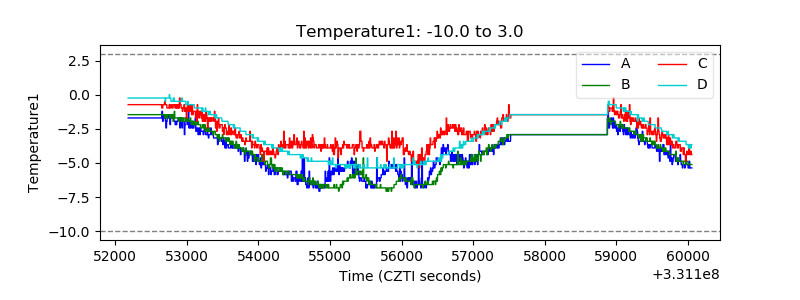 |
| Veto HV Monitor | 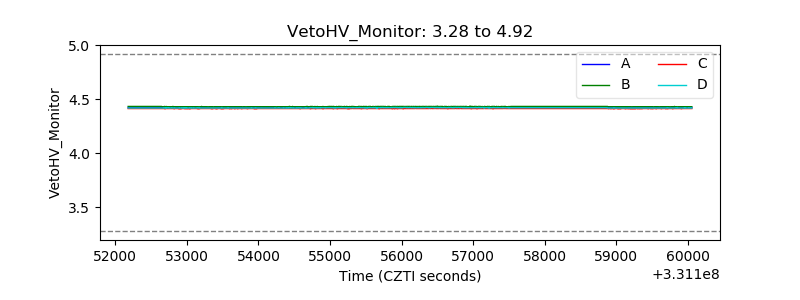 |
| Veto LLD | 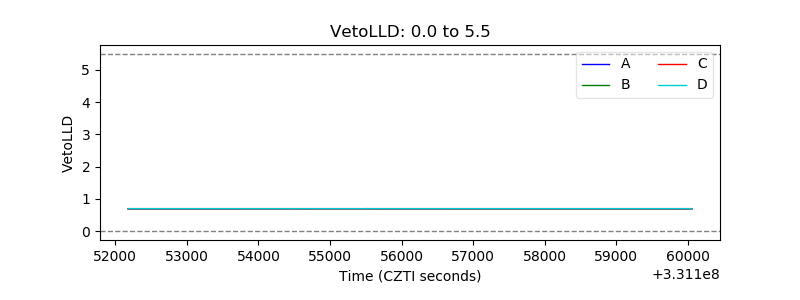 |
| Alpha Counter | 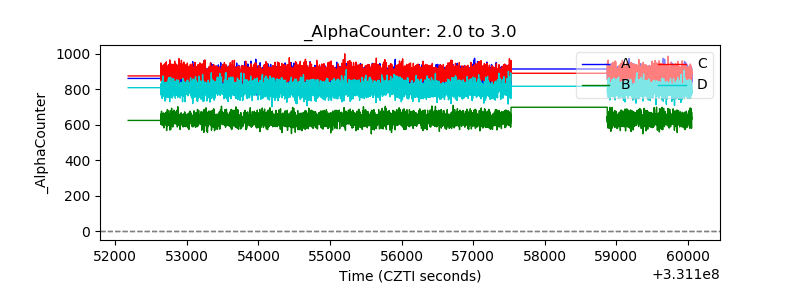 |
| _CPM_Rate | 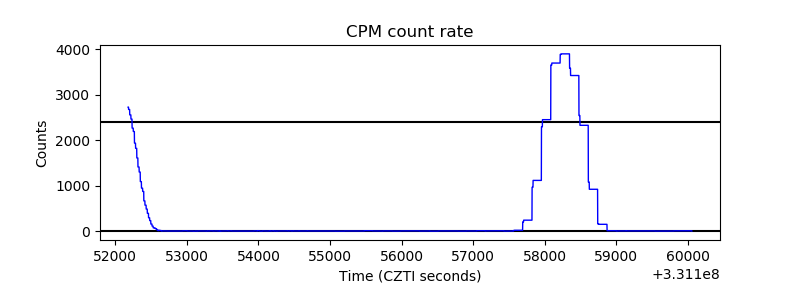 |
| CZT Counter | 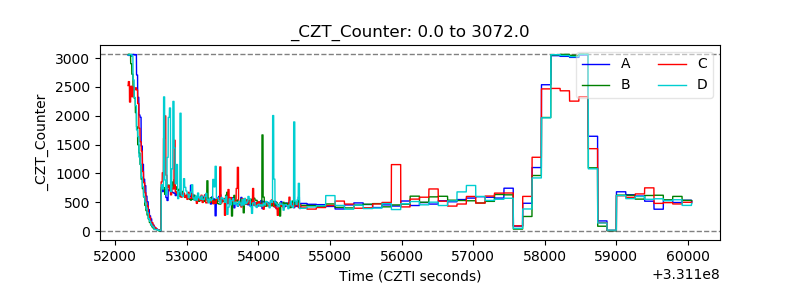 |
| +2.5 Volts monitor |  |
| +5 Volts monitor |  |
| _ROLL_ROT | 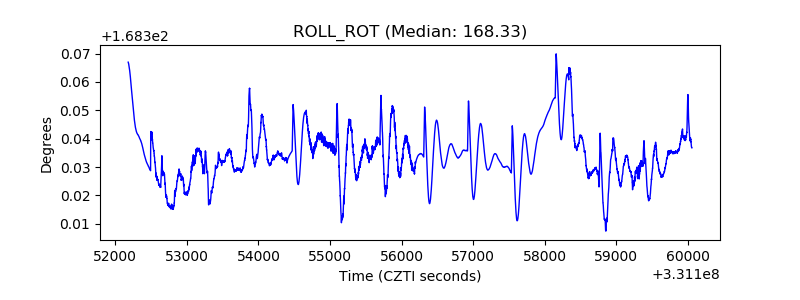 |
| _Roll_DEC | 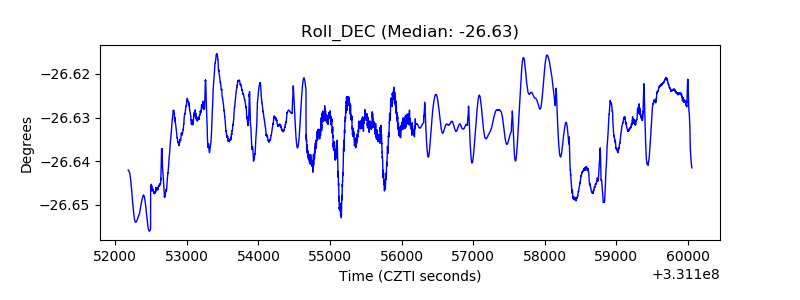 |
| _Roll_RA | 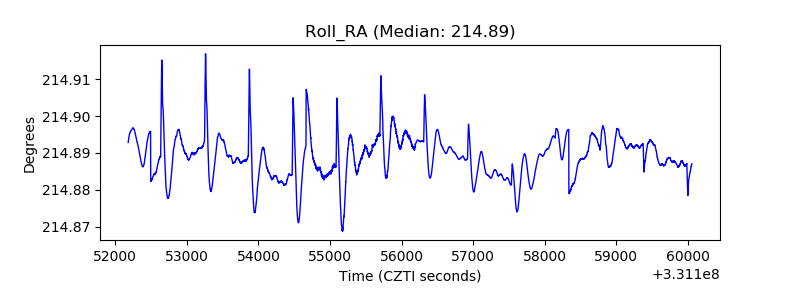 |
| Veto Counter |  |