| Param | Original file | Final file |
|---|---|---|
| Filename | modeM0/AS1A09_008T03_9000003746_25708cztM0_level2.evt | modeM0/AS1A09_008T03_9000003746_25708cztM0_level2_quad_clean.evt |
| Size (bytes) | 441,789,120 | 92,082,240 |
| Size | 421.3 MB | 87.8 MB |
| Events in quadrant A | 3,225,427 | 612,104 |
| Events in quadrant B | 3,236,179 | 630,048 |
| Events in quadrant C | 3,196,932 | 577,657 |
| Events in quadrant D | 3,320,834 | 557,234 |
| Mode M9 | |||
|---|---|---|---|
| Quadrant | BADHDUFLAG | Total packets | Discarded packets |
| A | 0 | 18 | 0 |
| B | 0 | 19 | 0 |
| C | 0 | 19 | 0 |
| D | 0 | 19 | 0 |
| Mode M0 | |||
|---|---|---|---|
| Quadrant | BADHDUFLAG | Total packets | Discarded packets |
| A | 0 | 13096 | 0 |
| B | 0 | 13169 | 0 |
| C | 0 | 13053 | 0 |
| D | 0 | 13541 | 0 |
| Quadrant | Total seconds | Saturated seconds | Saturation percentage |
|---|---|---|---|
| A | 5892 | 61 | 1.035302% |
| B | 5892 | 59 | 1.001358% |
| C | 5892 | 89 | 1.510523% |
| D | 5892 | 45 | 0.763747% |
Noise dominated data is calculated using 1-second bins in cleaned event files. If a bin has >2000 counts, and if more than 50% of those come from <1% of pixels, then it is considered to be noise-dominated and hence unusable.
| Quadrant | # 1 sec bins | Bins with >0 counts | Bins with >2000 counts | High rate bins dominated by noise | Noise dominated (total time) | Noise dominated (detector-on time) | Marked lightcurve |
|---|---|---|---|---|---|---|---|
| A | 7277 | 5893 | 24 | 24 | 0.33% | 0.41% | 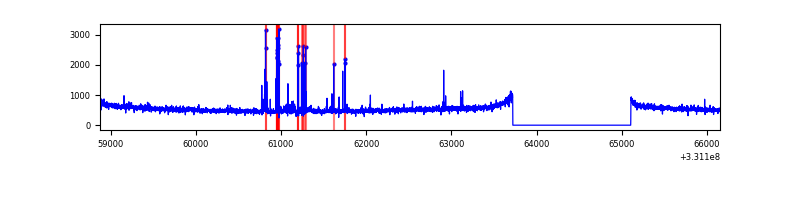 |
| B | 7277 | 5893 | 0 | 0 | 0.00% | 0.00% | 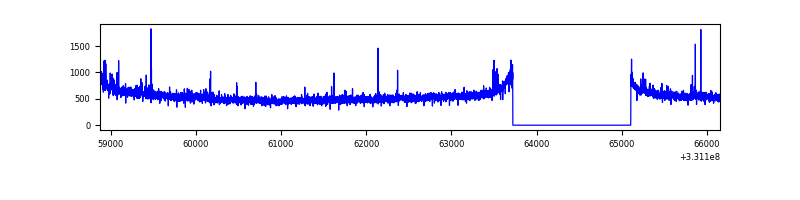 |
| C | 7277 | 5892 | 11 | 11 | 0.15% | 0.19% | 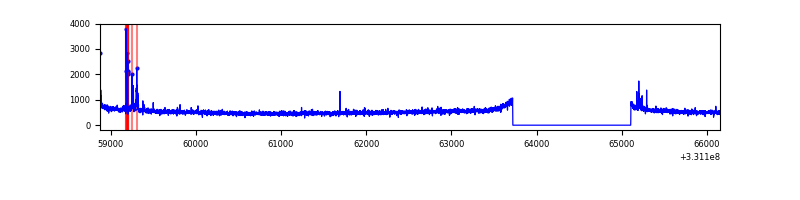 |
| D | 7277 | 5893 | 26 | 26 | 0.36% | 0.44% | 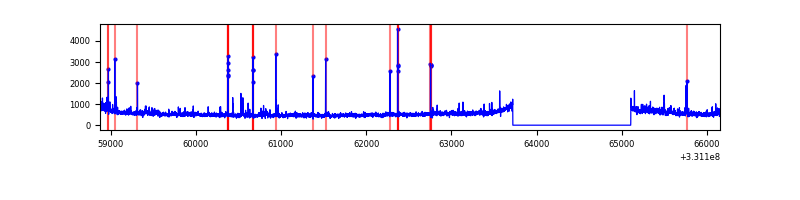 |
Top three noisy pixels from each quadrant. If the there are fewer than three noisy pixels in the level2.evt file, extra rows are filled as -1
| Pixel properties | Quadrant properties | ||||||
|---|---|---|---|---|---|---|---|
| Quadrant | DetID | PixID | Counts | Sigma | Mean | Median | Sigma |
| A | 0 | 13 | 111324 | 689.28 | 806 | 793 | 160.4 |
| A | 6 | 16 | 8824 | 50.08 | 806 | 793 | 160.4 |
| A | 13 | 254 | 8660 | 49.06 | 806 | 793 | 160.4 |
| B | 4 | 171 | 22279 | 141.42 | 808 | 790 | 152.0 |
| B | 0 | 245 | 21628 | 137.13 | 808 | 790 | 152.0 |
| B | 0 | 219 | 18169 | 114.37 | 808 | 790 | 152.0 |
| C | 14 | 238 | 124522 | 696.97 | 763 | 771 | 177.6 |
| C | 3 | 233 | 93712 | 523.45 | 763 | 771 | 177.6 |
| C | 13 | 61 | 5471 | 26.47 | 763 | 771 | 177.6 |
| D | 8 | 195 | 171420 | 924.34 | 762 | 740 | 184.7 |
| D | 7 | 80 | 91299 | 490.43 | 762 | 740 | 184.7 |
| D | 2 | 244 | 79260 | 425.23 | 762 | 740 | 184.7 |
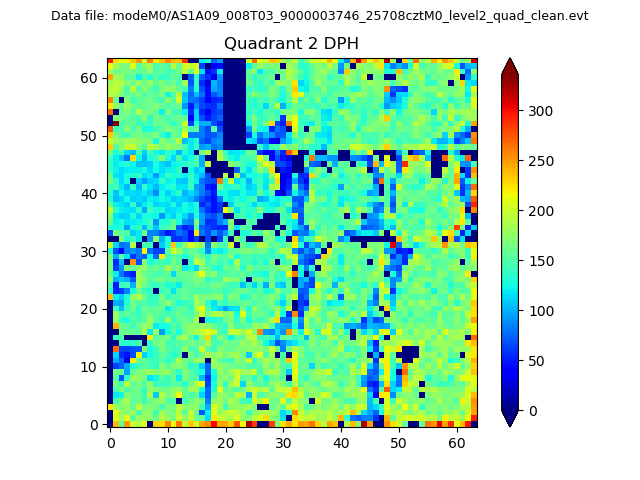
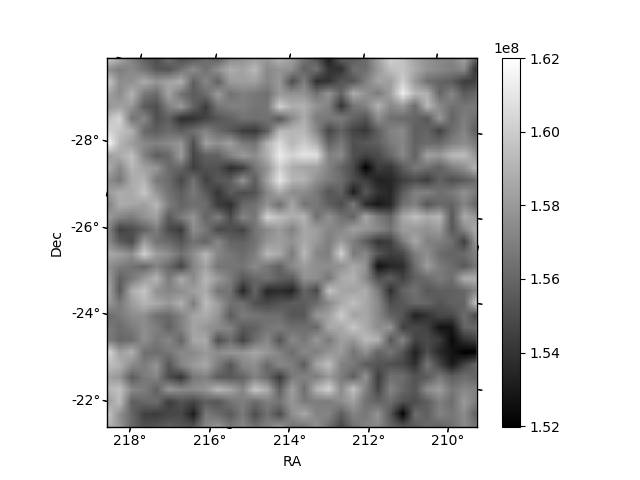
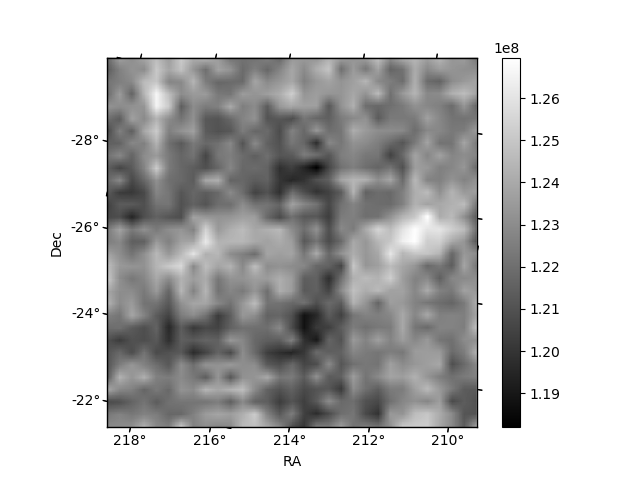
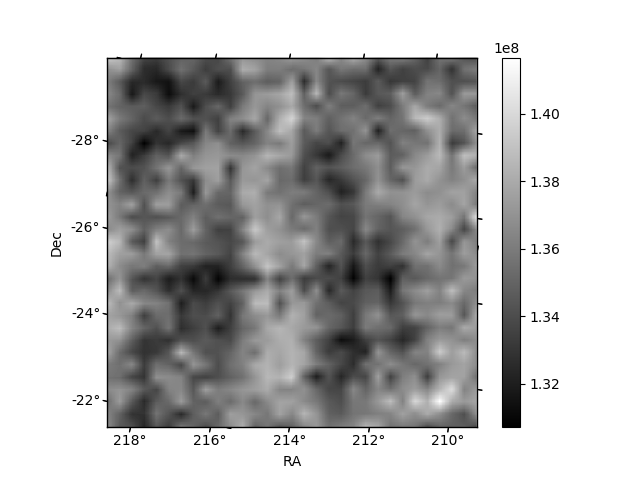
Histogram calculated using DETX and DETY for each event in the final _common_clean file
| Quadrant A | 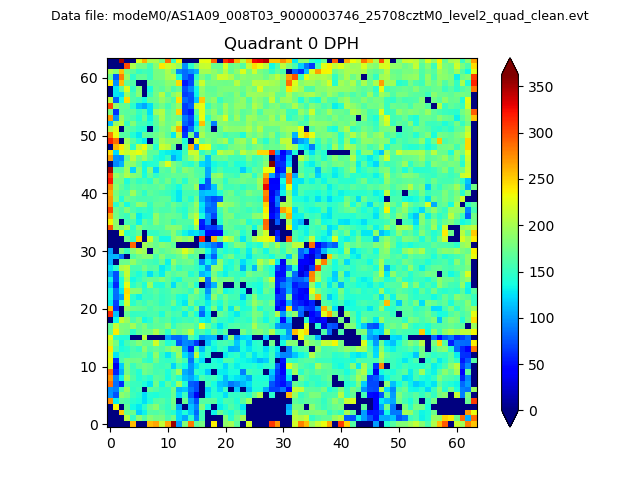 |
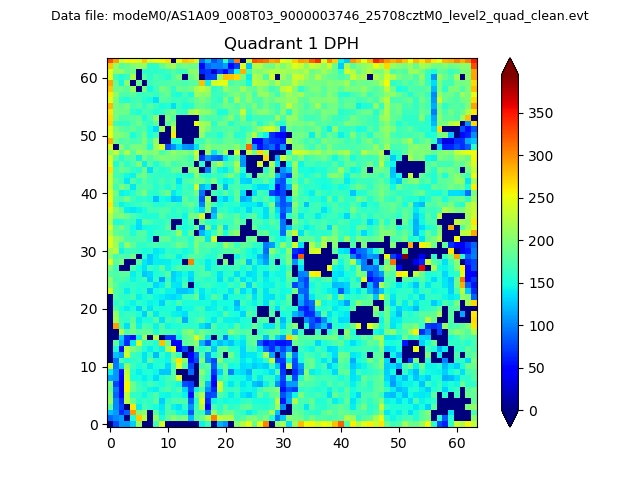 |
Quadrant B |
|---|---|---|---|
| Quadrant D | 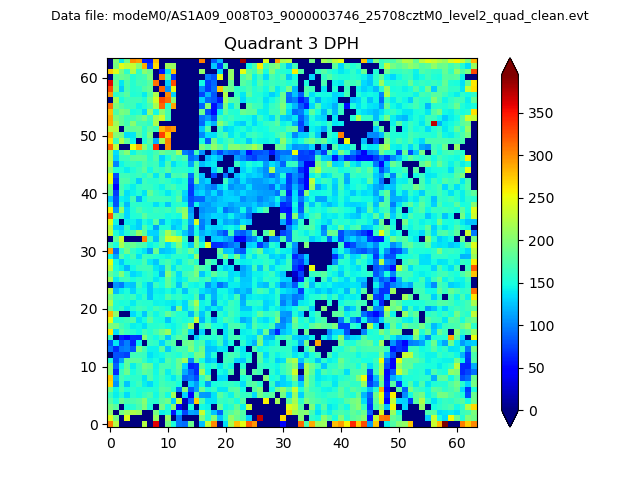 |
 |
Quadrant C |
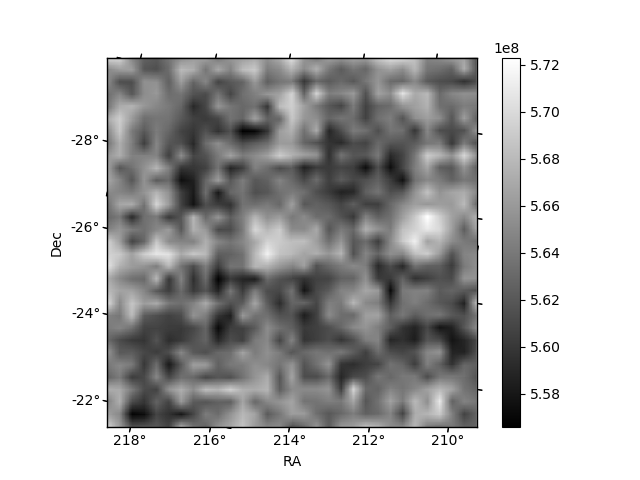
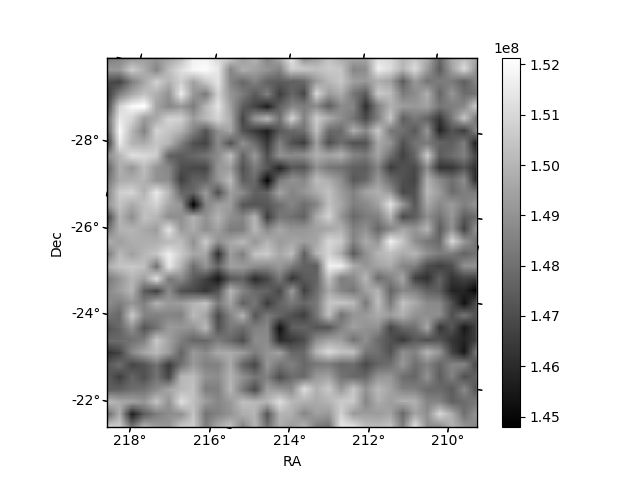
| Plot type | Count rate plots | Images |
|---|---|---|
| Comparison with Poisson distribution Blue bars denote a histogram of data divided into 1 sec bins. Red curve is a Poisson curve with rate = median count rate of data. |
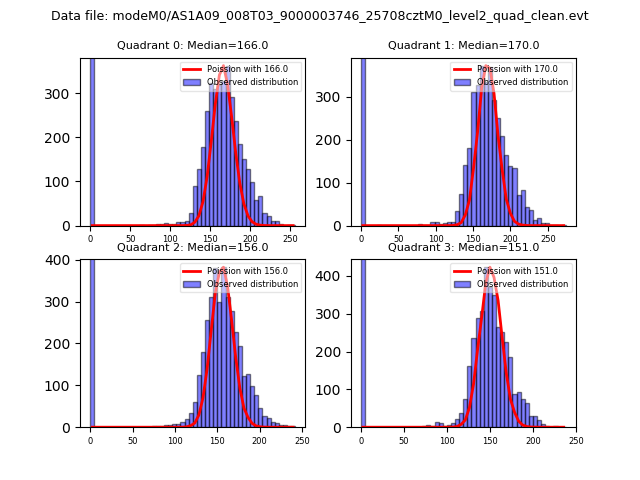 |
 |
| Quadrant-wise count rates Data is divided into 100 sec bins |
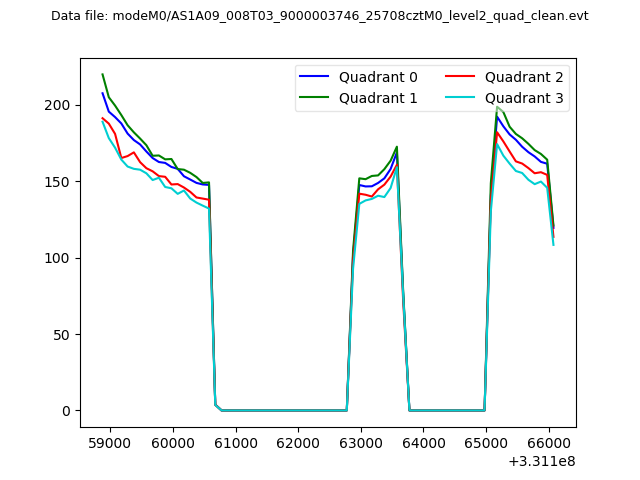 |
|
| Module-wise count rates for Quadrant A Data is divided into 100 sec bins |
 |
 |
| Module-wise count rates for Quadrant B Data is divided into 100 sec bins |
 |
 |
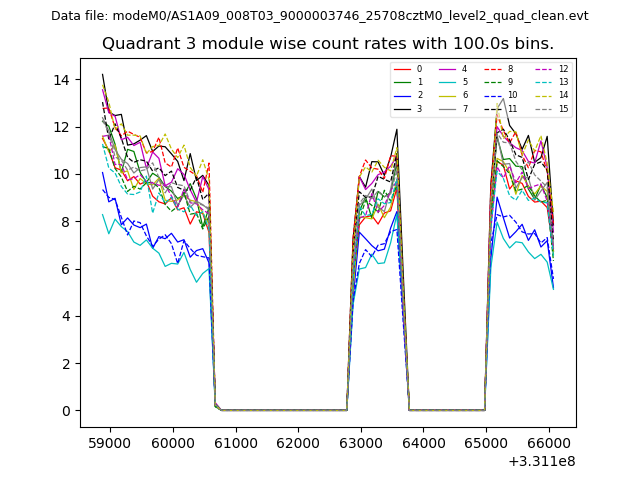
| Module-wise count rates for Quadrant C Data is divided into 100 sec bins |
 |
 |
| Module-wise count rates for Quadrant D Data is divided into 100 sec bins |
 |
 |
| Parameter | Plot |
|---|---|
| CZT HV Monitor | 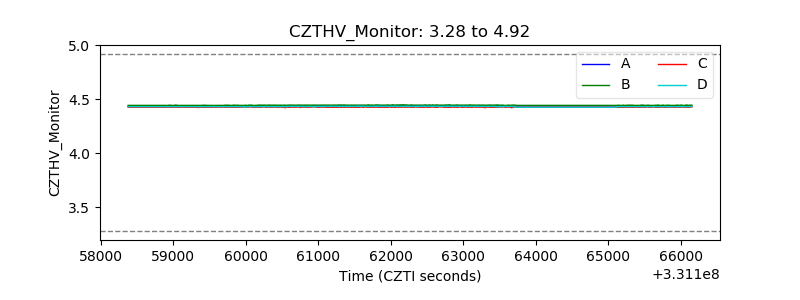 |
| D_VDD | 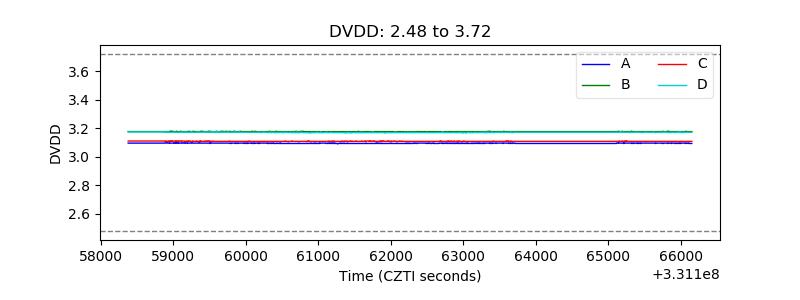 |
| Temperature 1 | 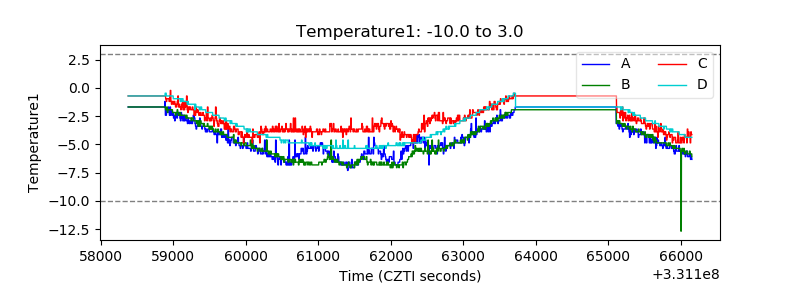 |
| Veto HV Monitor | 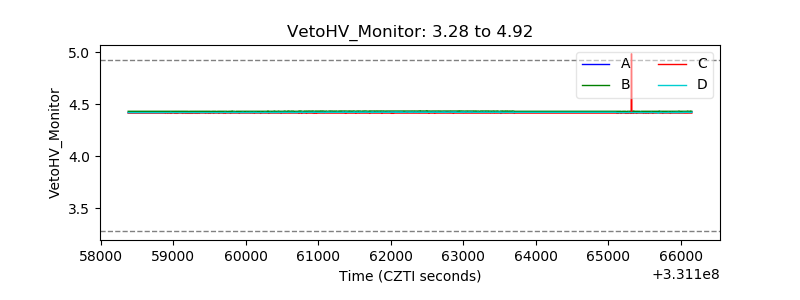 |
| Veto LLD | 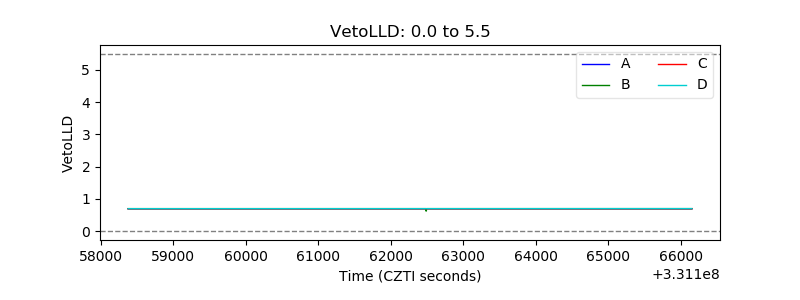 |
| Alpha Counter | 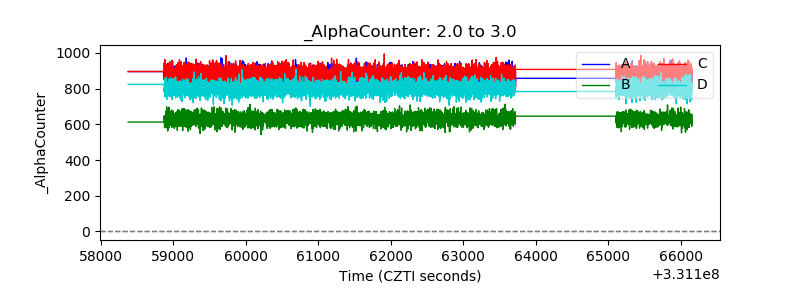 |
| _CPM_Rate | 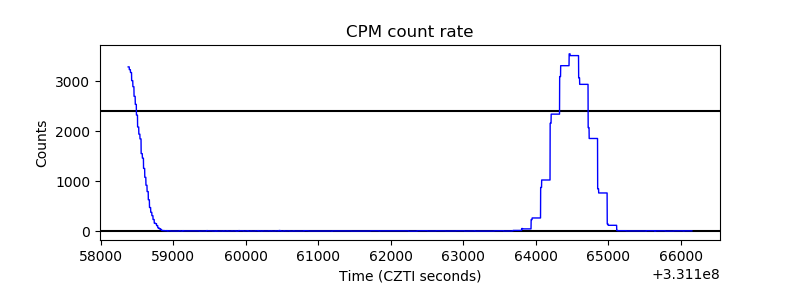 |
| CZT Counter | 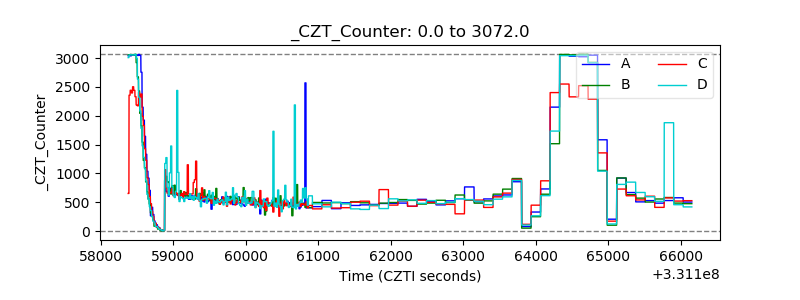 |
| +2.5 Volts monitor |  |
| +5 Volts monitor |  |
| _ROLL_ROT | 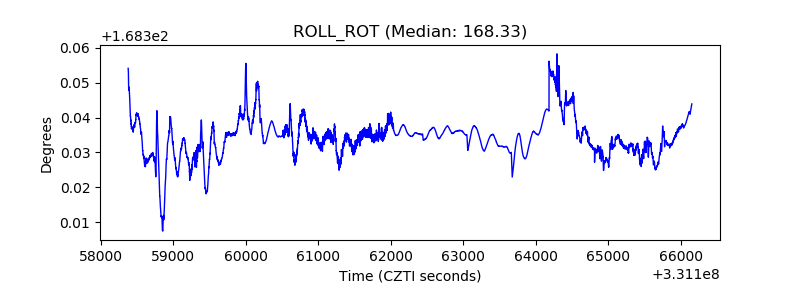 |
| _Roll_DEC | 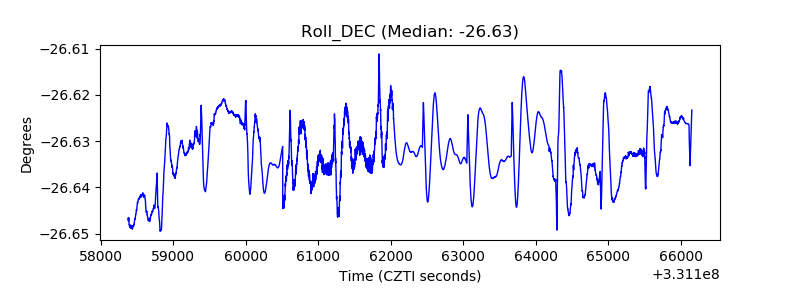 |
| _Roll_RA | 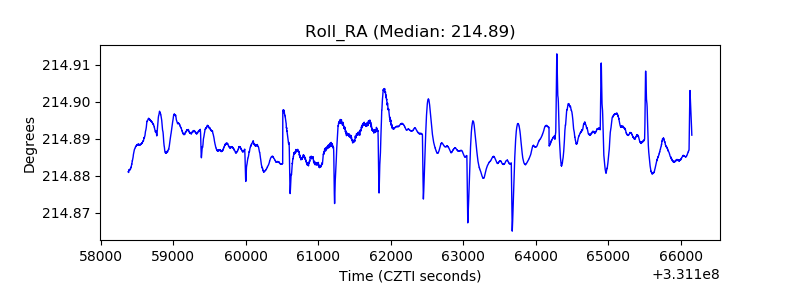 |
| Veto Counter | 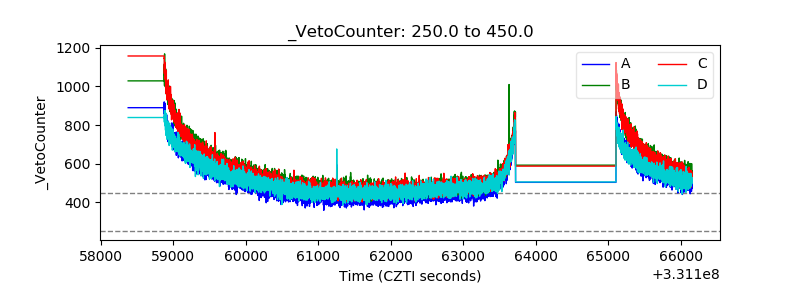 |