| Param | Original file | Final file |
|---|---|---|
| Filename | modeM0/AS1A09_008T06_9000003748cztM0_level2.fits | modeM0/AS1A09_008T06_9000003748cztM0_level2_quad_clean.evt |
| Size (bytes) | 1,515,409,920 | 1,243,713,600 |
| Size | 1.4 GB | 1.2 GB |
| Events in quadrant A | 9,483,576 | 7,245,756 |
| Events in quadrant B | 9,191,142 | 7,397,055 |
| Events in quadrant C | 9,374,206 | 6,984,167 |
| Events in quadrant D | 7,573,398 | 5,772,596 |
| Mode M0 | |||
|---|---|---|---|
| Quadrant | BADHDUFLAG | Total packets | Discarded packets |
| A | 0 | 326399 | 0 |
| B | 0 | 325999 | 0 |
| C | 0 | 325143 | 0 |
| D | 0 | 487809 | 0 |
| Mode SS | |||
|---|---|---|---|
| Quadrant | BADHDUFLAG | Total packets | Discarded packets |
| A | 0 | 3064 | 0 |
| B | 0 | 3068 | 0 |
| C | 0 | 3064 | 0 |
| D | 0 | 3062 | 0 |
| Mode M9 | |||
|---|---|---|---|
| Quadrant | BADHDUFLAG | Total packets | Discarded packets |
| A | 0 | 257 | 0 |
| B | 0 | 257 | 0 |
| C | 0 | 257 | 0 |
| D | 0 | 257 | 0 |
| Quadrant | Total seconds | Saturated seconds | Saturation percentage |
|---|---|---|---|
| A | 149730 | 3172 | 2.118480% |
| B | 149829 | 2557 | 1.706612% |
| C | 149895 | 3449 | 2.300944% |
| D | 149638 | 17156 | 11.465002% |
Noise dominated data is calculated using 1-second bins in cleaned event files. If a bin has >2000 counts, and if more than 50% of those come from <1% of pixels, then it is considered to be noise-dominated and hence unusable.
| Quadrant | # 1 sec bins | Bins with >0 counts | Bins with >2000 counts | High rate bins dominated by noise | Noise dominated (total time) | Noise dominated (detector-on time) | Marked lightcurve |
|---|---|---|---|---|---|---|---|
| A | 179589 | 150219 | 0 | 0 | 0.00% | 0.00% |  |
| B | 179589 | 150515 | 0 | 0 | 0.00% | 0.00% |  |
| C | 179589 | 150549 | 0 | 0 | 0.00% | 0.00% |  |
| D | 179589 | 146849 | 0 | 0 | 0.00% | 0.00% |  |
Top three noisy pixels from each quadrant. If the there are fewer than three noisy pixels in the level2.evt file, extra rows are filled as -1
| Pixel properties | Quadrant properties | ||||||
|---|---|---|---|---|---|---|---|
| Quadrant | DetID | PixID | Counts | Sigma | Mean | Median | Sigma |
| A | 0 | 29 | 7784 | 9.13 | 2471 | 2323 | 597.9 |
| A | 7 | 110 | 7545 | 8.73 | 2471 | 2323 | 597.9 |
| A | 9 | 19 | 6987 | 7.8 | 2471 | 2323 | 597.9 |
| B | 2 | 9 | 7404 | 10.8 | 2431 | 2327 | 469.9 |
| B | 2 | 8 | 6216 | 8.28 | 2431 | 2327 | 469.9 |
| B | 5 | 128 | 6021 | 7.86 | 2431 | 2327 | 469.9 |
| C | 12 | 241 | 6493 | 6.67 | 2481 | 2327 | 624.8 |
| C | 9 | 209 | 6258 | 6.29 | 2481 | 2327 | 624.8 |
| C | 3 | 126 | 6202 | 6.2 | 2481 | 2327 | 624.8 |
| D | 6 | 231 | 5452 | 6.13 | 2168 | 1977 | 566.8 |
| D | 7 | 3 | 5415 | 6.07 | 2168 | 1977 | 566.8 |
| D | 10 | 189 | 5367 | 5.98 | 2168 | 1977 | 566.8 |
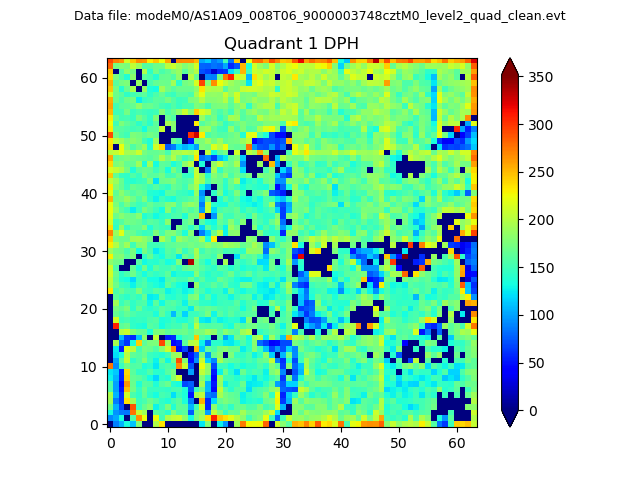
Histogram calculated using DETX and DETY for each event in the final _common_clean file
| Quadrant A |  |
 |
Quadrant B |
|---|---|---|---|
| Quadrant D |  |
 |
Quadrant C |
| Plot type | Count rate plots | Images |
|---|---|---|
| Comparison with Poisson distribution Blue bars denote a histogram of data divided into 1 sec bins. Red curve is a Poisson curve with rate = median count rate of data. |
 |
 |
| Quadrant-wise count rates Data is divided into 100 sec bins |
 |
|
| Module-wise count rates for Quadrant A Data is divided into 100 sec bins |
 |
 |
| Module-wise count rates for Quadrant B Data is divided into 100 sec bins |
 |
 |
| Module-wise count rates for Quadrant C Data is divided into 100 sec bins |
 |
 |
| Module-wise count rates for Quadrant D Data is divided into 100 sec bins |
 |
 |
| Parameter | Plot |
|---|---|
| CZT HV Monitor |  |
| D_VDD |  |
| Temperature 1 |  |
| Veto HV Monitor |  |
| Veto LLD |  |
| Alpha Counter |  |
| _CPM_Rate |  |
| CZT Counter |  |
| +2.5 Volts monitor |  |
| +5 Volts monitor |  |
| _ROLL_ROT |  |
| _Roll_DEC |  |
| _Roll_RA |  |
| Veto Counter |  |