| Param | Original file | Final file |
|---|---|---|
| Filename | modeM0/AS1A09_008T06_9000003748_25708cztM0_level2.evt | modeM0/AS1A09_008T06_9000003748_25708cztM0_level2_quad_clean.evt |
| Size (bytes) | 310,780,800 | 58,622,400 |
| Size | 296.4 MB | 55.9 MB |
| Events in quadrant A | 2,984,399 | 345,691 |
| Events in quadrant B | 1,939,659 | 413,924 |
| Events in quadrant C | 1,904,400 | 389,192 |
| Events in quadrant D | 2,339,141 | 372,618 |
| Mode M0 | |||
|---|---|---|---|
| Quadrant | BADHDUFLAG | Total packets | Discarded packets |
| A | 0 | 11114 | 0 |
| B | 0 | 8004 | 0 |
| C | 0 | 7897 | 0 |
| D | 0 | 9443 | 0 |
| Mode M9 | |||
|---|---|---|---|
| Quadrant | BADHDUFLAG | Total packets | Discarded packets |
| A | 0 | 13 | 0 |
| B | 0 | 13 | 0 |
| C | 0 | 13 | 0 |
| D | 0 | 13 | 0 |
| Quadrant | Total seconds | Saturated seconds | Saturation percentage |
|---|---|---|---|
| A | 3577 | 570 | 15.935141% |
| B | 3577 | 95 | 2.655857% |
| C | 3577 | 116 | 3.242941% |
| D | 3577 | 123 | 3.438636% |
Noise dominated data is calculated using 1-second bins in cleaned event files. If a bin has >2000 counts, and if more than 50% of those come from <1% of pixels, then it is considered to be noise-dominated and hence unusable.
| Quadrant | # 1 sec bins | Bins with >0 counts | Bins with >2000 counts | High rate bins dominated by noise | Noise dominated (total time) | Noise dominated (detector-on time) | Marked lightcurve |
|---|---|---|---|---|---|---|---|
| A | 4937 | 3578 | 483 | 483 | 9.78% | 13.50% | 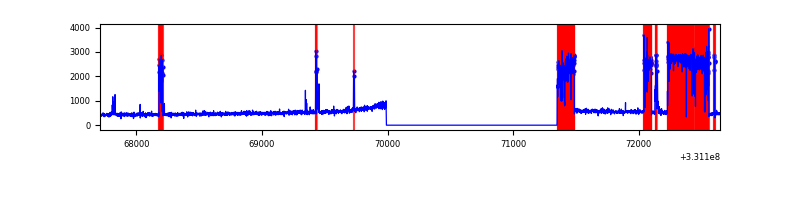 |
| B | 4937 | 3577 | 1 | 1 | 0.02% | 0.03% | 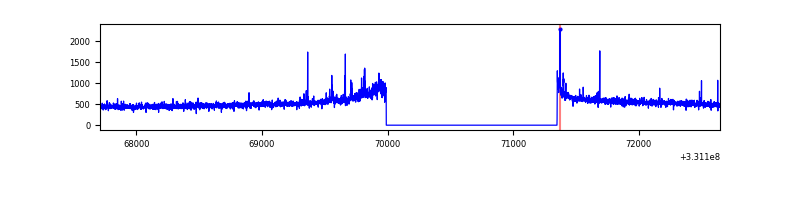 |
| C | 4937 | 3578 | 0 | 0 | 0.00% | 0.00% | 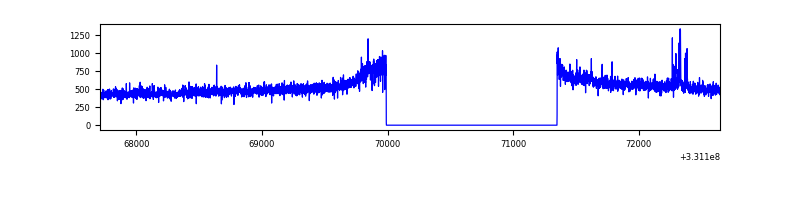 |
| D | 4937 | 3578 | 35 | 35 | 0.71% | 0.98% | 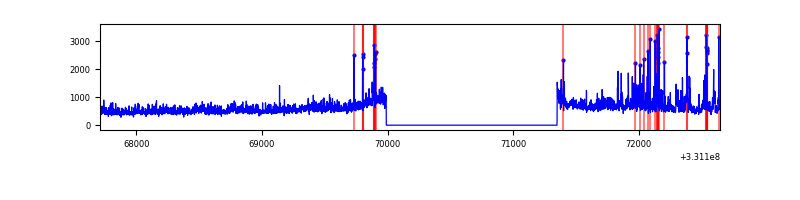 |
Top three noisy pixels from each quadrant. If the there are fewer than three noisy pixels in the level2.evt file, extra rows are filled as -1
| Pixel properties | Quadrant properties | ||||||
|---|---|---|---|---|---|---|---|
| Quadrant | DetID | PixID | Counts | Sigma | Mean | Median | Sigma |
| A | 0 | 13 | 1298885 | 14644.97 | 437 | 428 | 88.7 |
| A | 13 | 254 | 4571 | 46.73 | 437 | 428 | 88.7 |
| A | 3 | 137 | 3879 | 38.92 | 437 | 428 | 88.7 |
| B | 0 | 190 | 25172 | 270.92 | 478 | 468 | 91.2 |
| B | 0 | 245 | 14644 | 155.46 | 478 | 468 | 91.2 |
| B | 0 | 219 | 14537 | 154.29 | 478 | 468 | 91.2 |
| C | 14 | 238 | 73152 | 679.05 | 459 | 462 | 107.0 |
| C | 3 | 233 | 38875 | 358.84 | 459 | 462 | 107.0 |
| C | 1 | 16 | 3625 | 29.55 | 459 | 462 | 107.0 |
| D | 8 | 195 | 256119 | 2297.15 | 459 | 445 | 111.3 |
| D | 7 | 80 | 239776 | 2150.31 | 459 | 445 | 111.3 |
| D | 2 | 244 | 59430 | 529.96 | 459 | 445 | 111.3 |
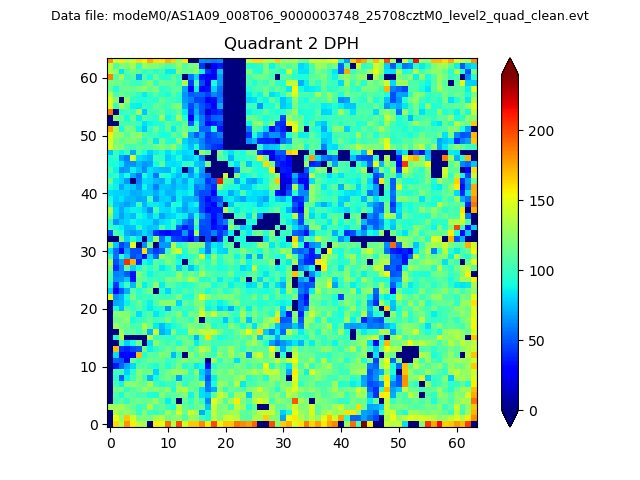
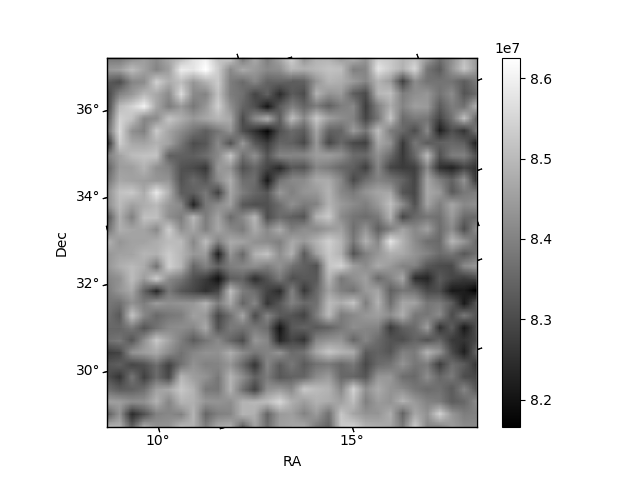
Histogram calculated using DETX and DETY for each event in the final _common_clean file
| Quadrant A | 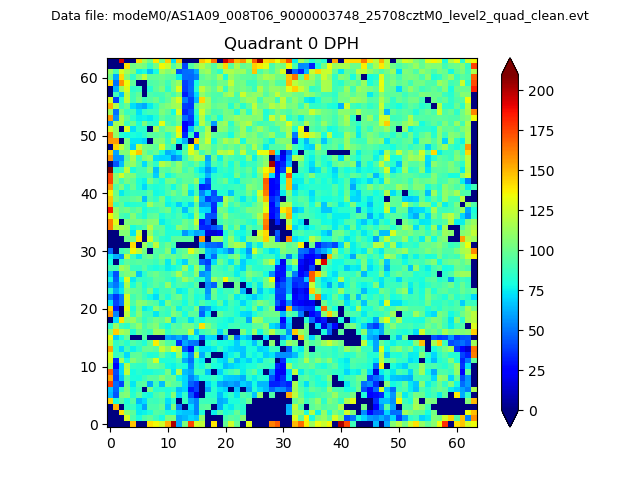 |
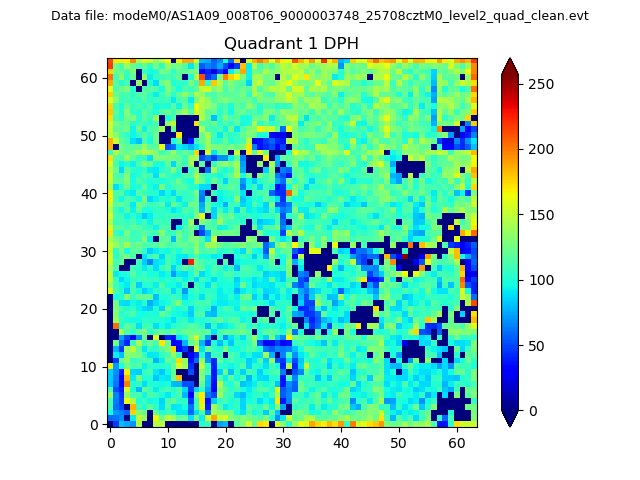 |
Quadrant B |
|---|---|---|---|
| Quadrant D | 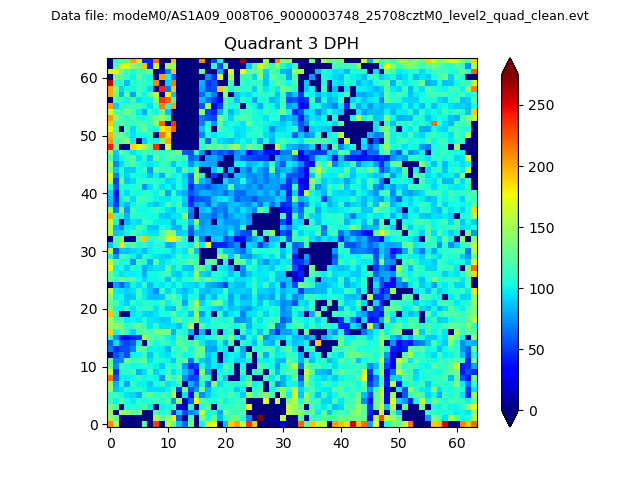 |
 |
Quadrant C |
| Plot type | Count rate plots | Images |
|---|---|---|
| Comparison with Poisson distribution Blue bars denote a histogram of data divided into 1 sec bins. Red curve is a Poisson curve with rate = median count rate of data. |
 |
 |
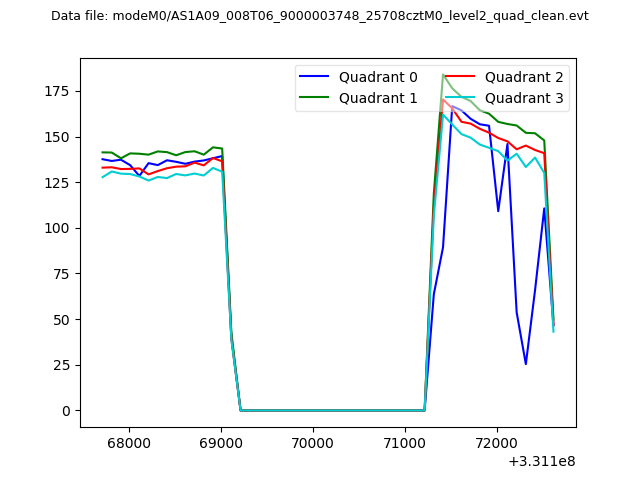
| Quadrant-wise count rates Data is divided into 100 sec bins |
 |
|
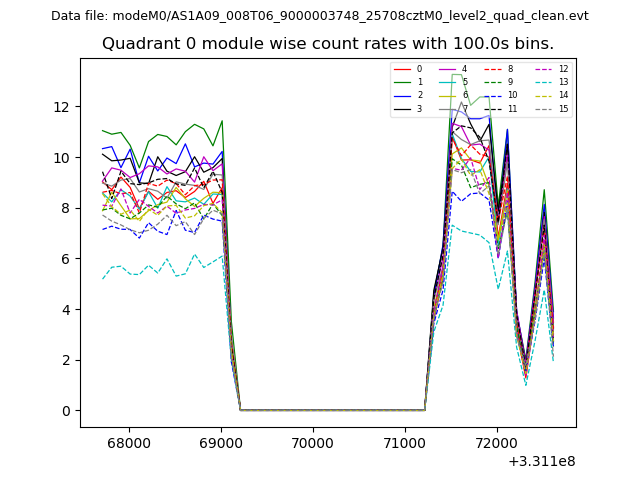
| Module-wise count rates for Quadrant A Data is divided into 100 sec bins |
 |
 |
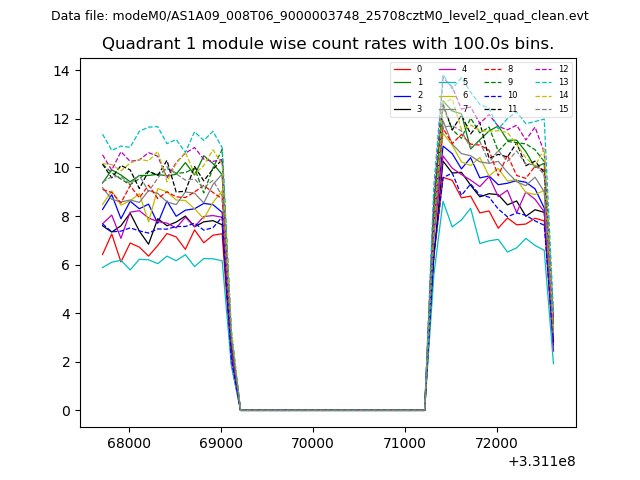
| Module-wise count rates for Quadrant B Data is divided into 100 sec bins |
 |
 |
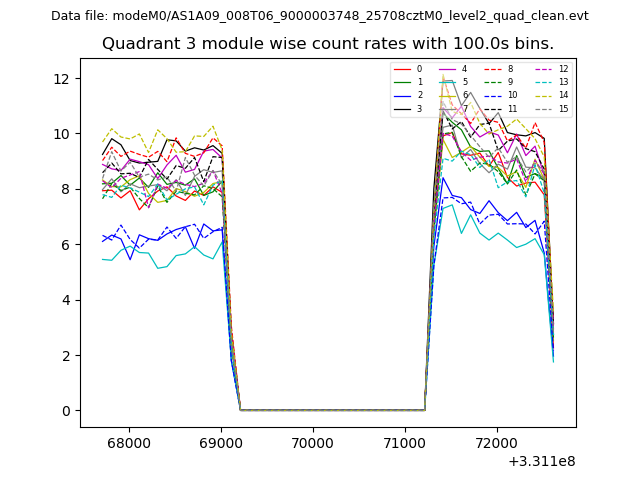
| Module-wise count rates for Quadrant C Data is divided into 100 sec bins |
 |
 |
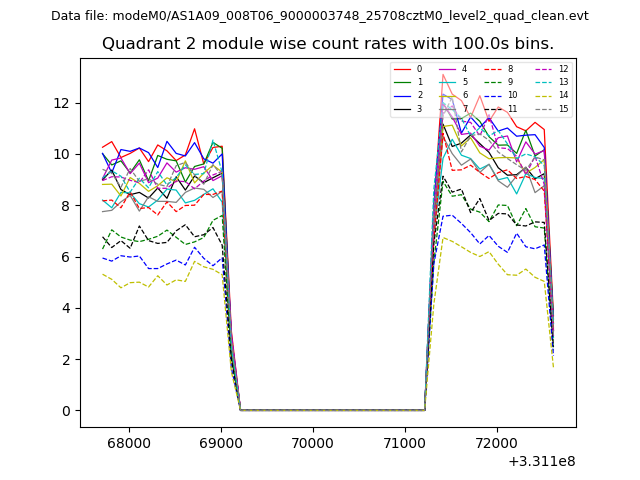
| Module-wise count rates for Quadrant D Data is divided into 100 sec bins |
 |
 |
| Parameter | Plot |
|---|---|
| CZT HV Monitor | 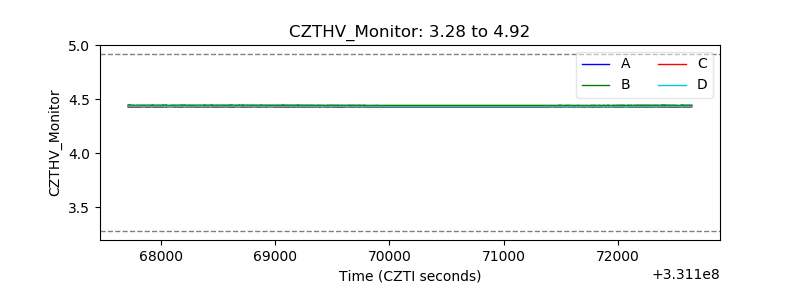 |
| D_VDD | 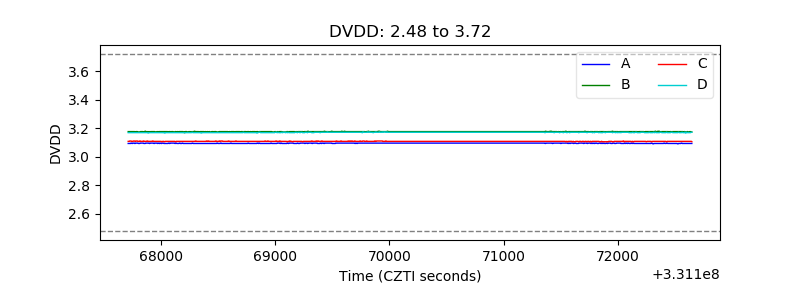 |
| Temperature 1 | 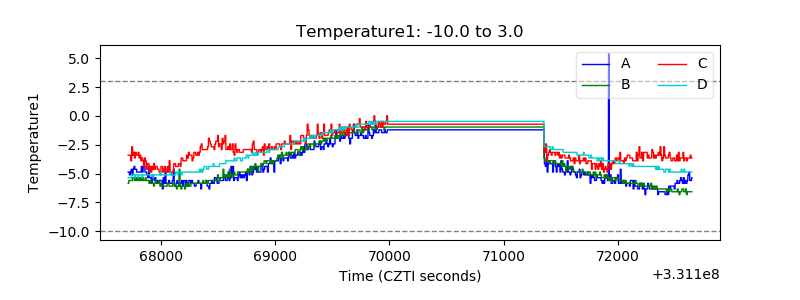 |
| Veto HV Monitor | 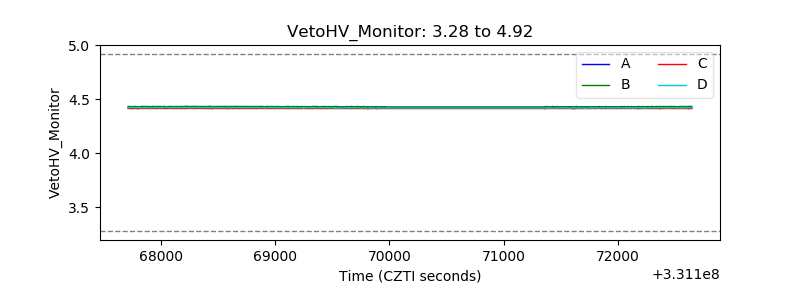 |
| Veto LLD |  |
| Alpha Counter | 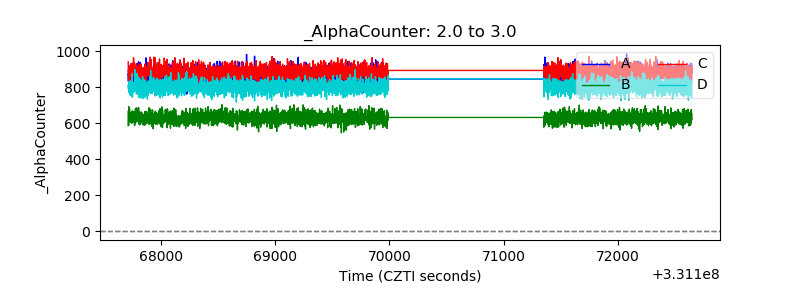 |
| _CPM_Rate | 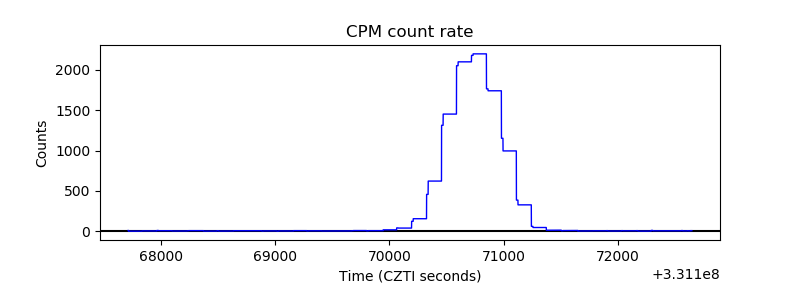 |
| CZT Counter | 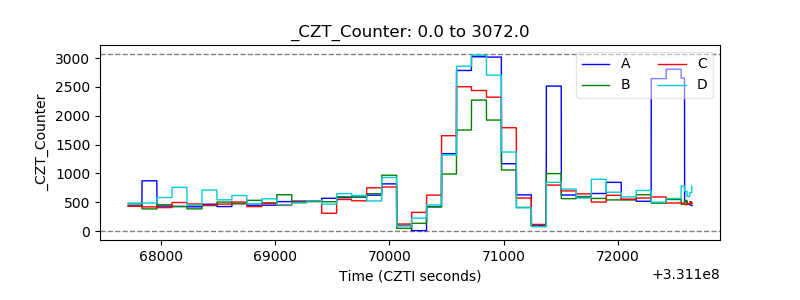 |
| +2.5 Volts monitor |  |
| +5 Volts monitor | 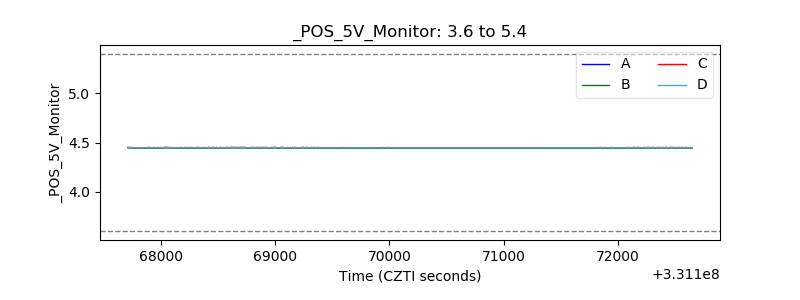 |
| _ROLL_ROT | 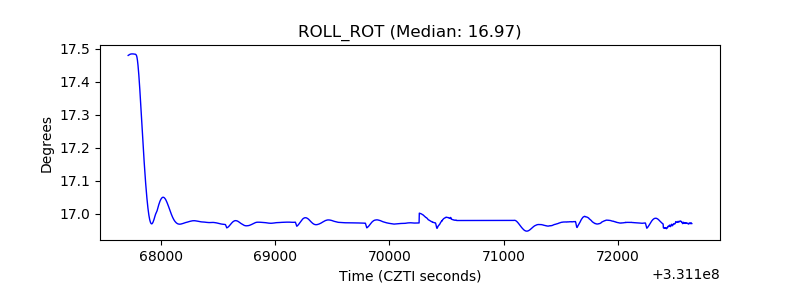 |
| _Roll_DEC | 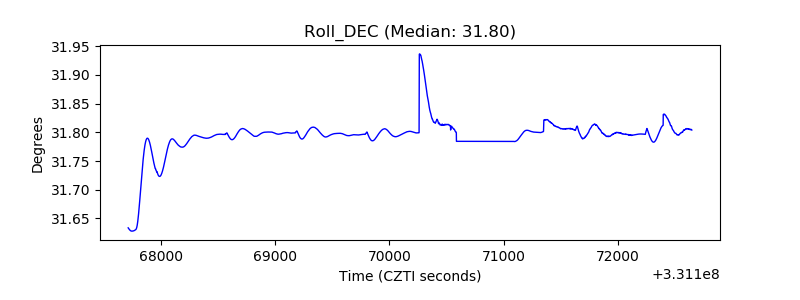 |
| _Roll_RA |  |
| Veto Counter | 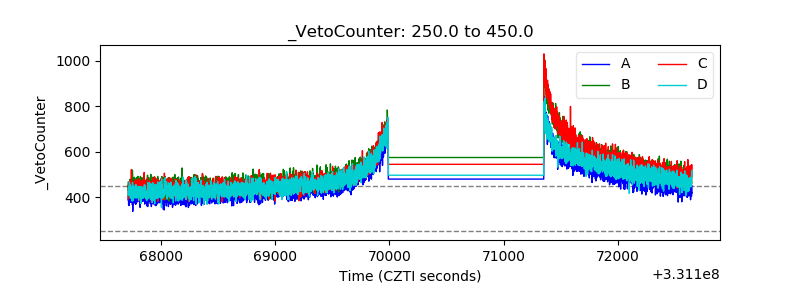 |