| Param | Original file | Final file |
|---|---|---|
| Filename | modeM0/AS1A09_008T06_9000003748_25709cztM0_level2.evt | modeM0/AS1A09_008T06_9000003748_25709cztM0_level2_quad_clean.evt |
| Size (bytes) | 521,879,040 | 105,408,000 |
| Size | 497.7 MB | 100.5 MB |
| Events in quadrant A | 4,305,958 | 655,449 |
| Events in quadrant B | 3,353,230 | 733,395 |
| Events in quadrant C | 3,321,087 | 691,597 |
| Events in quadrant D | 4,387,579 | 662,293 |
| Mode M0 | |||
|---|---|---|---|
| Quadrant | BADHDUFLAG | Total packets | Discarded packets |
| A | 0 | 16975 | 0 |
| B | 0 | 14069 | 0 |
| C | 0 | 14003 | 0 |
| D | 0 | 17592 | 0 |
| Mode M9 | |||
|---|---|---|---|
| Quadrant | BADHDUFLAG | Total packets | Discarded packets |
| A | 0 | 17 | 0 |
| B | 0 | 18 | 0 |
| C | 0 | 18 | 0 |
| D | 0 | 18 | 0 |
| Quadrant | Total seconds | Saturated seconds | Saturation percentage |
|---|---|---|---|
| A | 6439 | 532 | 8.262153% |
| B | 6439 | 78 | 1.211368% |
| C | 6439 | 122 | 1.894704% |
| D | 6439 | 156 | 2.422736% |
Noise dominated data is calculated using 1-second bins in cleaned event files. If a bin has >2000 counts, and if more than 50% of those come from <1% of pixels, then it is considered to be noise-dominated and hence unusable.
| Quadrant | # 1 sec bins | Bins with >0 counts | Bins with >2000 counts | High rate bins dominated by noise | Noise dominated (total time) | Noise dominated (detector-on time) | Marked lightcurve |
|---|---|---|---|---|---|---|---|
| A | 7594 | 6440 | 478 | 478 | 6.29% | 7.42% | 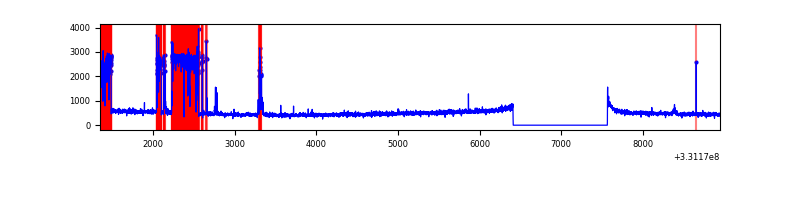 |
| B | 7594 | 6440 | 1 | 1 | 0.01% | 0.02% | 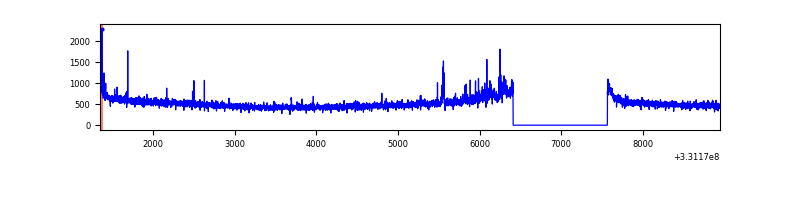 |
| C | 7594 | 6440 | 2 | 2 | 0.03% | 0.03% | 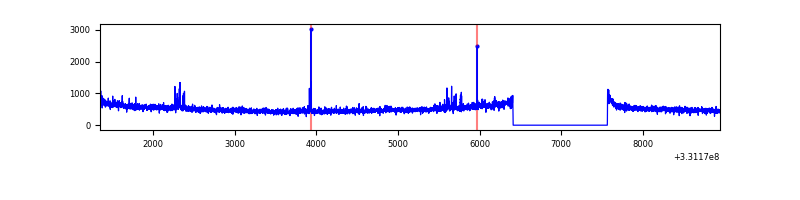 |
| D | 7594 | 6440 | 97 | 97 | 1.28% | 1.51% | 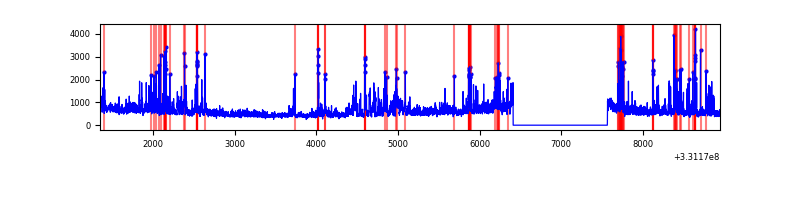 |
Top three noisy pixels from each quadrant. If the there are fewer than three noisy pixels in the level2.evt file, extra rows are filled as -1
| Pixel properties | Quadrant properties | ||||||
|---|---|---|---|---|---|---|---|
| Quadrant | DetID | PixID | Counts | Sigma | Mean | Median | Sigma |
| A | 0 | 13 | 1294144 | 8251.81 | 781 | 767 | 156.7 |
| A | 13 | 254 | 8850 | 51.57 | 781 | 767 | 156.7 |
| A | 3 | 137 | 7033 | 39.98 | 781 | 767 | 156.7 |
| B | 0 | 245 | 30188 | 188.55 | 826 | 807 | 155.8 |
| B | 0 | 219 | 27390 | 170.6 | 826 | 807 | 155.8 |
| B | 15 | 33 | 27378 | 170.52 | 826 | 807 | 155.8 |
| C | 14 | 238 | 127794 | 680.22 | 797 | 802 | 186.7 |
| C | 3 | 233 | 85094 | 451.5 | 797 | 802 | 186.7 |
| C | 13 | 61 | 5526 | 25.3 | 797 | 802 | 186.7 |
| D | 7 | 80 | 635069 | 3274.59 | 791 | 769 | 193.7 |
| D | 8 | 195 | 427561 | 2203.33 | 791 | 769 | 193.7 |
| D | 1 | 52 | 136836 | 702.45 | 791 | 769 | 193.7 |
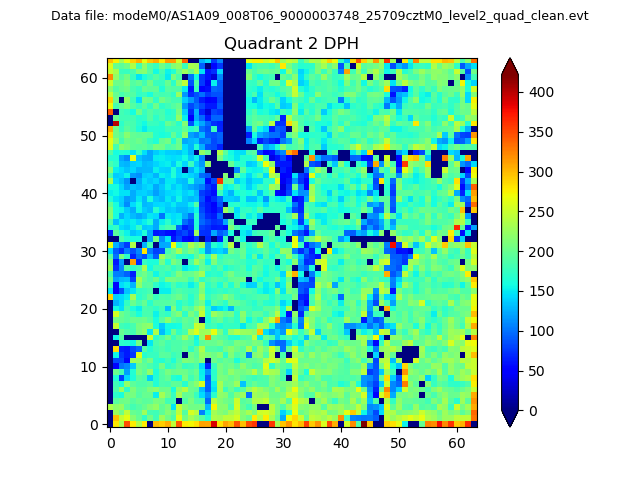
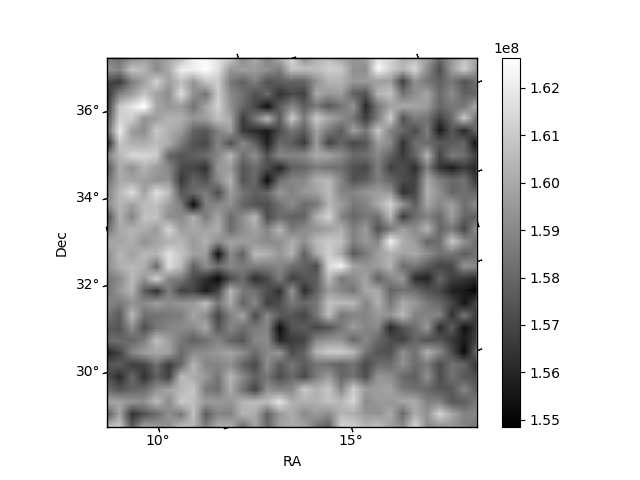
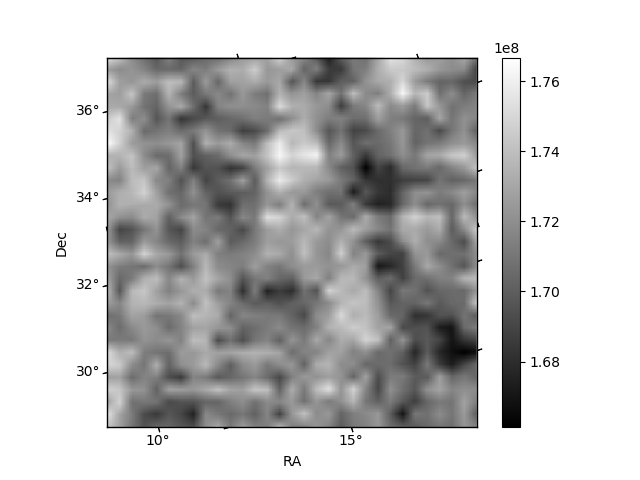
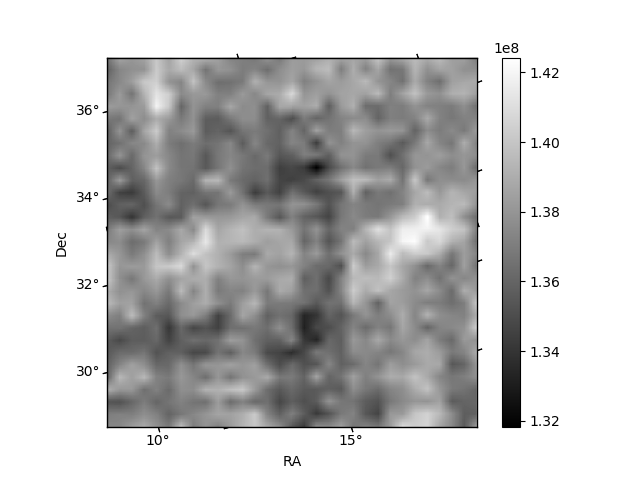
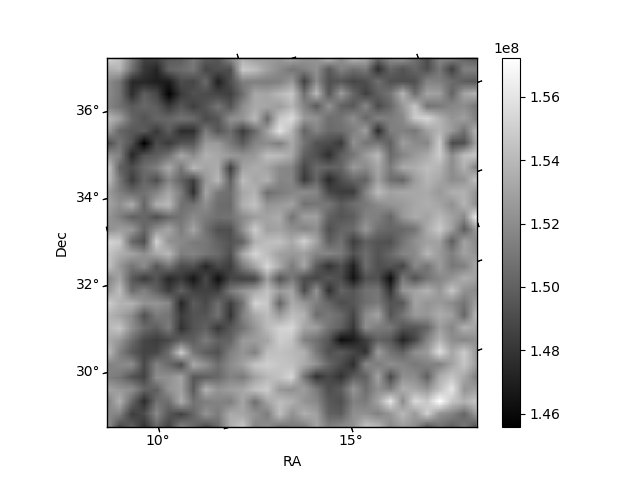
Histogram calculated using DETX and DETY for each event in the final _common_clean file
| Quadrant A |  |
 |
Quadrant B |
|---|---|---|---|
| Quadrant D | 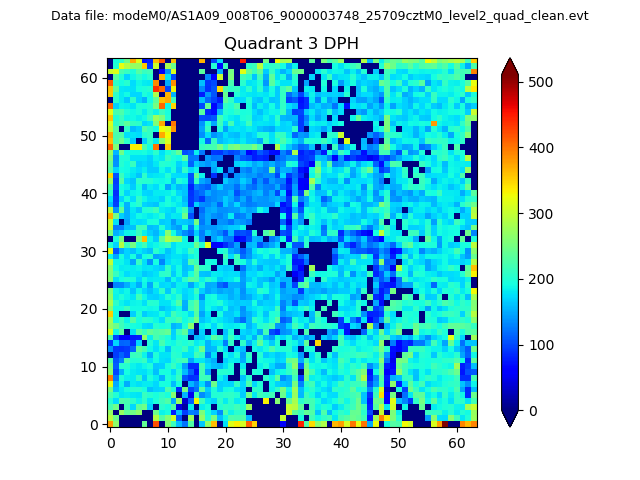 |
 |
Quadrant C |
| Plot type | Count rate plots | Images |
|---|---|---|
| Comparison with Poisson distribution Blue bars denote a histogram of data divided into 1 sec bins. Red curve is a Poisson curve with rate = median count rate of data. |
 |
 |
| Quadrant-wise count rates Data is divided into 100 sec bins |
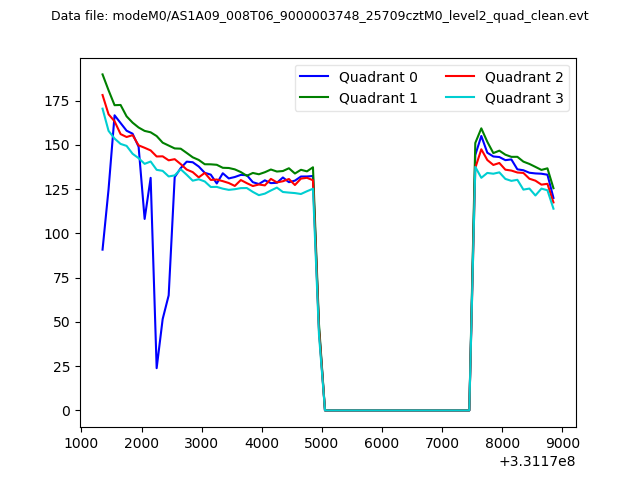 |
|
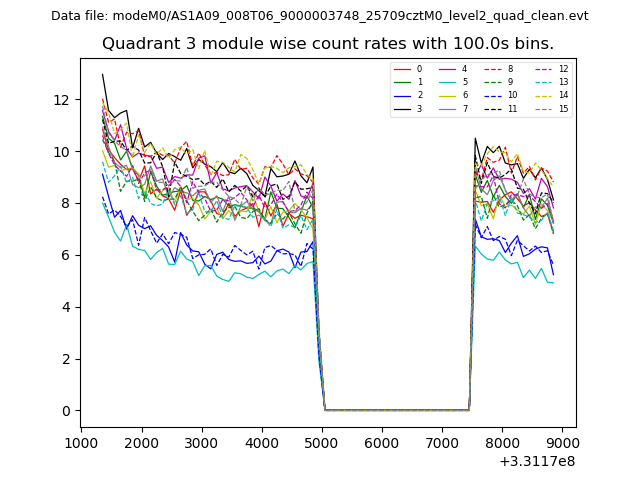
| Module-wise count rates for Quadrant A Data is divided into 100 sec bins |
 |
 |
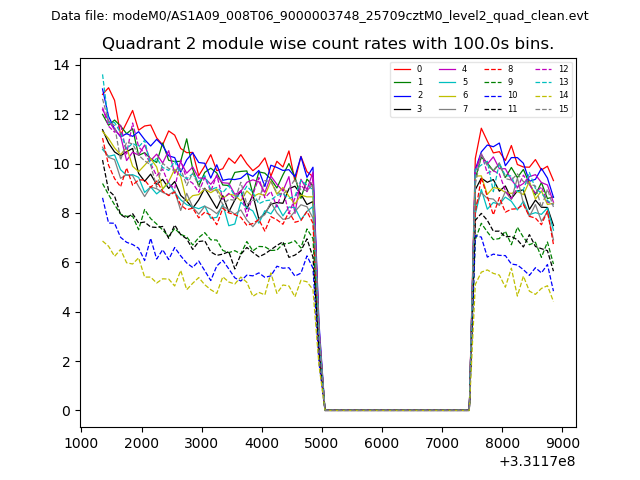
| Module-wise count rates for Quadrant B Data is divided into 100 sec bins |
 |
 |
| Module-wise count rates for Quadrant C Data is divided into 100 sec bins |
 |
 |
| Module-wise count rates for Quadrant D Data is divided into 100 sec bins |
 |
 |
| Parameter | Plot |
|---|---|
| CZT HV Monitor | 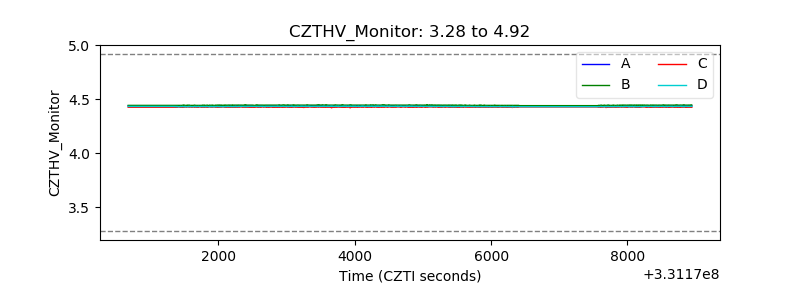 |
| D_VDD | 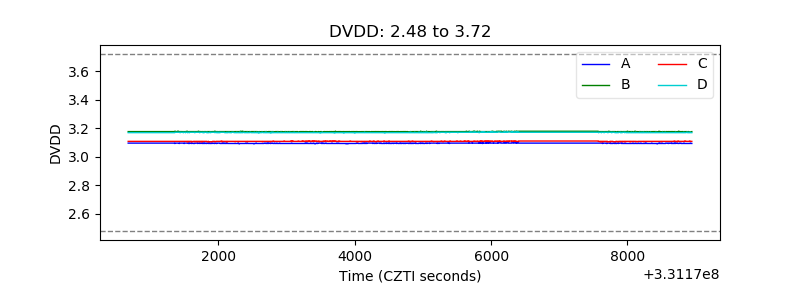 |
| Temperature 1 | 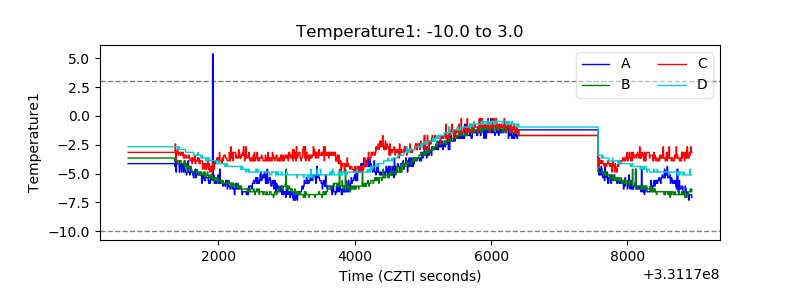 |
| Veto HV Monitor |  |
| Veto LLD | 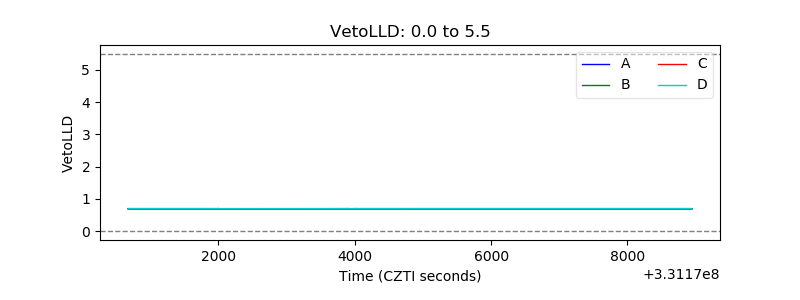 |
| Alpha Counter | 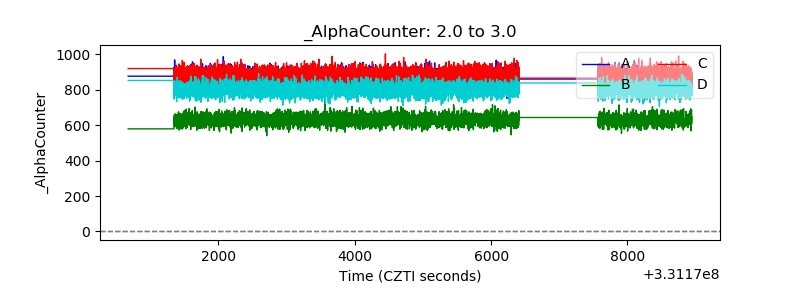 |
| _CPM_Rate | 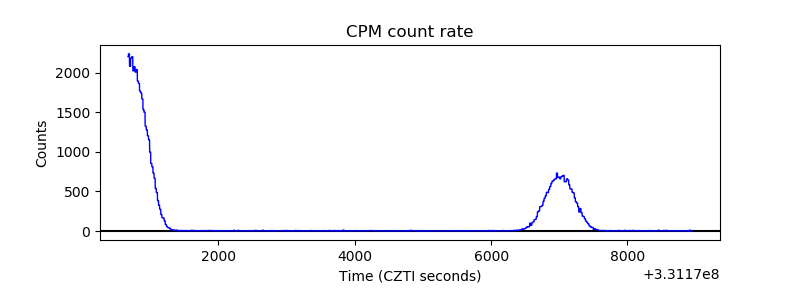 |
| CZT Counter | 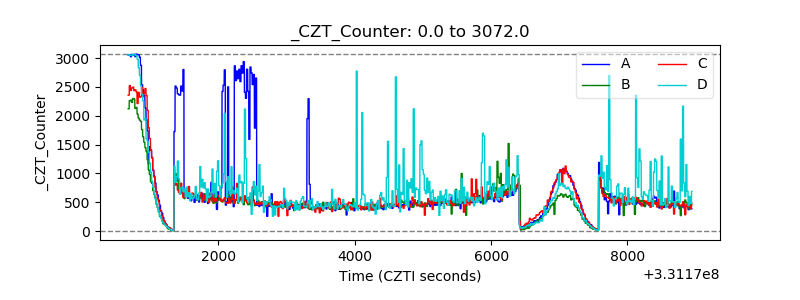 |
| +2.5 Volts monitor |  |
| +5 Volts monitor |  |
| _ROLL_ROT | 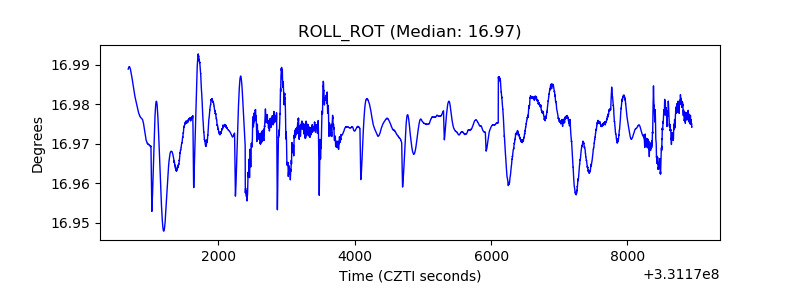 |
| _Roll_DEC | 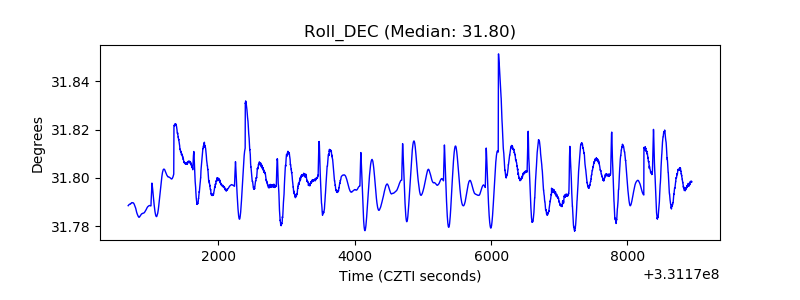 |
| _Roll_RA | 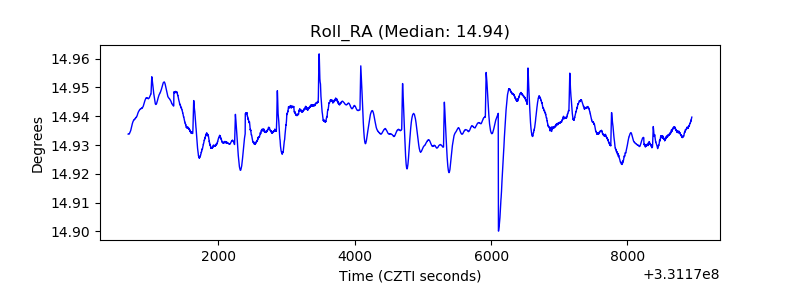 |
| Veto Counter | 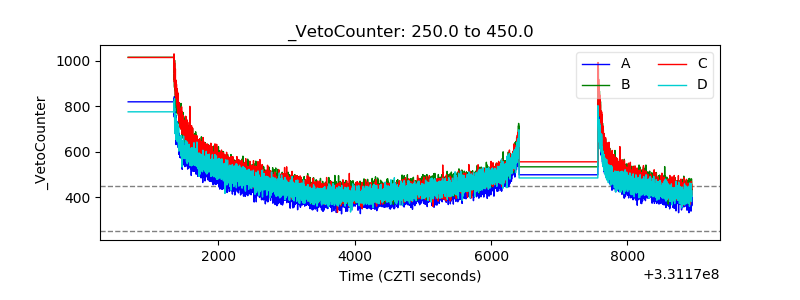 |