| Param | Original file | Final file |
|---|---|---|
| Filename | modeM0/AS1A09_008T06_9000003748_25710cztM0_level2.evt | modeM0/AS1A09_008T06_9000003748_25710cztM0_level2_quad_clean.evt |
| Size (bytes) | 557,933,760 | 96,891,840 |
| Size | 532.1 MB | 92.4 MB |
| Events in quadrant A | 3,292,047 | 623,287 |
| Events in quadrant B | 3,470,417 | 642,109 |
| Events in quadrant C | 3,353,949 | 605,893 |
| Events in quadrant D | 6,312,713 | 582,523 |
| Mode M0 | |||
|---|---|---|---|
| Quadrant | BADHDUFLAG | Total packets | Discarded packets |
| A | 0 | 14332 | 0 |
| B | 0 | 14802 | 0 |
| C | 0 | 14402 | 0 |
| D | 0 | 23530 | 0 |
| Mode M9 | |||
|---|---|---|---|
| Quadrant | BADHDUFLAG | Total packets | Discarded packets |
| A | 0 | 8 | 0 |
| B | 0 | 9 | 0 |
| C | 0 | 9 | 0 |
| D | 0 | 9 | 0 |
| Quadrant | Total seconds | Saturated seconds | Saturation percentage |
|---|---|---|---|
| A | 6896 | 32 | 0.464037% |
| B | 6896 | 59 | 0.855568% |
| C | 6896 | 80 | 1.160093% |
| D | 6896 | 1039 | 15.066705% |
Noise dominated data is calculated using 1-second bins in cleaned event files. If a bin has >2000 counts, and if more than 50% of those come from <1% of pixels, then it is considered to be noise-dominated and hence unusable.
| Quadrant | # 1 sec bins | Bins with >0 counts | Bins with >2000 counts | High rate bins dominated by noise | Noise dominated (total time) | Noise dominated (detector-on time) | Marked lightcurve |
|---|---|---|---|---|---|---|---|
| A | 7696 | 6897 | 1 | 1 | 0.01% | 0.01% | 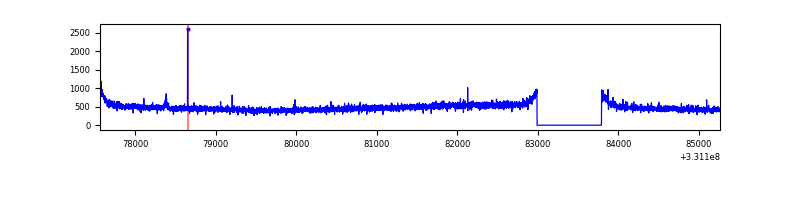 |
| B | 7696 | 6897 | 1 | 1 | 0.01% | 0.01% | 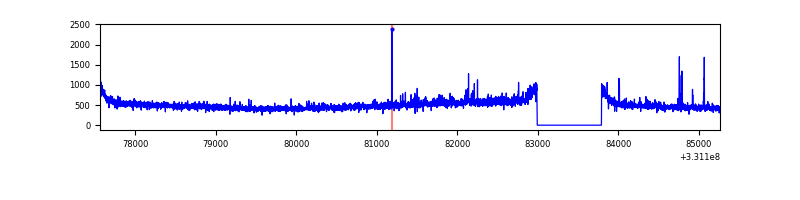 |
| C | 7696 | 6897 | 0 | 0 | 0.00% | 0.00% | 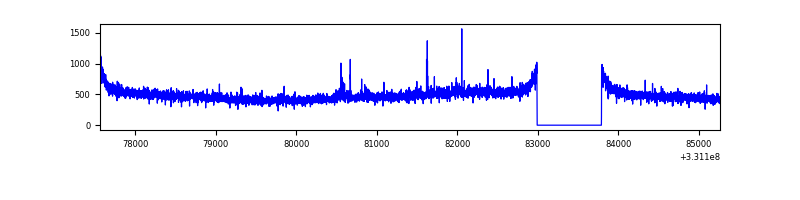 |
| D | 7696 | 6896 | 812 | 812 | 10.55% | 11.77% | 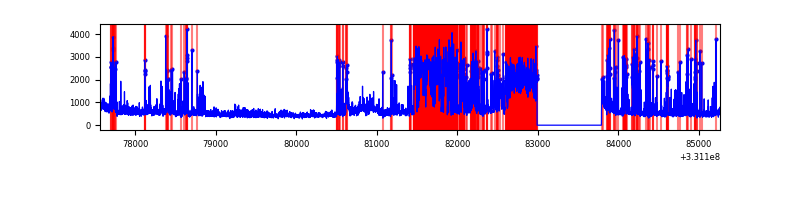 |
Top three noisy pixels from each quadrant. If the there are fewer than three noisy pixels in the level2.evt file, extra rows are filled as -1
| Pixel properties | Quadrant properties | ||||||
|---|---|---|---|---|---|---|---|
| Quadrant | DetID | PixID | Counts | Sigma | Mean | Median | Sigma |
| A | 0 | 13 | 16168 | 89.58 | 849 | 835 | 171.2 |
| A | 13 | 254 | 9056 | 48.03 | 849 | 835 | 171.2 |
| A | 3 | 137 | 7912 | 41.35 | 849 | 835 | 171.2 |
| B | 3 | 112 | 52565 | 317.08 | 853 | 831 | 163.2 |
| B | 0 | 219 | 33187 | 198.31 | 853 | 831 | 163.2 |
| B | 12 | 111 | 20047 | 117.77 | 853 | 831 | 163.2 |
| C | 14 | 238 | 127737 | 659.54 | 816 | 821 | 192.4 |
| C | 3 | 233 | 40225 | 204.77 | 816 | 821 | 192.4 |
| C | 13 | 61 | 5411 | 23.85 | 816 | 821 | 192.4 |
| D | 1 | 52 | 2097033 | 11215.31 | 766 | 743 | 186.9 |
| D | 7 | 80 | 699041 | 3735.95 | 766 | 743 | 186.9 |
| D | 8 | 195 | 425966 | 2274.97 | 766 | 743 | 186.9 |
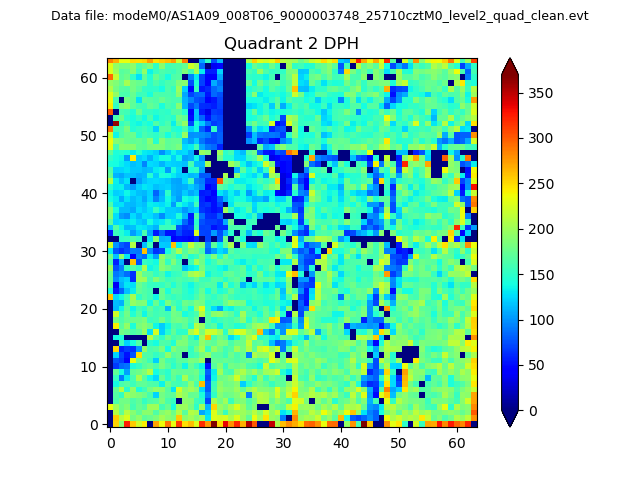
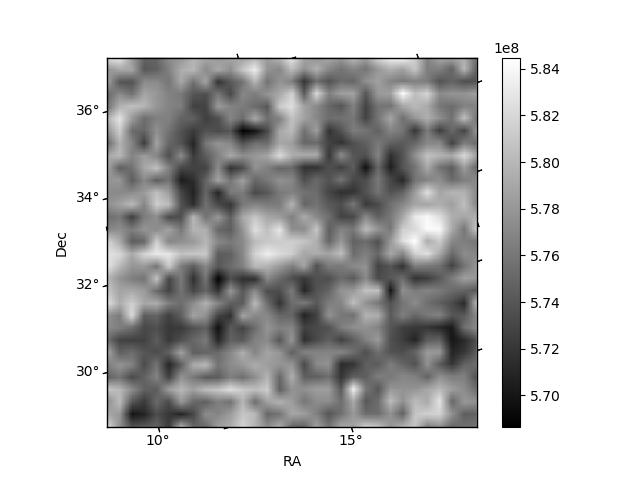
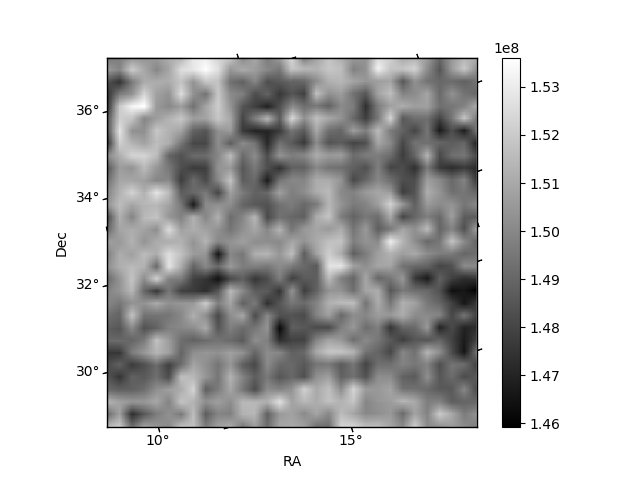
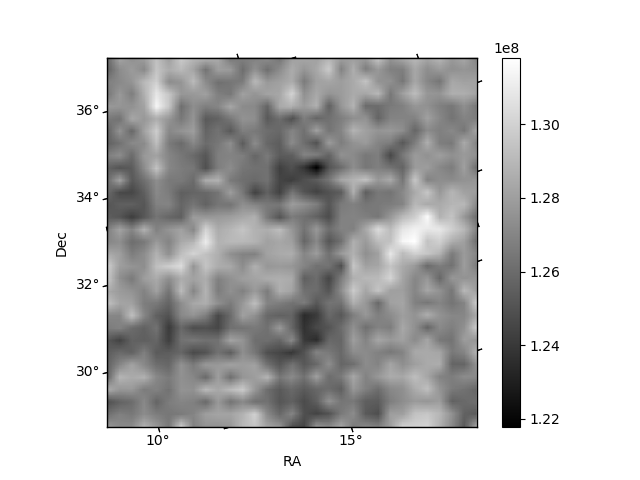
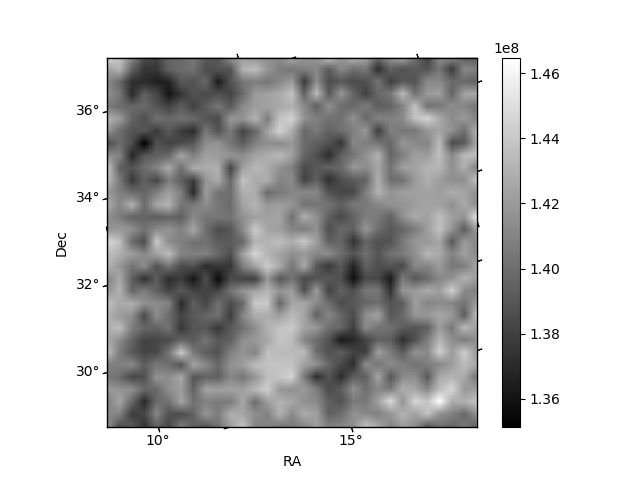
Histogram calculated using DETX and DETY for each event in the final _common_clean file
| Quadrant A | 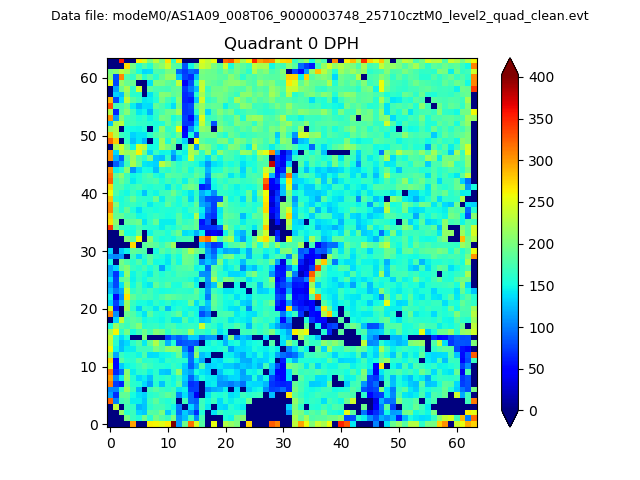 |
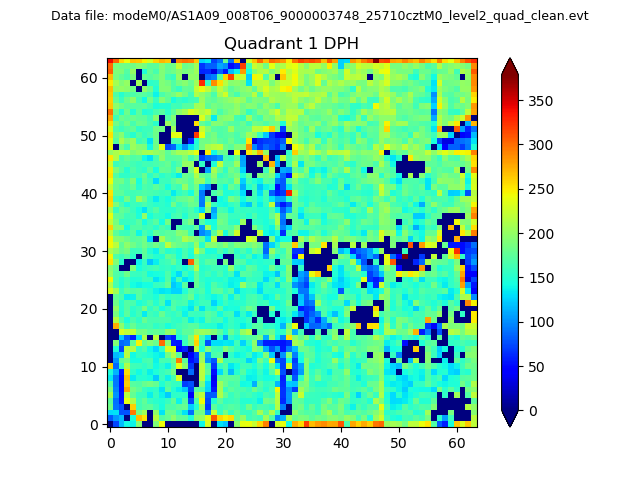 |
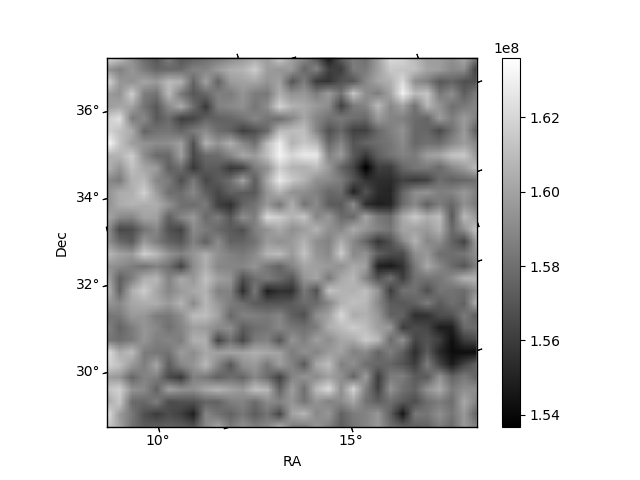
Quadrant B |
|---|---|---|---|
| Quadrant D | 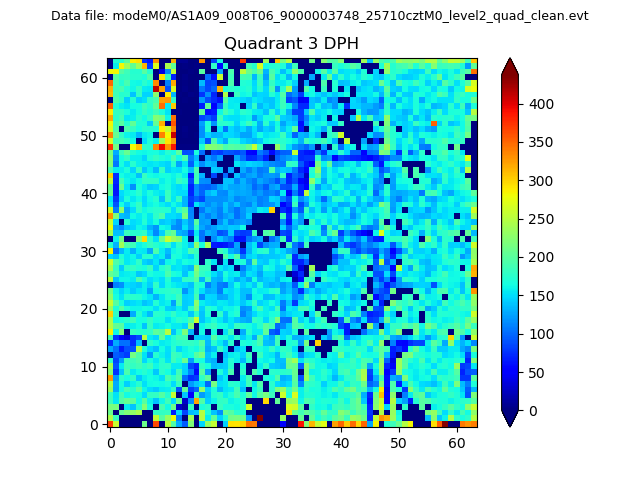 |
 |
Quadrant C |
| Plot type | Count rate plots | Images |
|---|---|---|
| Comparison with Poisson distribution Blue bars denote a histogram of data divided into 1 sec bins. Red curve is a Poisson curve with rate = median count rate of data. |
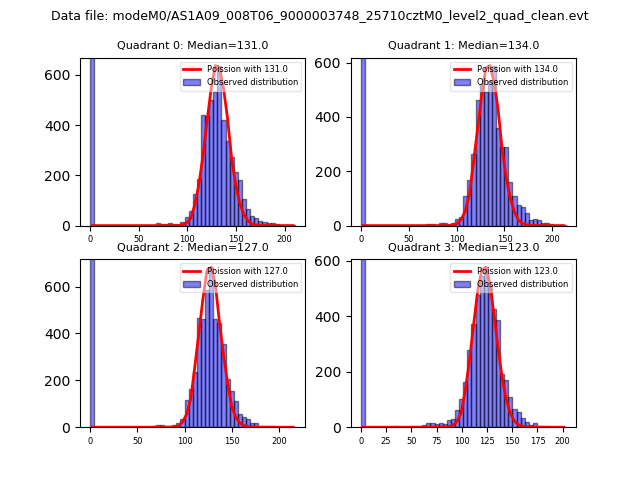 |
 |
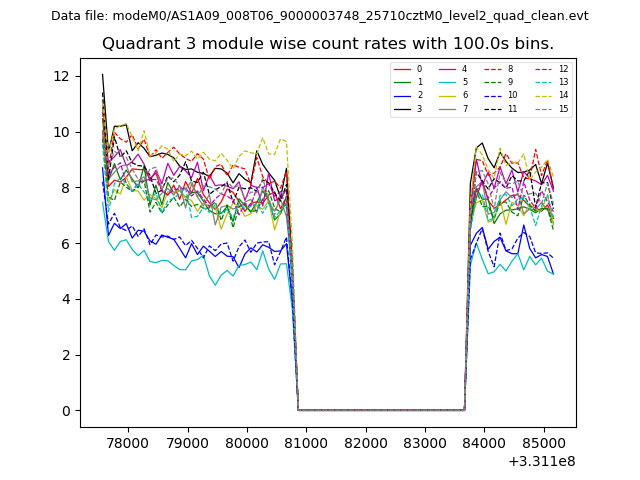
| Quadrant-wise count rates Data is divided into 100 sec bins |
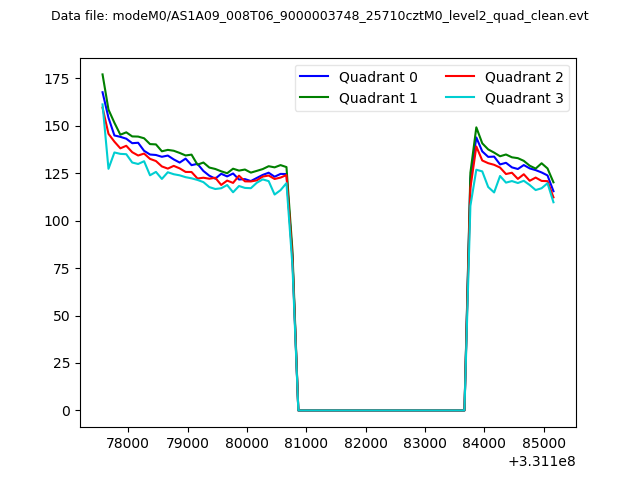 |
|
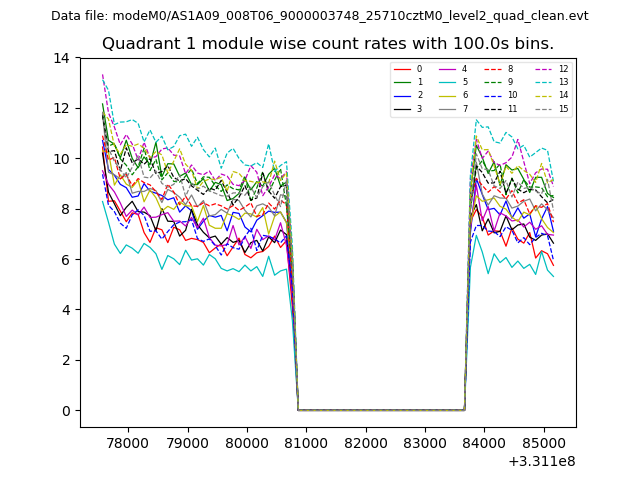
| Module-wise count rates for Quadrant A Data is divided into 100 sec bins |
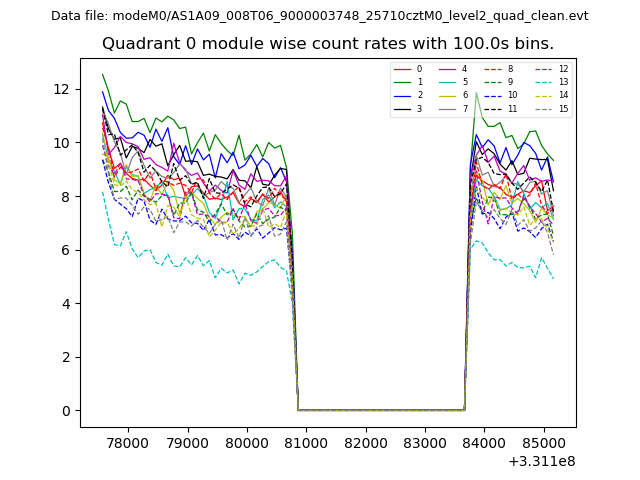 |
 |
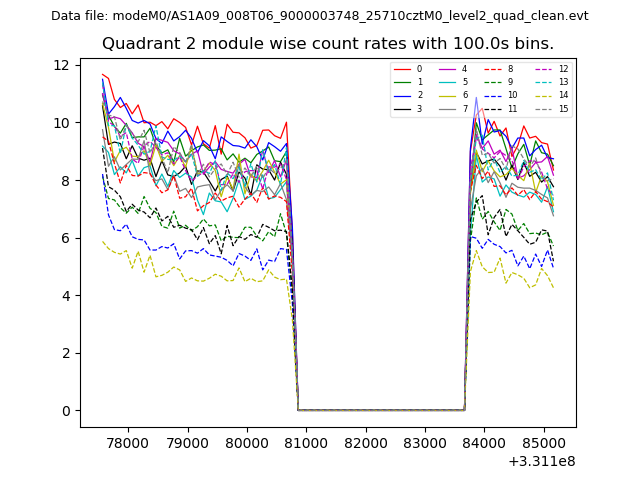
| Module-wise count rates for Quadrant B Data is divided into 100 sec bins |
 |
 |
| Module-wise count rates for Quadrant C Data is divided into 100 sec bins |
 |
 |
| Module-wise count rates for Quadrant D Data is divided into 100 sec bins |
 |
 |
| Parameter | Plot |
|---|---|
| CZT HV Monitor | 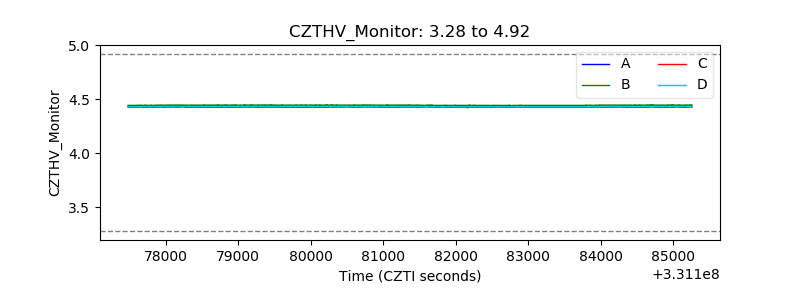 |
| D_VDD | 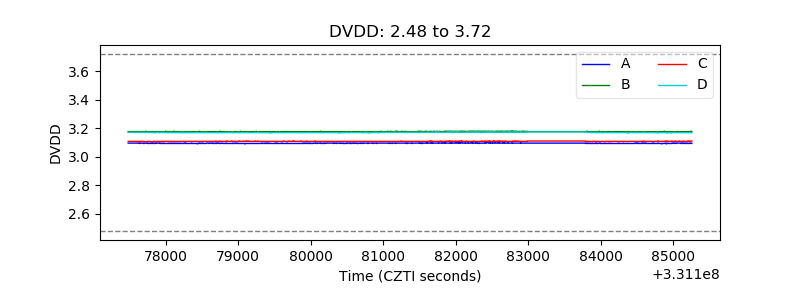 |
| Temperature 1 | 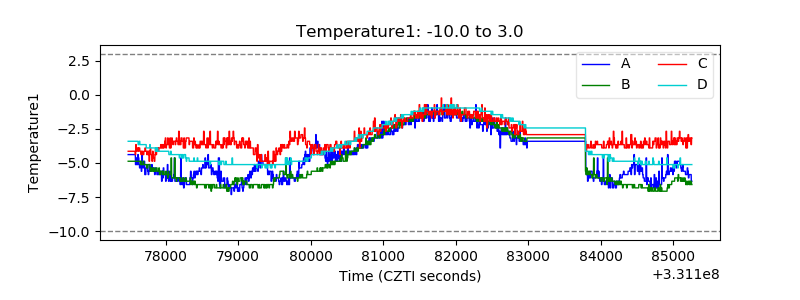 |
| Veto HV Monitor |  |
| Veto LLD | 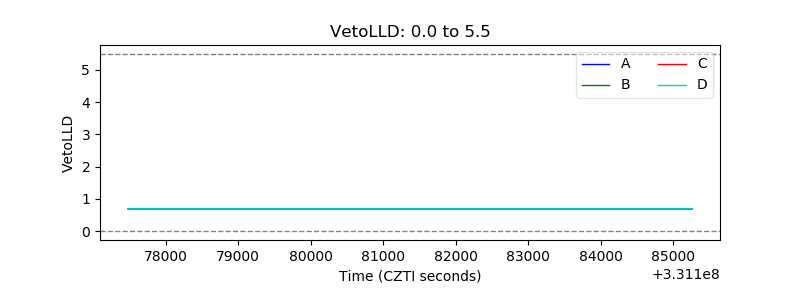 |
| Alpha Counter |  |
| _CPM_Rate | 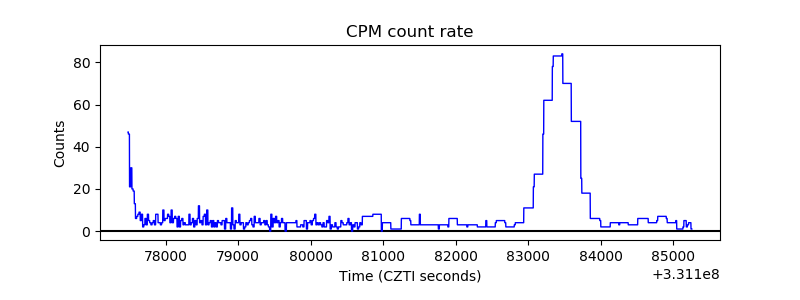 |
| CZT Counter | 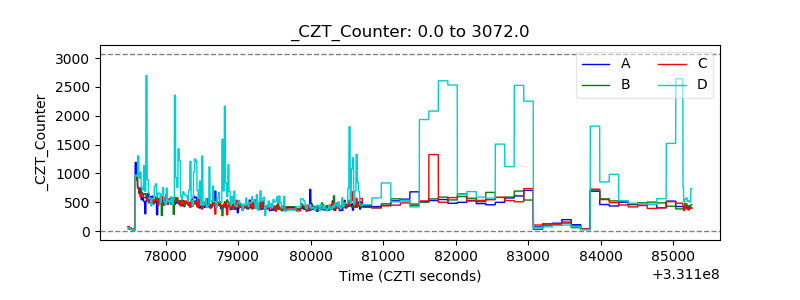 |
| +2.5 Volts monitor | 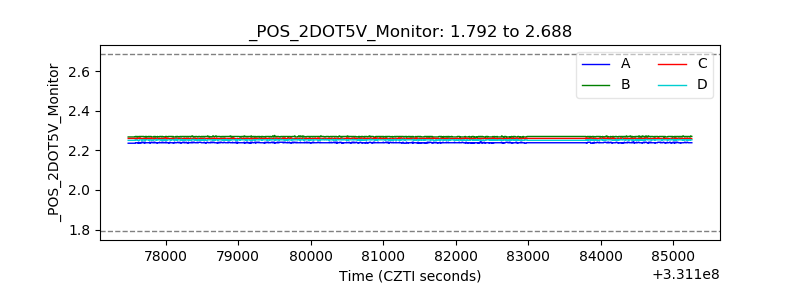 |
| +5 Volts monitor |  |
| _ROLL_ROT | 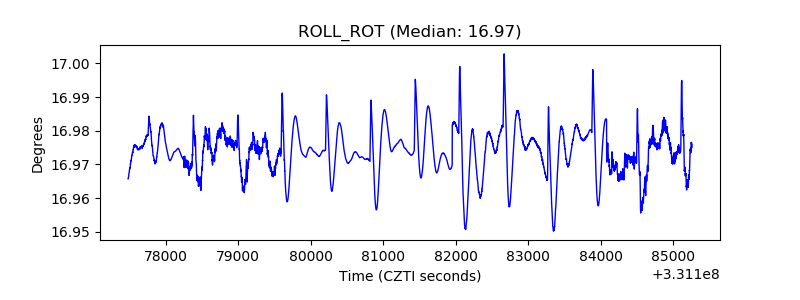 |
| _Roll_DEC | 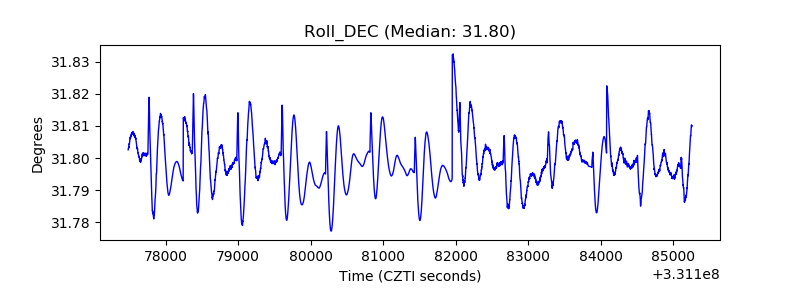 |
| _Roll_RA | 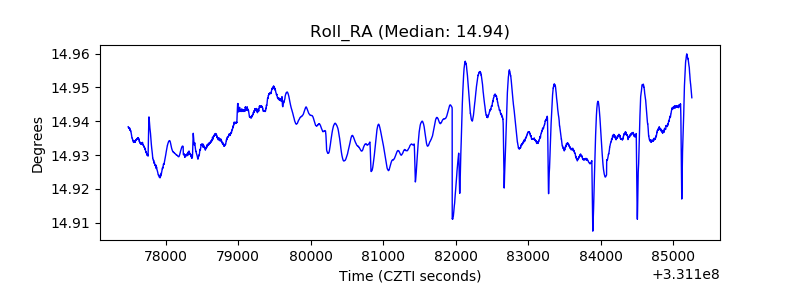 |
| Veto Counter | 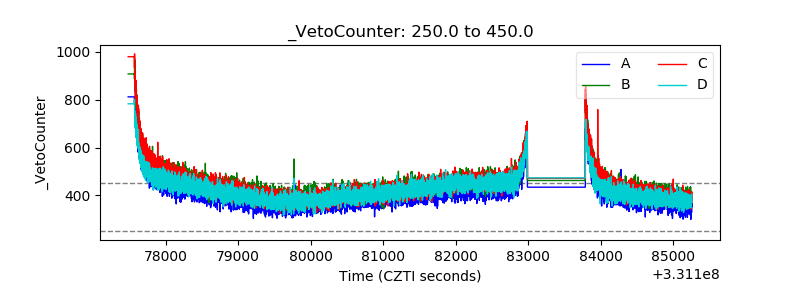 |