| Param | Original file | Final file |
|---|---|---|
| Filename | modeM0/AS1A09_008T06_9000003748_25711cztM0_level2.evt | modeM0/AS1A09_008T06_9000003748_25711cztM0_level2_quad_clean.evt |
| Size (bytes) | 298,414,080 | 56,122,560 |
| Size | 284.6 MB | 53.5 MB |
| Events in quadrant A | 2,087,060 | 364,225 |
| Events in quadrant B | 2,111,139 | 370,998 |
| Events in quadrant C | 2,062,878 | 353,090 |
| Events in quadrant D | 2,499,223 | 325,032 |
| Mode M0 | |||
|---|---|---|---|
| Quadrant | BADHDUFLAG | Total packets | Discarded packets |
| A | 0 | 8677 | 0 |
| B | 0 | 8741 | 0 |
| C | 0 | 8556 | 0 |
| D | 0 | 10109 | 0 |
| Mode M9 | |||
|---|---|---|---|
| Quadrant | BADHDUFLAG | Total packets | Discarded packets |
| A | 0 | 2 | 0 |
| B | 0 | 4 | 2 |
| C | 0 | 2 | 0 |
| D | 0 | 3 | 1 |
| Quadrant | Total seconds | Saturated seconds | Saturation percentage |
|---|---|---|---|
| A | 3921 | 194 | 4.947717% |
| B | 3930 | 237 | 6.030534% |
| C | 3921 | 202 | 5.151747% |
| D | 3838 | 310 | 8.077124% |
Noise dominated data is calculated using 1-second bins in cleaned event files. If a bin has >2000 counts, and if more than 50% of those come from <1% of pixels, then it is considered to be noise-dominated and hence unusable.
| Quadrant | # 1 sec bins | Bins with >0 counts | Bins with >2000 counts | High rate bins dominated by noise | Noise dominated (total time) | Noise dominated (detector-on time) | Marked lightcurve |
|---|---|---|---|---|---|---|---|
| A | 7762 | 4167 | 8 | 8 | 0.10% | 0.19% | 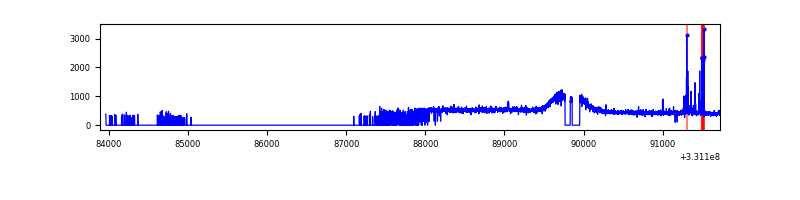 |
| B | 7825 | 4172 | 1 | 1 | 0.01% | 0.02% | 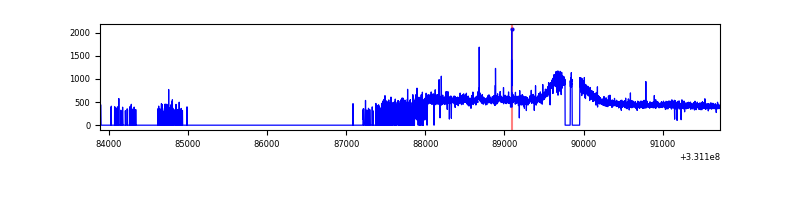 |
| C | 7836 | 4163 | 0 | 0 | 0.00% | 0.00% | 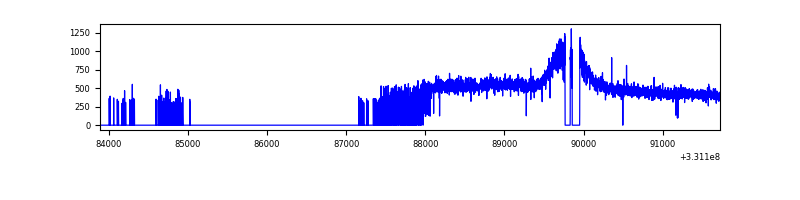 |
| D | 7741 | 4076 | 97 | 97 | 1.25% | 2.38% | 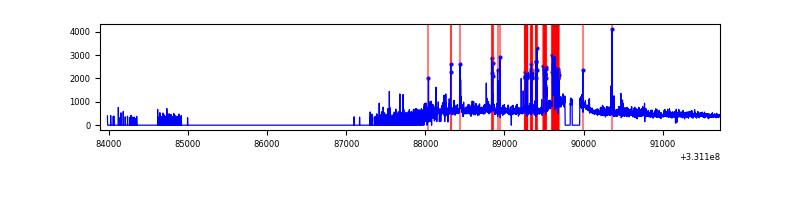 |
Top three noisy pixels from each quadrant. If the there are fewer than three noisy pixels in the level2.evt file, extra rows are filled as -1
| Pixel properties | Quadrant properties | ||||||
|---|---|---|---|---|---|---|---|
| Quadrant | DetID | PixID | Counts | Sigma | Mean | Median | Sigma |
| A | 0 | 13 | 73980 | 677.56 | 522 | 510 | 108.4 |
| A | 13 | 254 | 5505 | 46.07 | 522 | 510 | 108.4 |
| A | 3 | 137 | 5031 | 41.69 | 522 | 510 | 108.4 |
| B | 0 | 219 | 32761 | 307.26 | 524 | 508 | 105.0 |
| B | 12 | 111 | 12821 | 117.3 | 524 | 508 | 105.0 |
| B | 0 | 245 | 11917 | 108.68 | 524 | 508 | 105.0 |
| C | 14 | 238 | 78553 | 637.55 | 502 | 503 | 122.4 |
| C | 3 | 233 | 19408 | 154.43 | 502 | 503 | 122.4 |
| C | 8 | 128 | 4479 | 32.48 | 502 | 503 | 122.4 |
| D | 7 | 80 | 385907 | 3158.13 | 471 | 457 | 122.1 |
| D | 8 | 195 | 209133 | 1709.76 | 471 | 457 | 122.1 |
| D | 1 | 52 | 82682 | 673.7 | 471 | 457 | 122.1 |
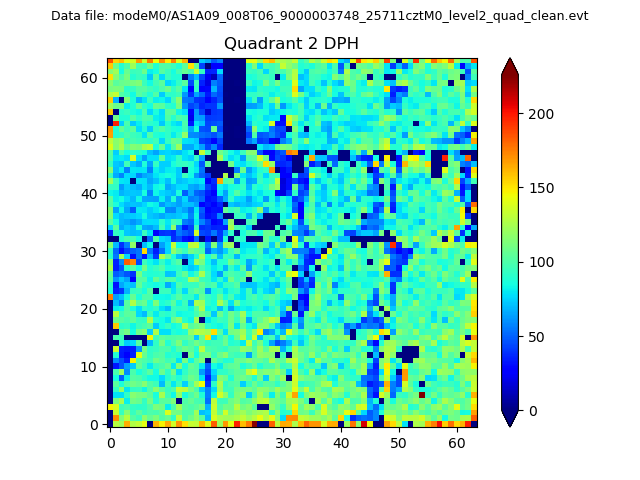
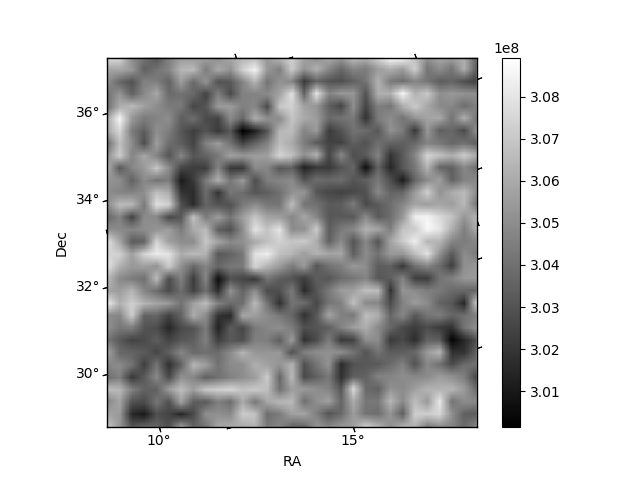
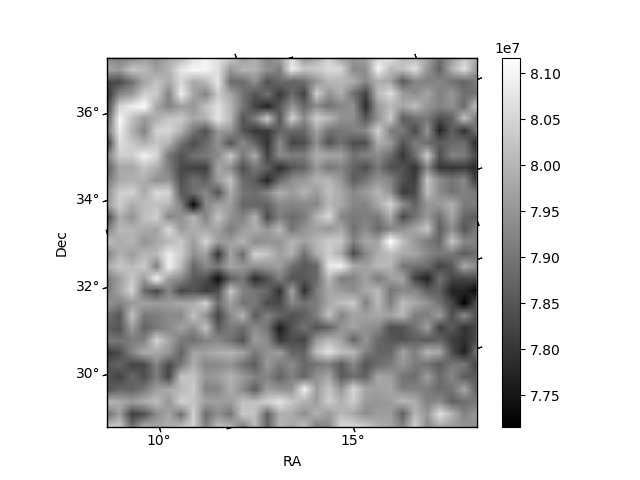
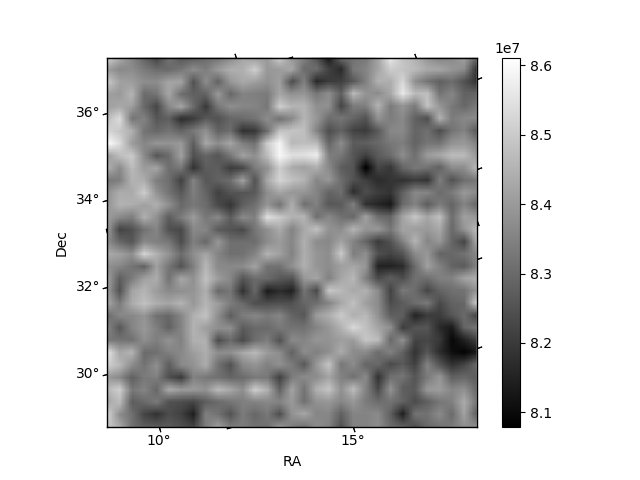
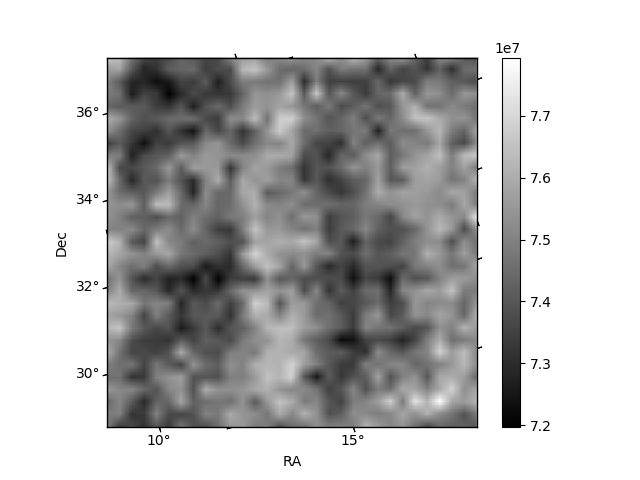
Histogram calculated using DETX and DETY for each event in the final _common_clean file
| Quadrant A | 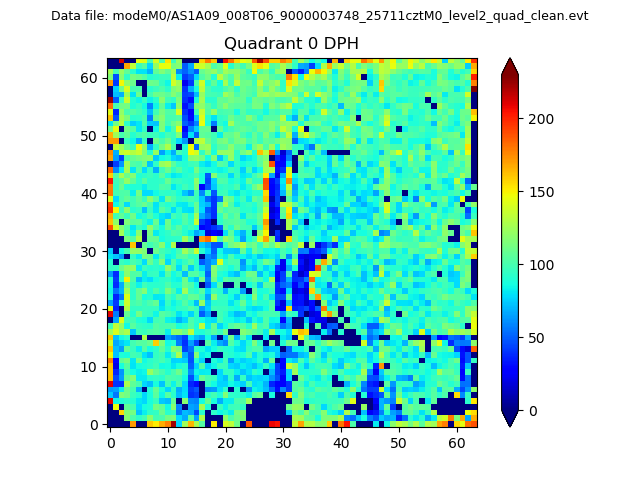 |
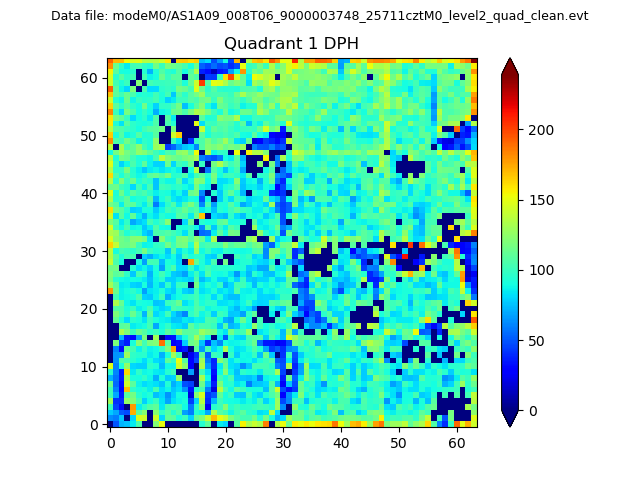 |
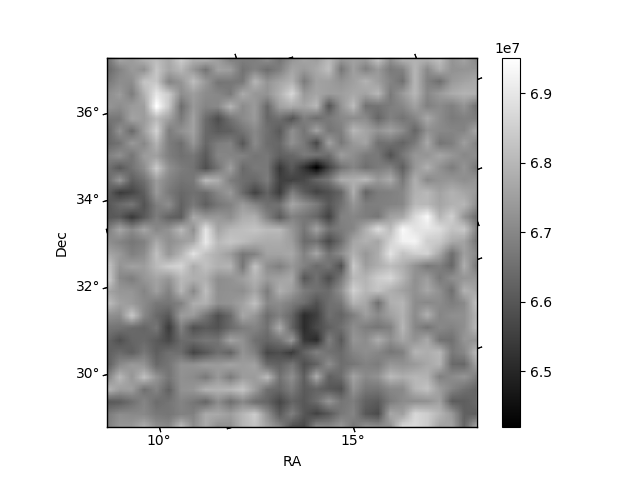
Quadrant B |
|---|---|---|---|
| Quadrant D | 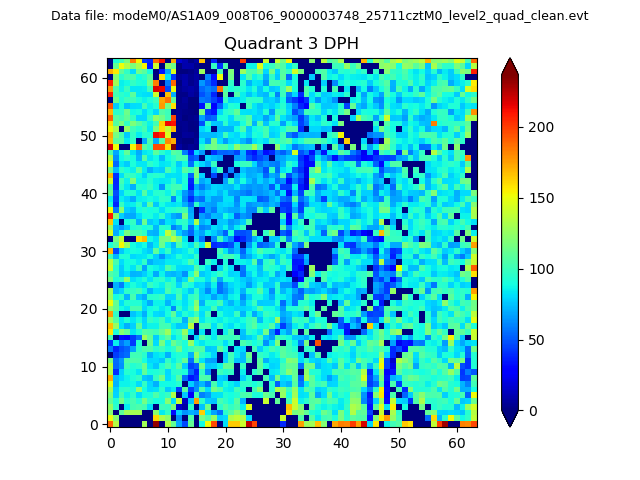 |
 |
Quadrant C |
| Plot type | Count rate plots | Images |
|---|---|---|
| Comparison with Poisson distribution Blue bars denote a histogram of data divided into 1 sec bins. Red curve is a Poisson curve with rate = median count rate of data. |
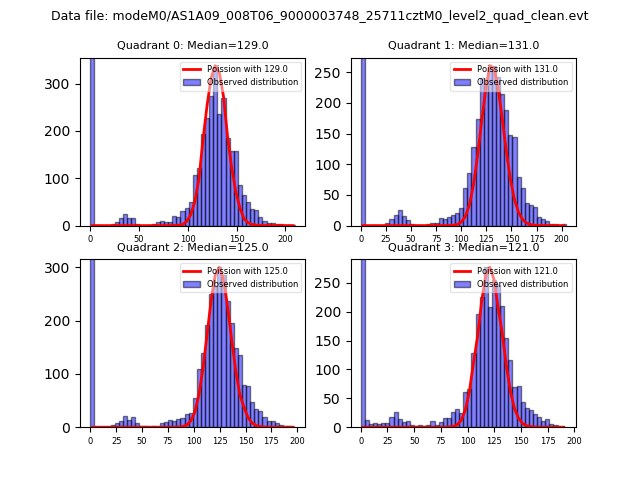 |
 |
| Quadrant-wise count rates Data is divided into 100 sec bins |
 |
|
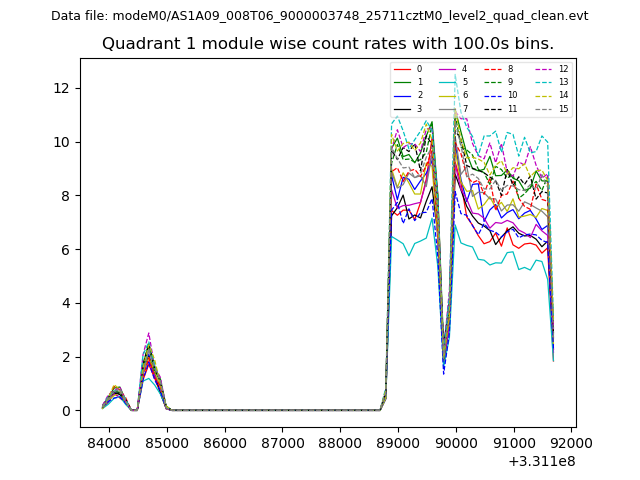
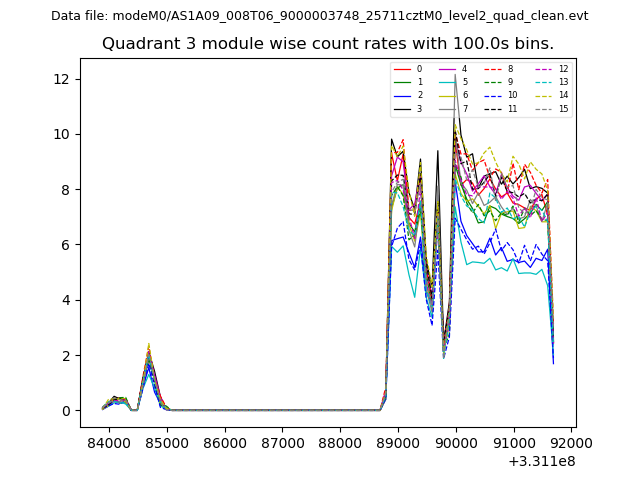
| Module-wise count rates for Quadrant A Data is divided into 100 sec bins |
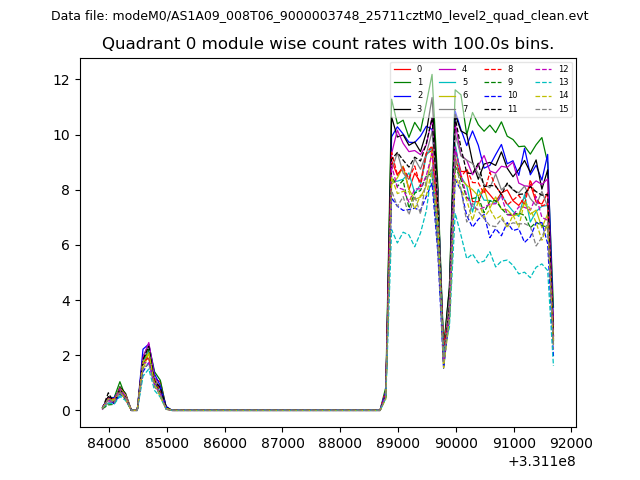 |
 |
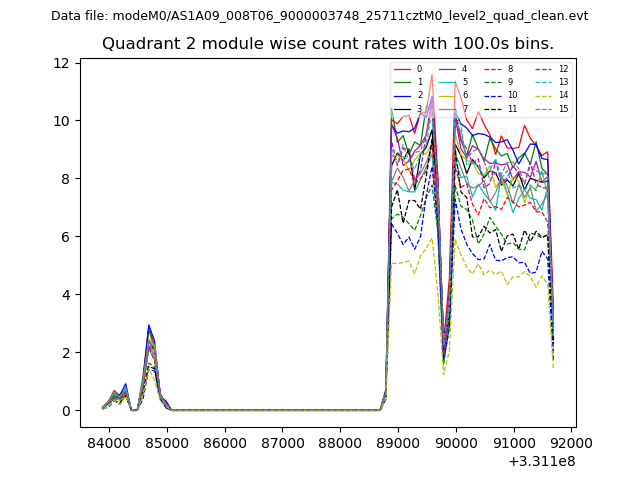
| Module-wise count rates for Quadrant B Data is divided into 100 sec bins |
 |
 |
| Module-wise count rates for Quadrant C Data is divided into 100 sec bins |
 |
 |
| Module-wise count rates for Quadrant D Data is divided into 100 sec bins |
 |
 |
| Parameter | Plot |
|---|---|
| CZT HV Monitor | 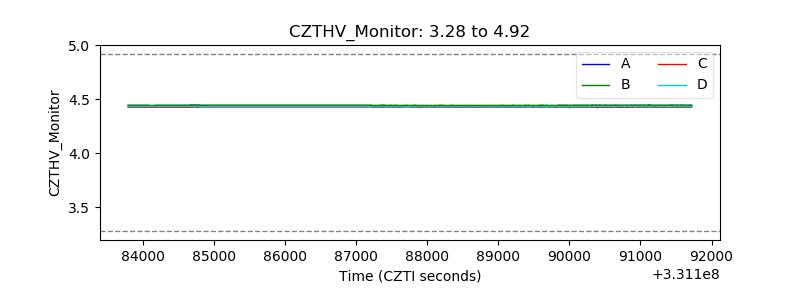 |
| D_VDD | 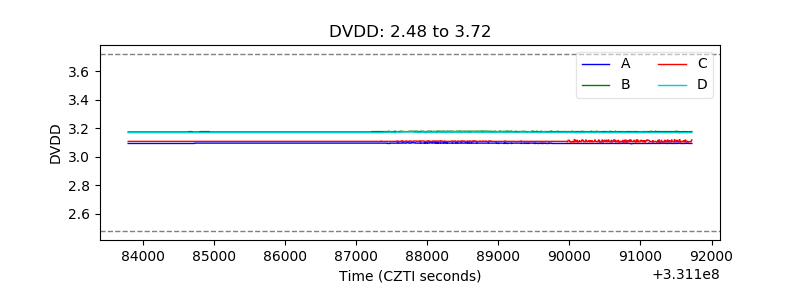 |
| Temperature 1 | 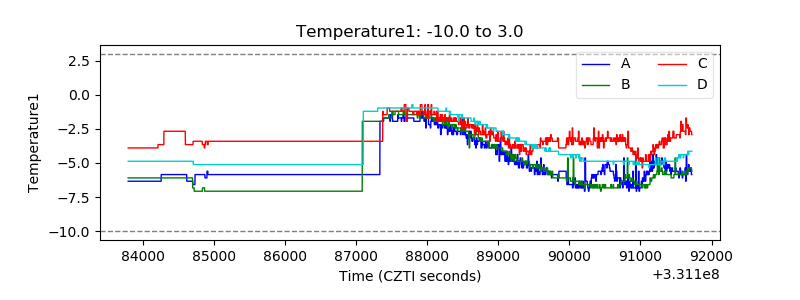 |
| Veto HV Monitor | 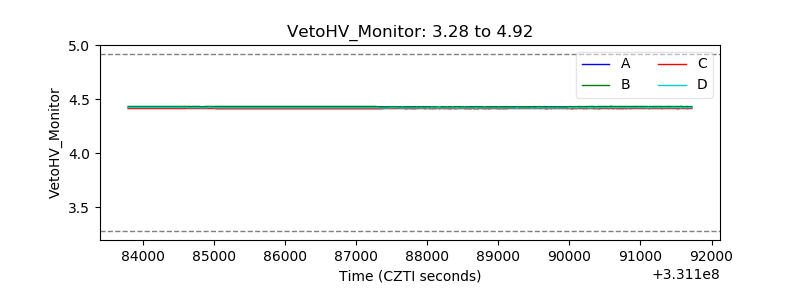 |
| Veto LLD | 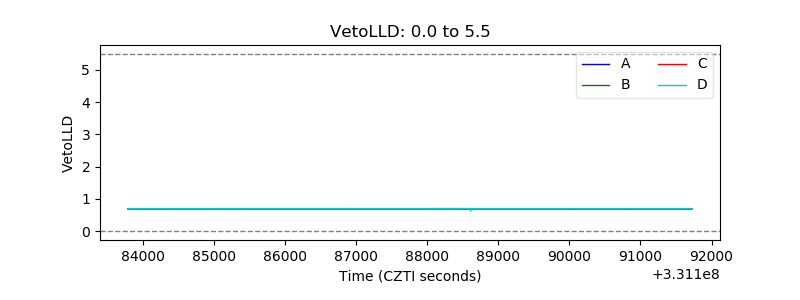 |
| Alpha Counter |  |
| _CPM_Rate | 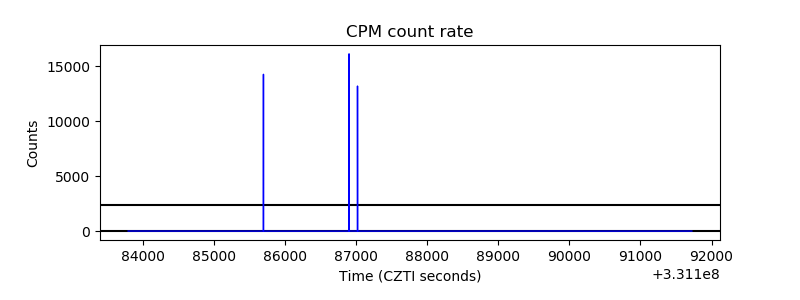 |
| CZT Counter | 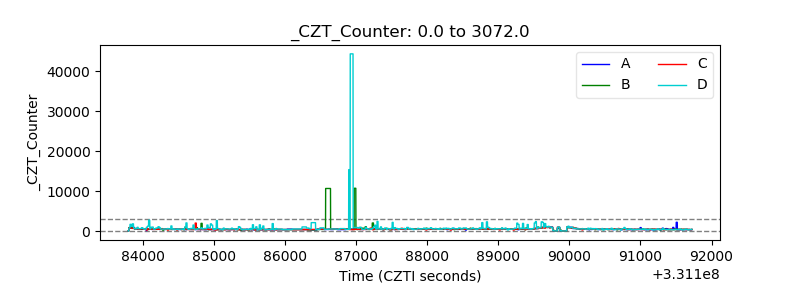 |
| +2.5 Volts monitor |  |
| +5 Volts monitor |  |
| _ROLL_ROT | 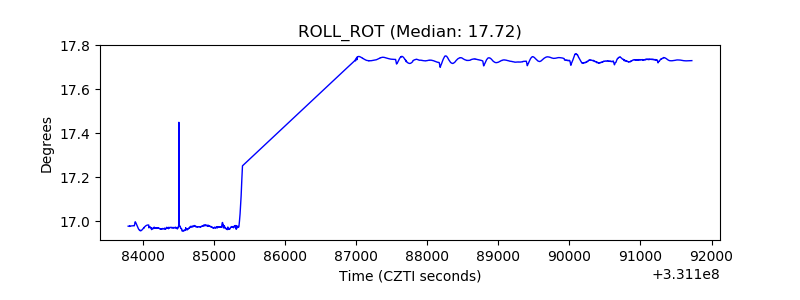 |
| _Roll_DEC | 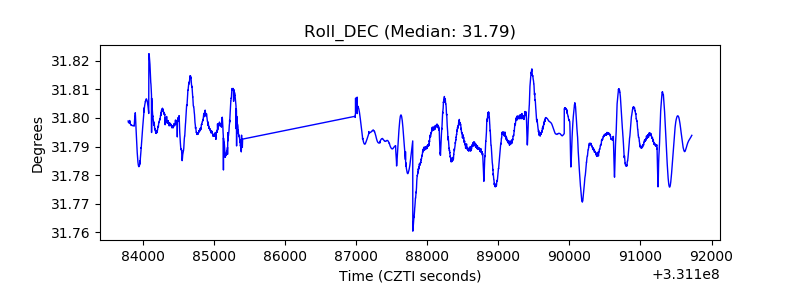 |
| _Roll_RA | 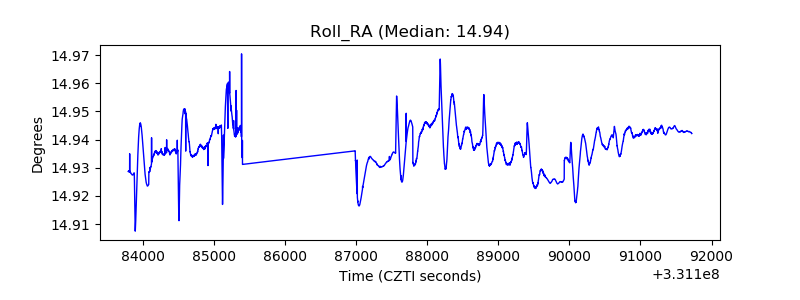 |
| Veto Counter | 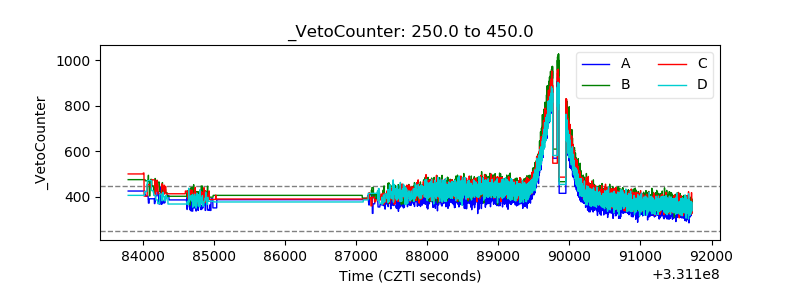 |