| Param | Original file | Final file |
|---|---|---|
| Filename | modeM0/AS1A09_008T06_9000003748_25712cztM0_level2.evt | modeM0/AS1A09_008T06_9000003748_25712cztM0_level2_quad_clean.evt |
| Size (bytes) | 874,408,320 | 162,270,720 |
| Size | 833.9 MB | 154.8 MB |
| Events in quadrant A | 6,198,778 | 1,034,698 |
| Events in quadrant B | 6,000,494 | 1,072,381 |
| Events in quadrant C | 5,821,911 | 1,024,428 |
| Events in quadrant D | 7,661,490 | 967,515 |
| Mode M0 | |||
|---|---|---|---|
| Quadrant | BADHDUFLAG | Total packets | Discarded packets |
| A | 0 | 26323 | 0 |
| B | 0 | 25638 | 0 |
| C | 0 | 25211 | 0 |
| D | 0 | 30951 | 0 |
| Mode M9 | |||
|---|---|---|---|
| Quadrant | BADHDUFLAG | Total packets | Discarded packets |
| A | 0 | 6 | 3 |
| B | 0 | 7 | 4 |
| C | 0 | 6 | 3 |
| D | 0 | 7 | 4 |
| Quadrant | Total seconds | Saturated seconds | Saturation percentage |
|---|---|---|---|
| A | 11853 | 452 | 3.813381% |
| B | 11966 | 401 | 3.351162% |
| C | 12028 | 347 | 2.884935% |
| D | 11844 | 519 | 4.381966% |
Noise dominated data is calculated using 1-second bins in cleaned event files. If a bin has >2000 counts, and if more than 50% of those come from <1% of pixels, then it is considered to be noise-dominated and hence unusable.
| Quadrant | # 1 sec bins | Bins with >0 counts | Bins with >2000 counts | High rate bins dominated by noise | Noise dominated (total time) | Noise dominated (detector-on time) | Marked lightcurve |
|---|---|---|---|---|---|---|---|
| A | 13312 | 12464 | 74 | 74 | 0.56% | 0.59% | 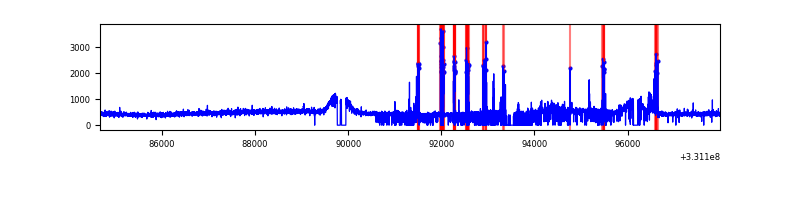 |
| B | 13312 | 12579 | 2 | 2 | 0.02% | 0.02% | 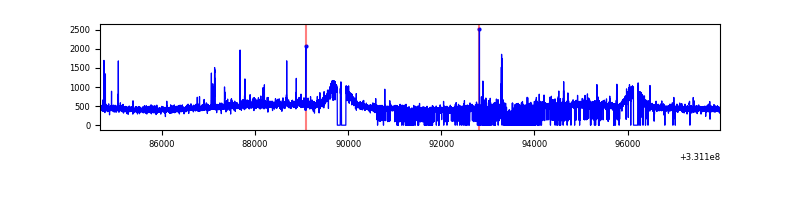 |
| C | 13312 | 12610 | 0 | 0 | 0.00% | 0.00% | 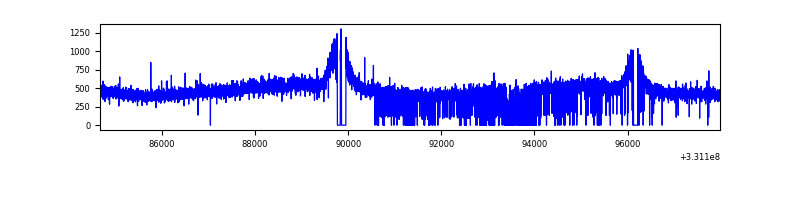 |
| D | 13312 | 12522 | 254 | 254 | 1.91% | 2.03% | 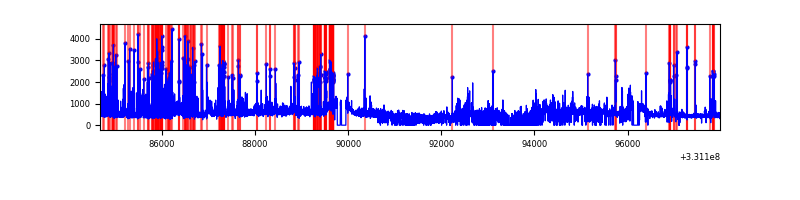 |
Top three noisy pixels from each quadrant. If the there are fewer than three noisy pixels in the level2.evt file, extra rows are filled as -1
| Pixel properties | Quadrant properties | ||||||
|---|---|---|---|---|---|---|---|
| Quadrant | DetID | PixID | Counts | Sigma | Mean | Median | Sigma |
| A | 0 | 13 | 485317 | 1639.5 | 1458 | 1427 | 295.1 |
| A | 4 | 2 | 90828 | 302.91 | 1458 | 1427 | 295.1 |
| A | 13 | 254 | 16442 | 50.87 | 1458 | 1427 | 295.1 |
| B | 0 | 219 | 72190 | 246.26 | 1480 | 1440 | 287.3 |
| B | 0 | 190 | 54263 | 183.86 | 1480 | 1440 | 287.3 |
| B | 12 | 111 | 35454 | 118.39 | 1480 | 1440 | 287.3 |
| C | 14 | 238 | 224827 | 666.4 | 1421 | 1429 | 335.2 |
| C | 3 | 233 | 40433 | 116.35 | 1421 | 1429 | 335.2 |
| C | 8 | 128 | 10976 | 28.48 | 1421 | 1429 | 335.2 |
| D | 7 | 80 | 1271597 | 3718.92 | 1389 | 1345 | 341.6 |
| D | 8 | 195 | 582924 | 1702.69 | 1389 | 1345 | 341.6 |
| D | 1 | 52 | 447768 | 1306.99 | 1389 | 1345 | 341.6 |
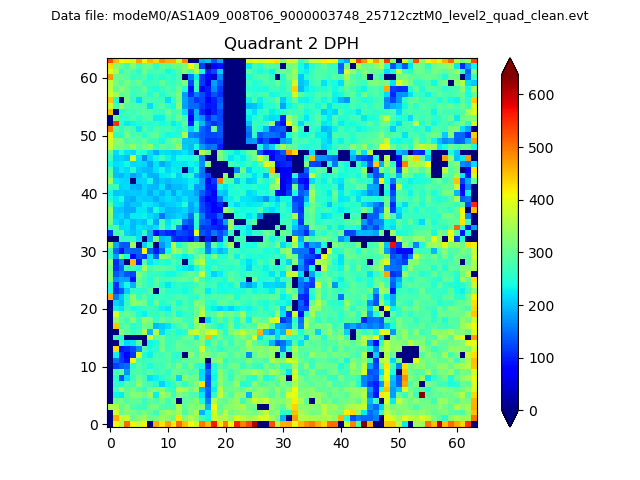
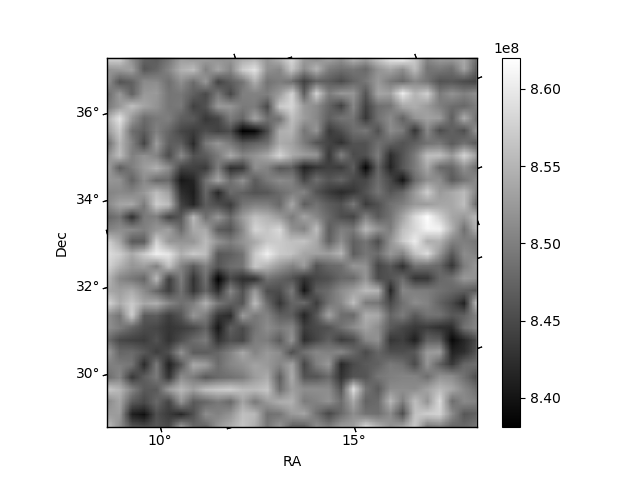
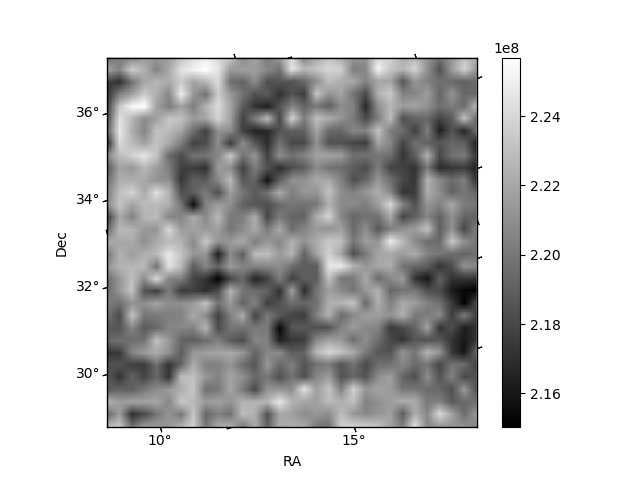
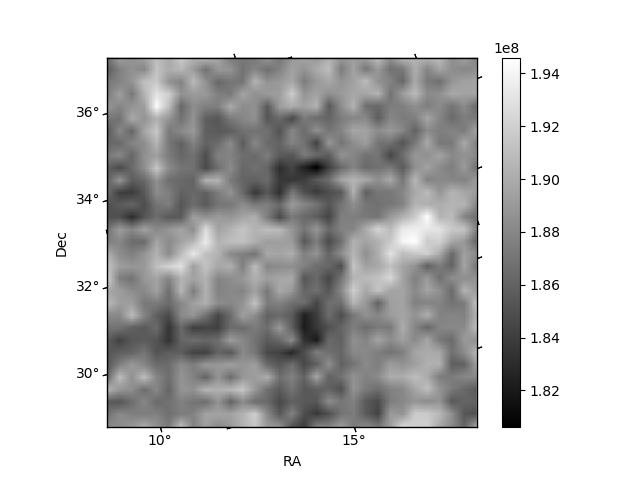
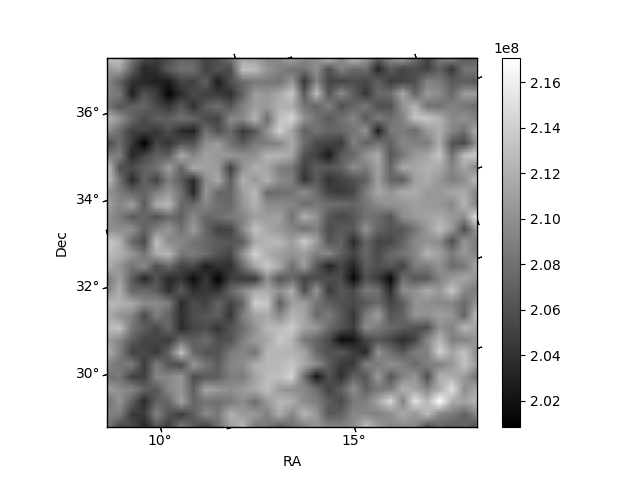
Histogram calculated using DETX and DETY for each event in the final _common_clean file
| Quadrant A | 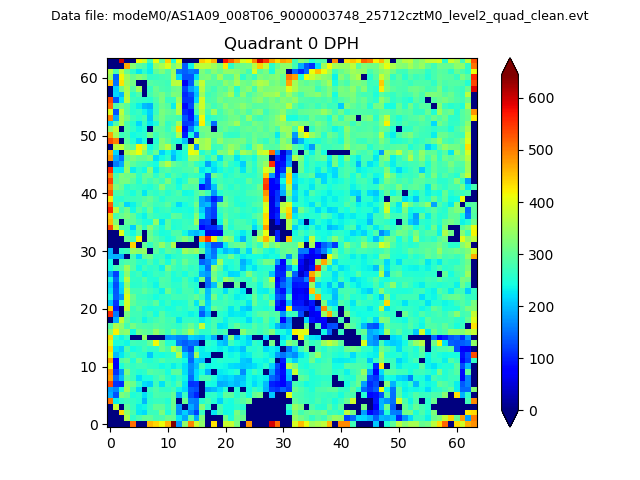 |
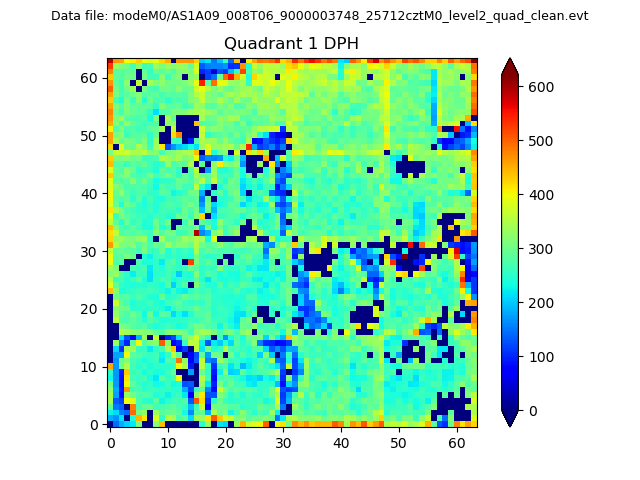 |
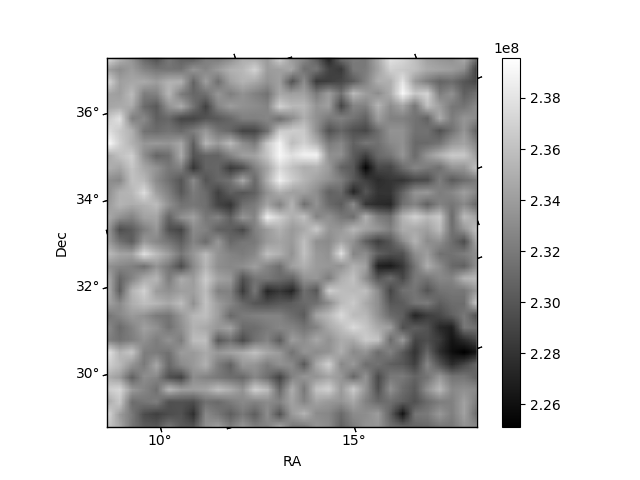
Quadrant B |
|---|---|---|---|
| Quadrant D | 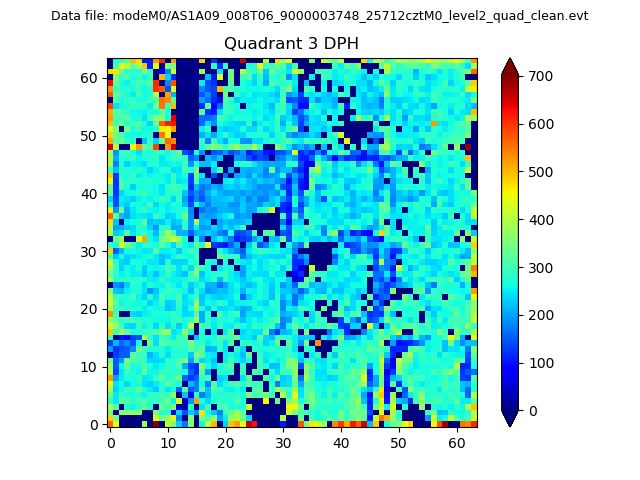 |
 |
Quadrant C |
| Plot type | Count rate plots | Images |
|---|---|---|
| Comparison with Poisson distribution Blue bars denote a histogram of data divided into 1 sec bins. Red curve is a Poisson curve with rate = median count rate of data. |
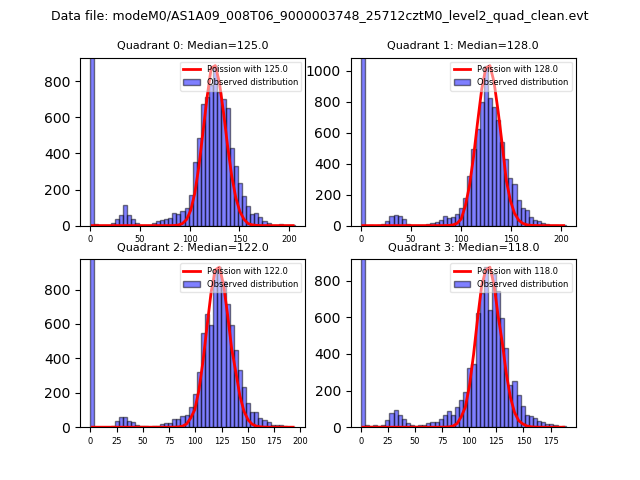 |
 |
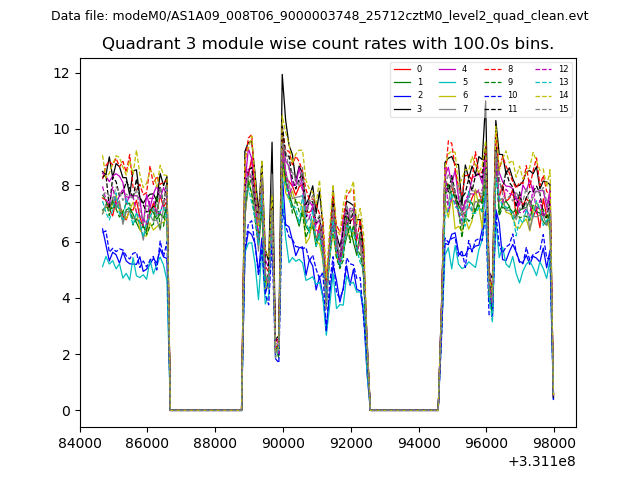
| Quadrant-wise count rates Data is divided into 100 sec bins |
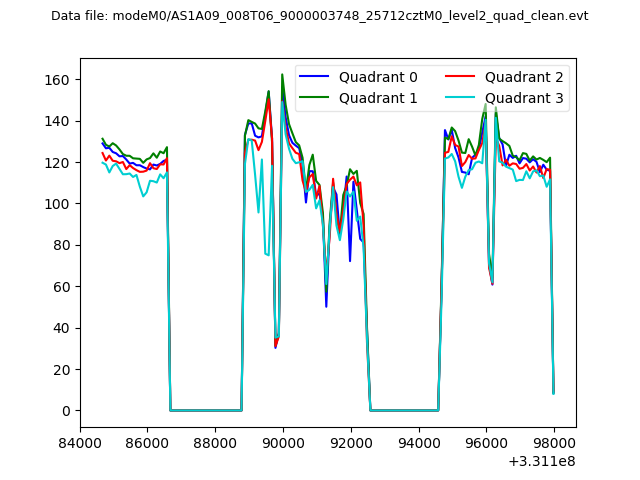 |
|
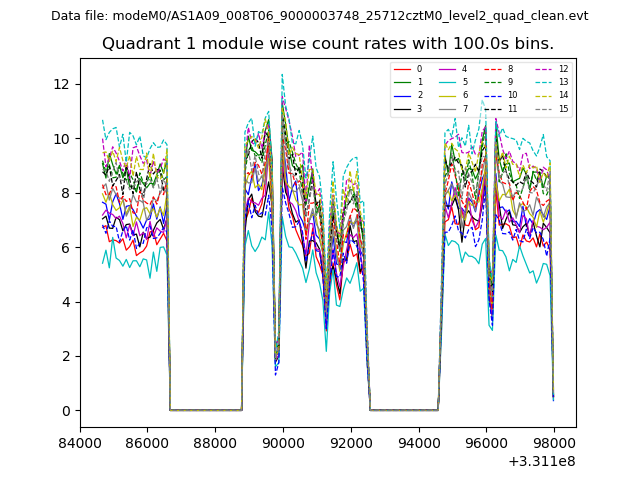
| Module-wise count rates for Quadrant A Data is divided into 100 sec bins |
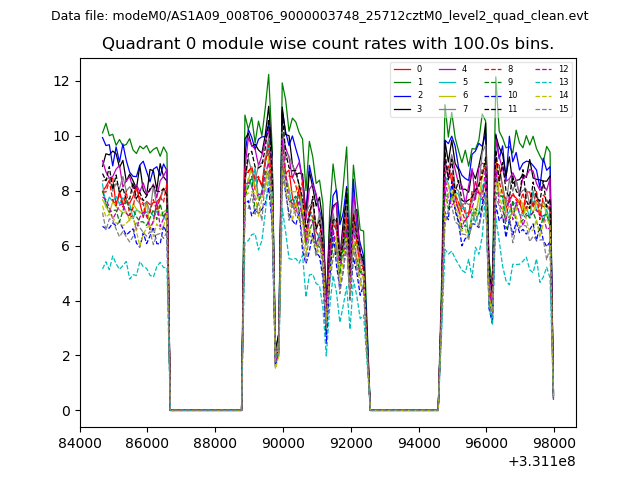 |
 |
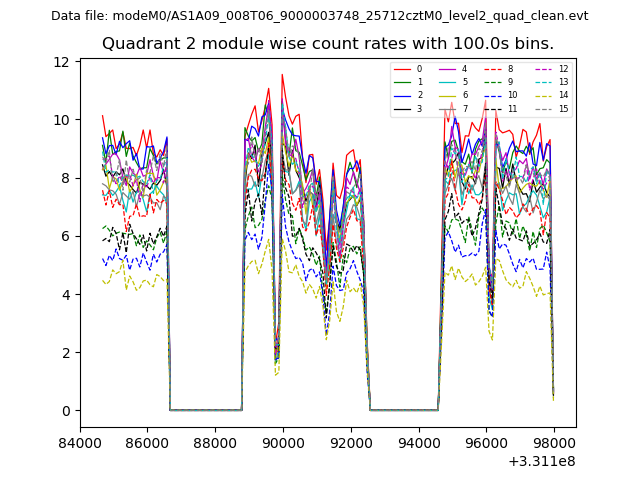
| Module-wise count rates for Quadrant B Data is divided into 100 sec bins |
 |
 |
| Module-wise count rates for Quadrant C Data is divided into 100 sec bins |
 |
 |
| Module-wise count rates for Quadrant D Data is divided into 100 sec bins |
 |
 |
| Parameter | Plot |
|---|---|
| CZT HV Monitor | 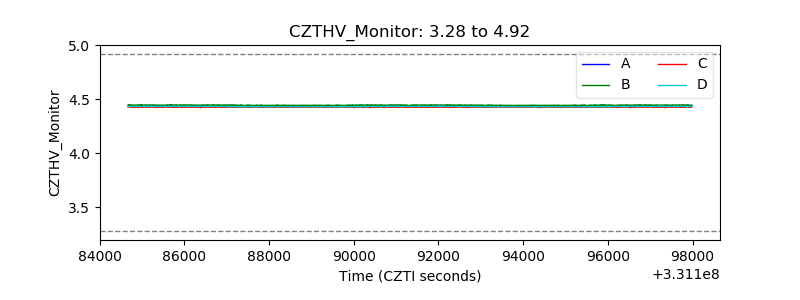 |
| D_VDD | 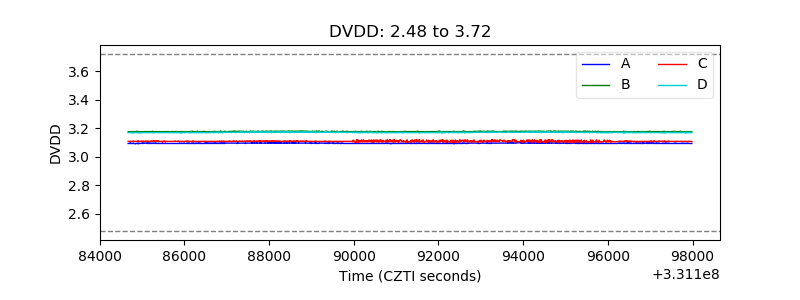 |
| Temperature 1 | 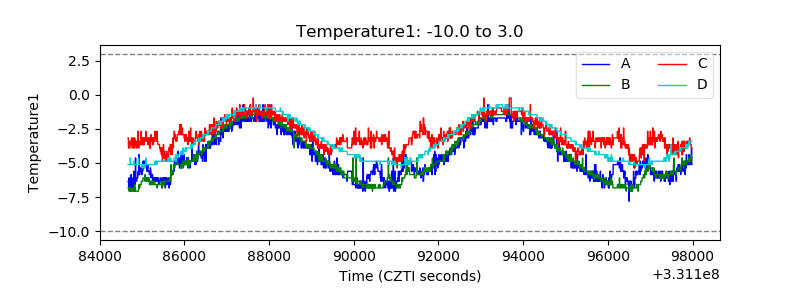 |
| Veto HV Monitor | 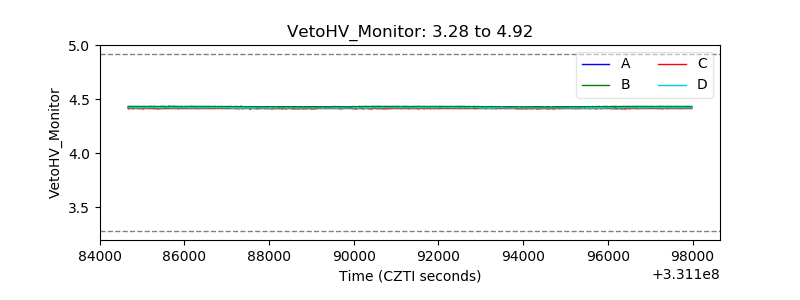 |
| Veto LLD | 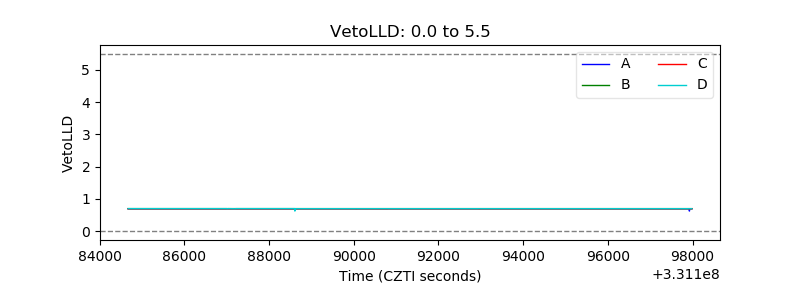 |
| Alpha Counter |  |
| _CPM_Rate | 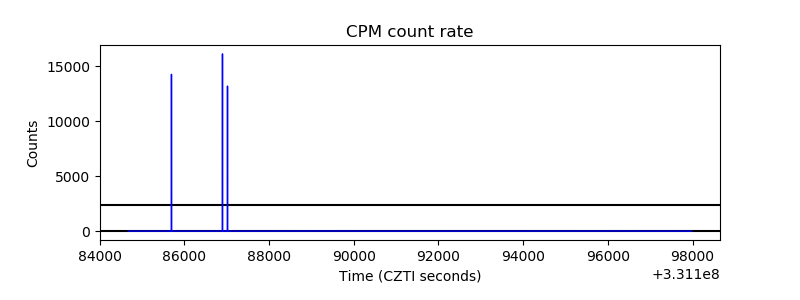 |
| CZT Counter | 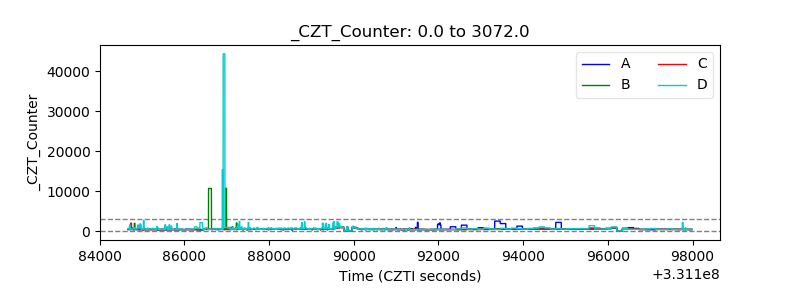 |
| +2.5 Volts monitor |  |
| +5 Volts monitor |  |
| _ROLL_ROT | 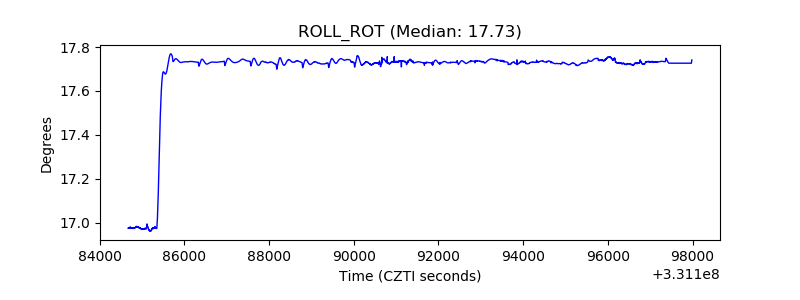 |
| _Roll_DEC | 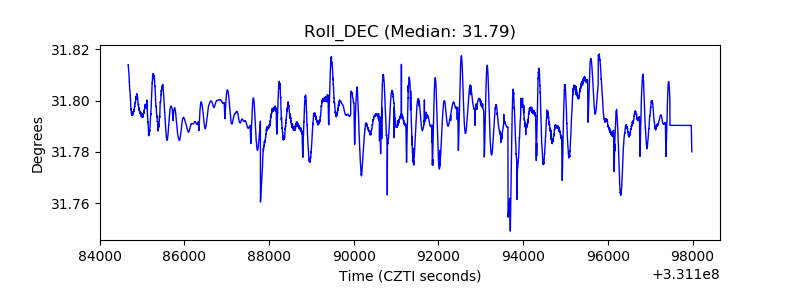 |
| _Roll_RA | 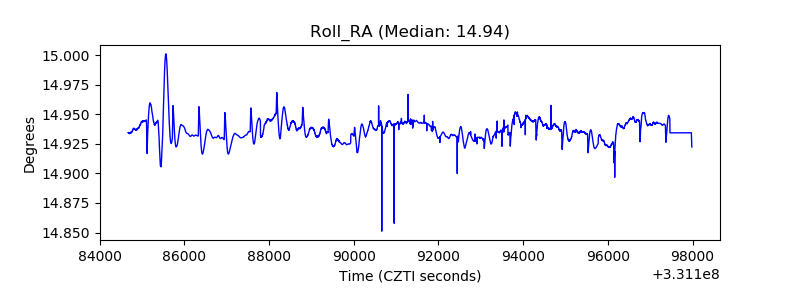 |
| Veto Counter | 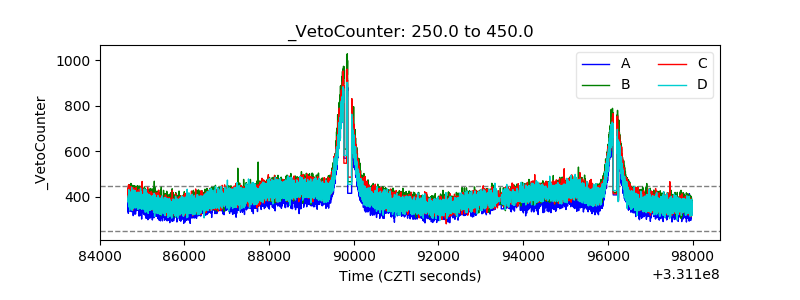 |