| Param | Original file | Final file |
|---|---|---|
| Filename | modeM0/AS1A09_008T06_9000003748_25713cztM0_level2.evt | modeM0/AS1A09_008T06_9000003748_25713cztM0_level2_quad_clean.evt |
| Size (bytes) | 478,854,720 | 88,568,640 |
| Size | 456.7 MB | 84.5 MB |
| Events in quadrant A | 3,668,571 | 528,383 |
| Events in quadrant B | 3,276,555 | 582,022 |
| Events in quadrant C | 3,213,882 | 556,306 |
| Events in quadrant D | 3,881,498 | 541,758 |
| Mode M0 | |||
|---|---|---|---|
| Quadrant | BADHDUFLAG | Total packets | Discarded packets |
| A | 0 | 15374 | 0 |
| B | 0 | 14083 | 0 |
| C | 0 | 14011 | 0 |
| D | 0 | 16059 | 0 |
| Mode M9 | |||
|---|---|---|---|
| Quadrant | BADHDUFLAG | Total packets | Discarded packets |
| A | 0 | 2 | 0 |
| B | 0 | 2 | 0 |
| C | 0 | 2 | 0 |
| D | 0 | 2 | 0 |
| Quadrant | Total seconds | Saturated seconds | Saturation percentage |
|---|---|---|---|
| A | 6788 | 478 | 7.041839% |
| B | 6789 | 163 | 2.400943% |
| C | 6789 | 172 | 2.533510% |
| D | 6789 | 190 | 2.798645% |
Noise dominated data is calculated using 1-second bins in cleaned event files. If a bin has >2000 counts, and if more than 50% of those come from <1% of pixels, then it is considered to be noise-dominated and hence unusable.
| Quadrant | # 1 sec bins | Bins with >0 counts | Bins with >2000 counts | High rate bins dominated by noise | Noise dominated (total time) | Noise dominated (detector-on time) | Marked lightcurve |
|---|---|---|---|---|---|---|---|
| A | 7048 | 6788 | 143 | 143 | 2.03% | 2.11% | 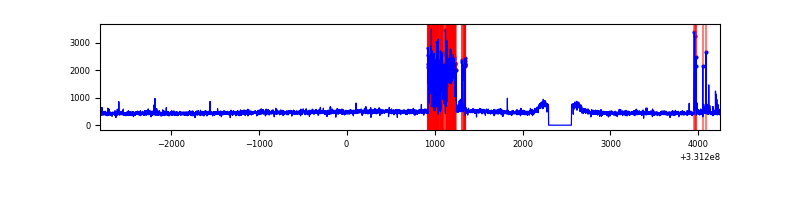 |
| B | 7049 | 6789 | 0 | 0 | 0.00% | 0.00% | 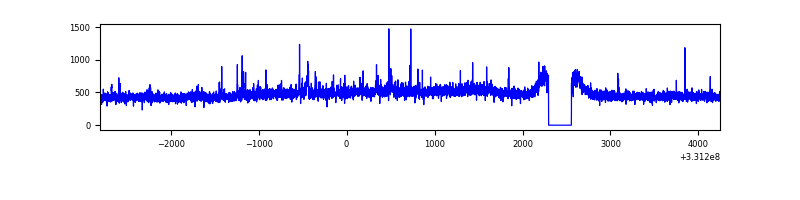 |
| C | 7049 | 6790 | 0 | 0 | 0.00% | 0.00% | 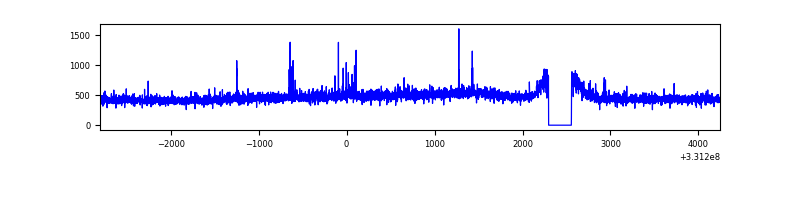 |
| D | 7049 | 6789 | 58 | 58 | 0.82% | 0.85% | 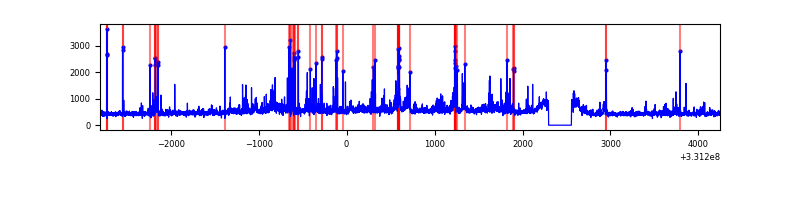 |
Top three noisy pixels from each quadrant. If the there are fewer than three noisy pixels in the level2.evt file, extra rows are filled as -1
| Pixel properties | Quadrant properties | ||||||
|---|---|---|---|---|---|---|---|
| Quadrant | DetID | PixID | Counts | Sigma | Mean | Median | Sigma |
| A | 0 | 13 | 633441 | 3987.11 | 782 | 764 | 158.7 |
| A | 4 | 2 | 15791 | 94.7 | 782 | 764 | 158.7 |
| A | 13 | 254 | 9020 | 52.03 | 782 | 764 | 158.7 |
| B | 0 | 245 | 25375 | 155.74 | 813 | 793 | 157.8 |
| B | 0 | 219 | 20929 | 127.58 | 813 | 793 | 157.8 |
| B | 12 | 111 | 19420 | 118.01 | 813 | 793 | 157.8 |
| C | 14 | 238 | 124464 | 672.52 | 779 | 783 | 183.9 |
| C | 3 | 233 | 30052 | 159.15 | 779 | 783 | 183.9 |
| C | 0 | 207 | 23304 | 122.46 | 779 | 783 | 183.9 |
| D | 1 | 52 | 418021 | 2190.47 | 788 | 766 | 190.5 |
| D | 8 | 195 | 230094 | 1203.9 | 788 | 766 | 190.5 |
| D | 7 | 80 | 165576 | 865.2 | 788 | 766 | 190.5 |
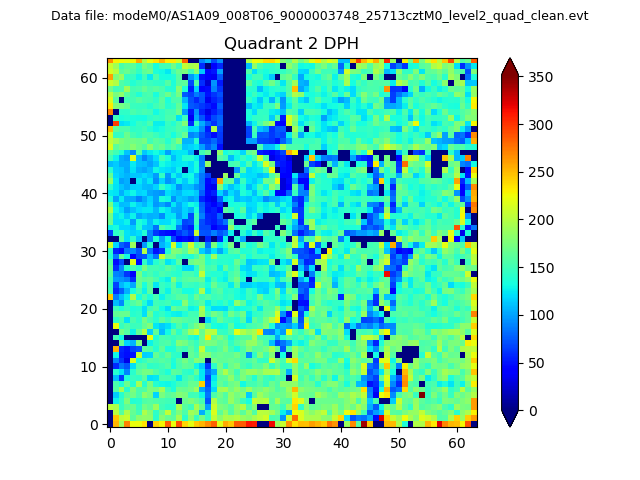
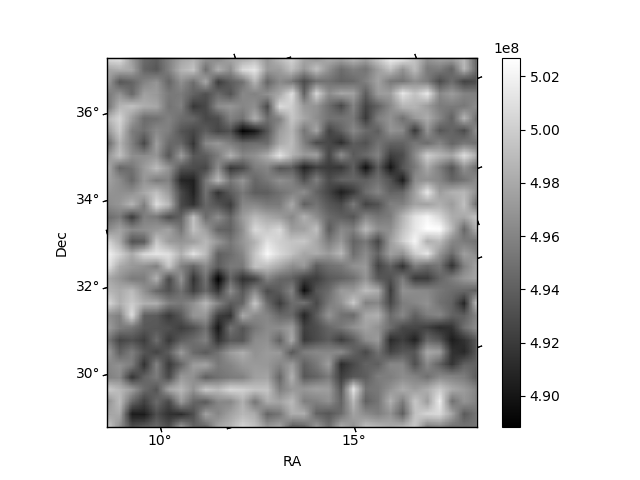
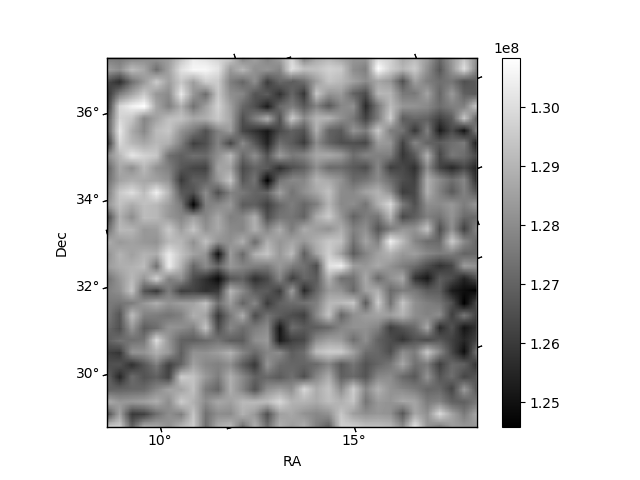
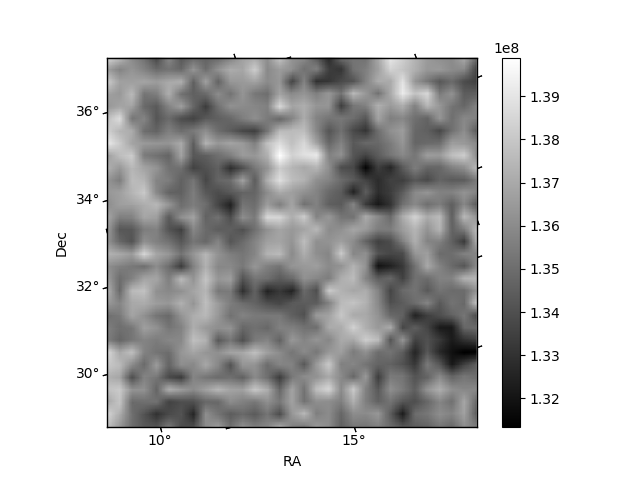
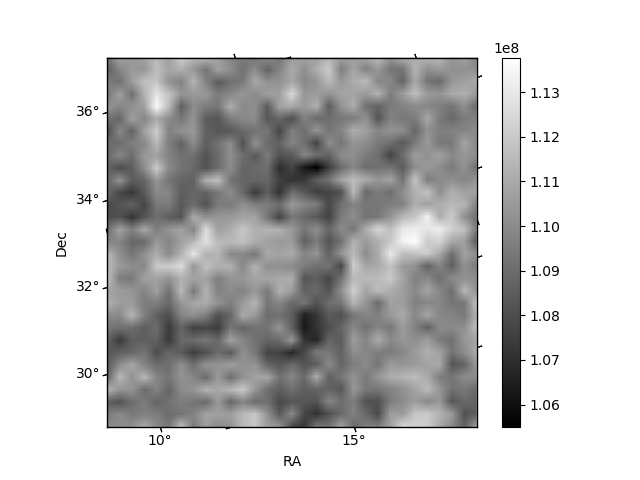
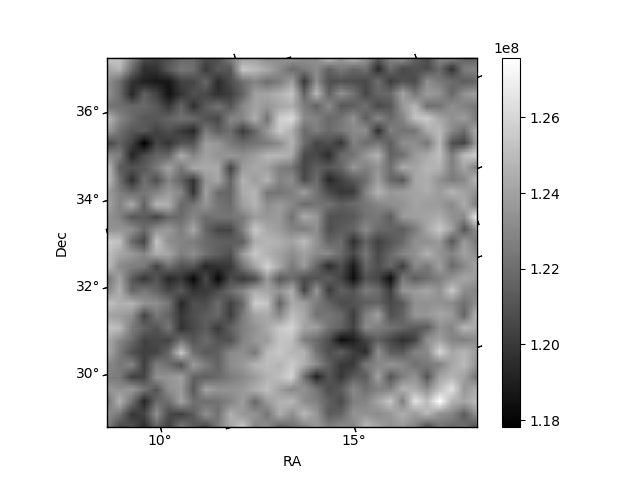
Histogram calculated using DETX and DETY for each event in the final _common_clean file
| Quadrant A | 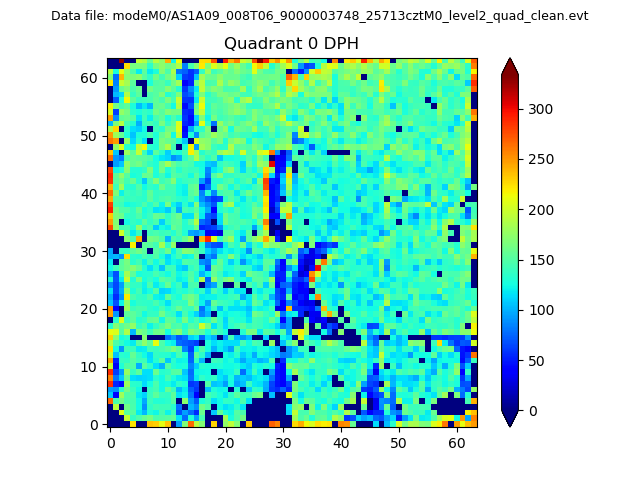 |
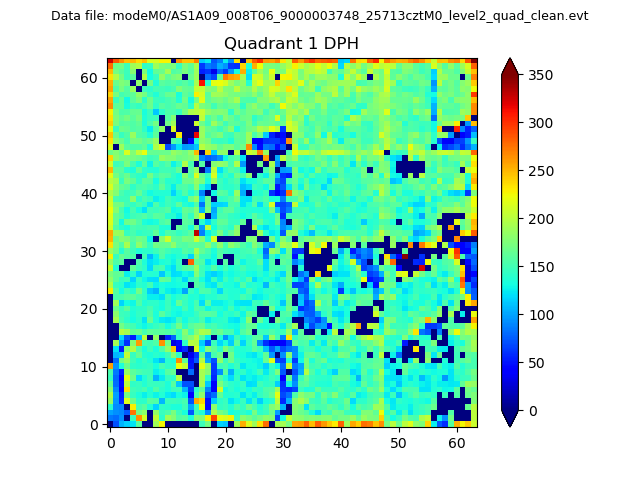 |
Quadrant B |
|---|---|---|---|
| Quadrant D | 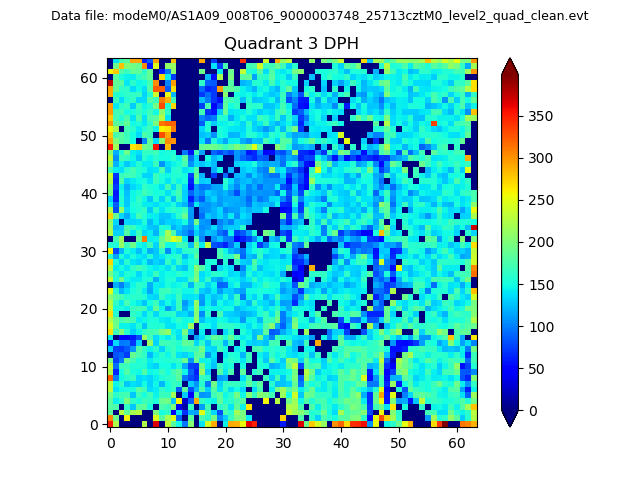 |
 |
Quadrant C |
| Plot type | Count rate plots | Images |
|---|---|---|
| Comparison with Poisson distribution Blue bars denote a histogram of data divided into 1 sec bins. Red curve is a Poisson curve with rate = median count rate of data. |
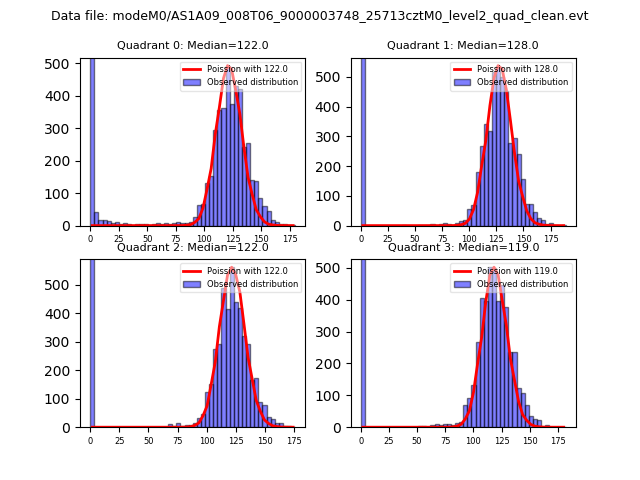 |
 |
| Quadrant-wise count rates Data is divided into 100 sec bins |
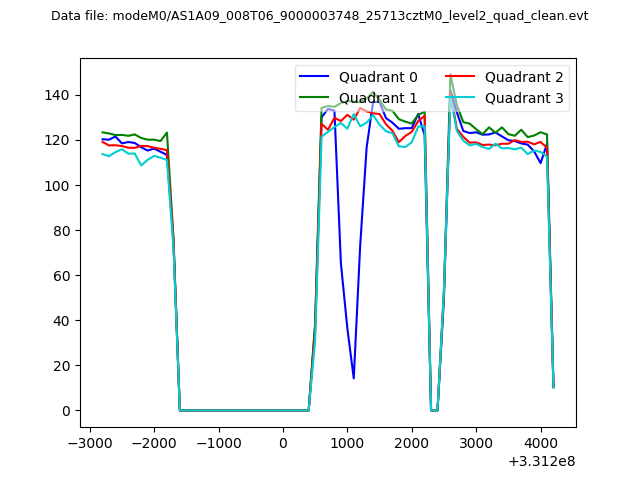 |
|
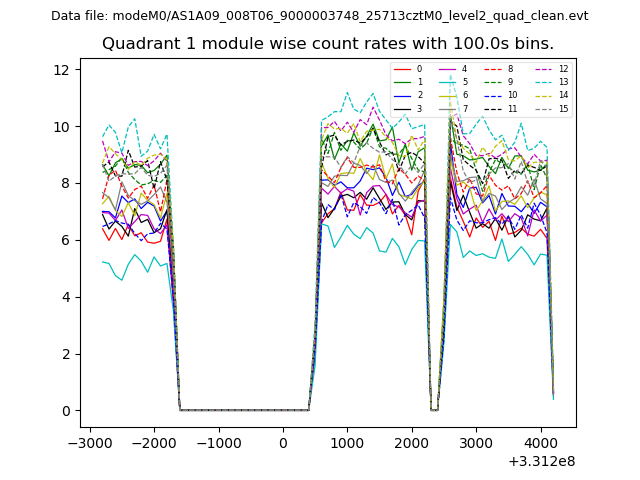
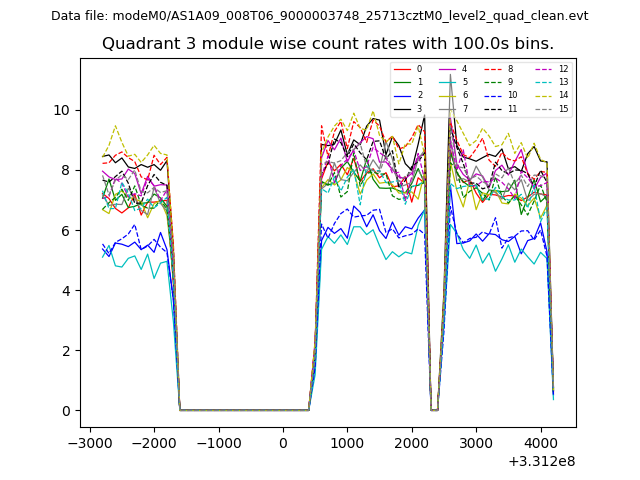
| Module-wise count rates for Quadrant A Data is divided into 100 sec bins |
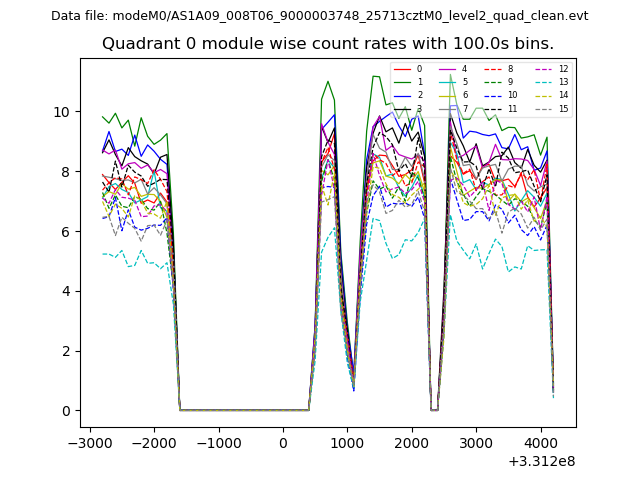 |
 |
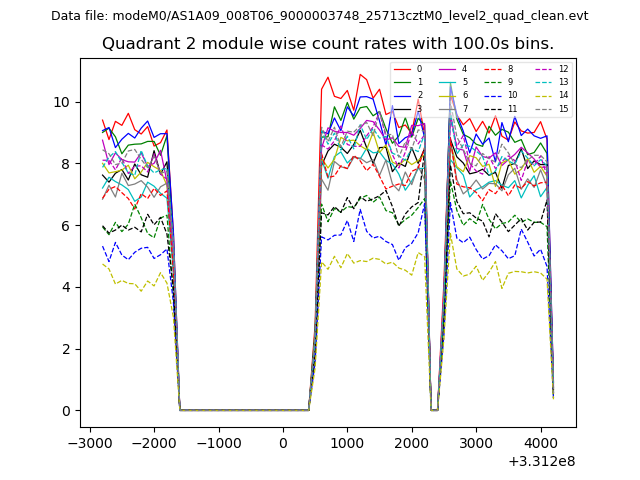
| Module-wise count rates for Quadrant B Data is divided into 100 sec bins |
 |
 |
| Module-wise count rates for Quadrant C Data is divided into 100 sec bins |
 |
 |
| Module-wise count rates for Quadrant D Data is divided into 100 sec bins |
 |
 |
| Parameter | Plot |
|---|---|
| CZT HV Monitor | 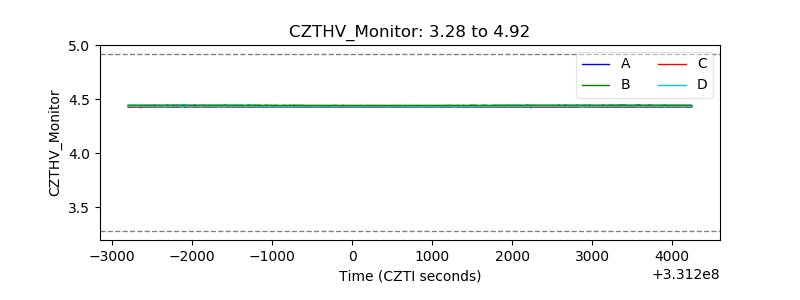 |
| D_VDD | 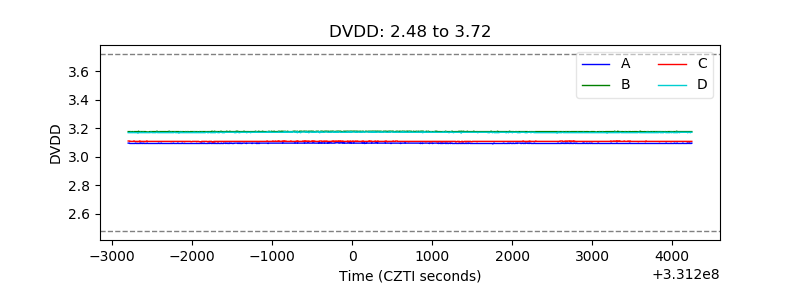 |
| Temperature 1 | 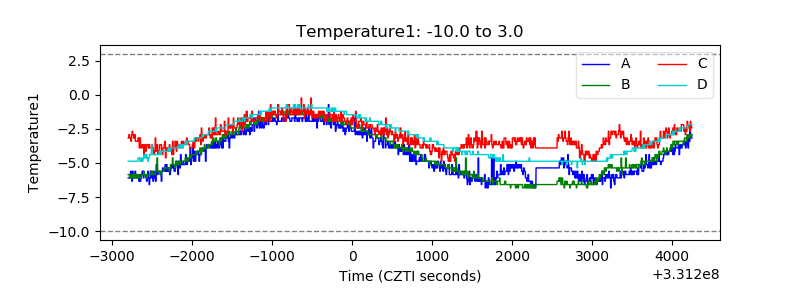 |
| Veto HV Monitor | 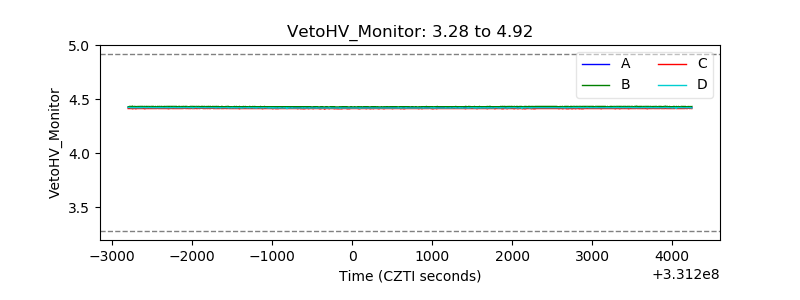 |
| Veto LLD | 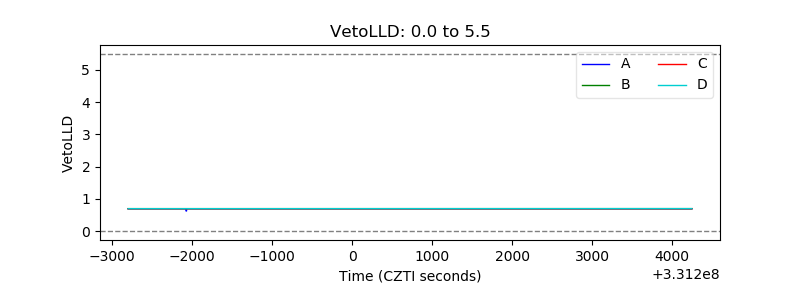 |
| Alpha Counter |  |
| _CPM_Rate | 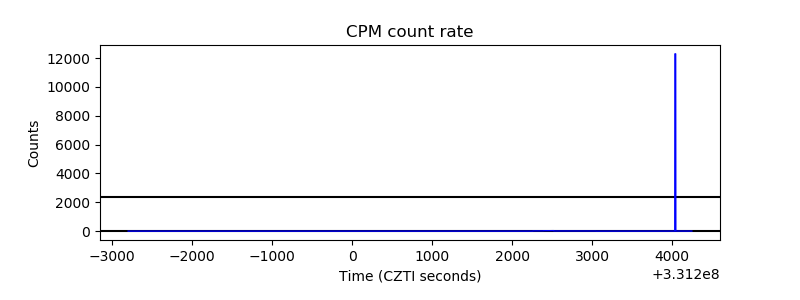 |
| CZT Counter | 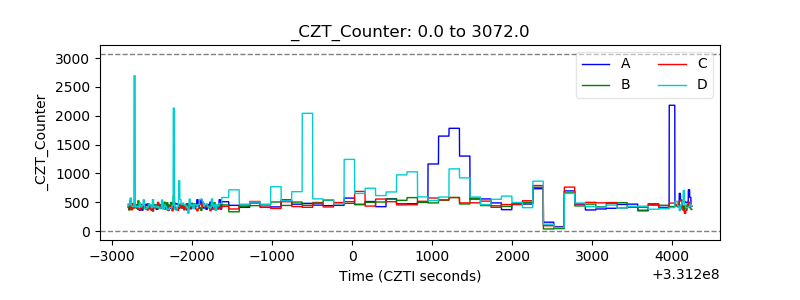 |
| +2.5 Volts monitor |  |
| +5 Volts monitor |  |
| _ROLL_ROT | 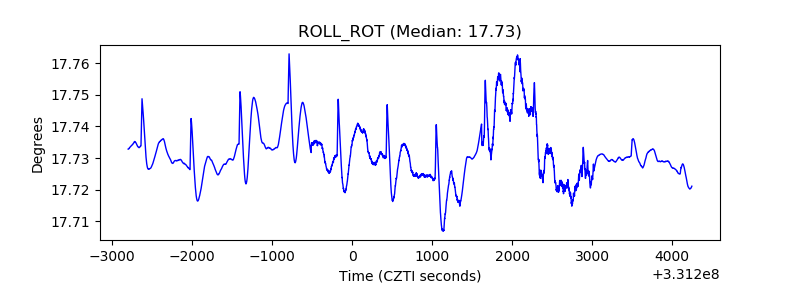 |
| _Roll_DEC | 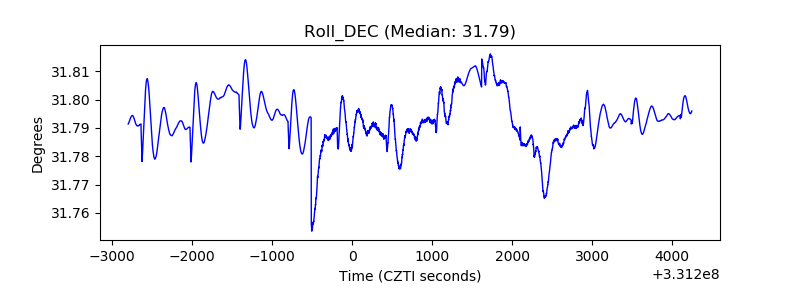 |
| _Roll_RA | 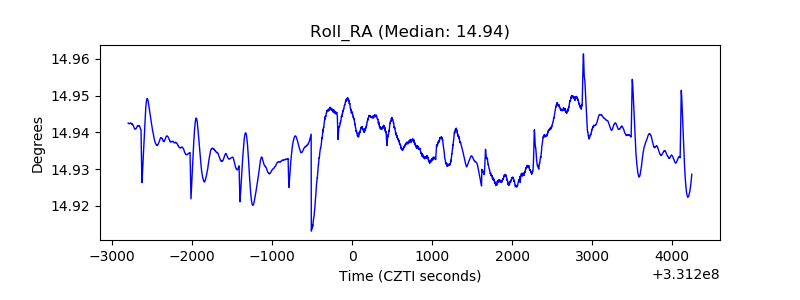 |
| Veto Counter | 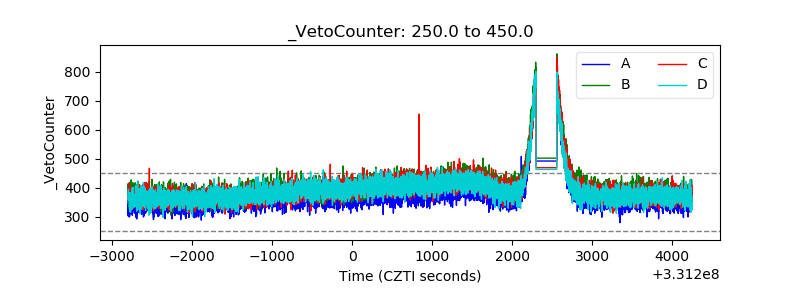 |