| Param | Original file | Final file |
|---|---|---|
| Filename | modeM0/AS1A09_008T06_9000003748_25715cztM0_level2.evt | modeM0/AS1A09_008T06_9000003748_25715cztM0_level2_quad_clean.evt |
| Size (bytes) | 944,231,040 | 144,892,800 |
| Size | 900.5 MB | 138.2 MB |
| Events in quadrant A | 6,520,697 | 882,420 |
| Events in quadrant B | 6,076,797 | 920,258 |
| Events in quadrant C | 5,875,079 | 878,963 |
| Events in quadrant D | 9,282,924 | 846,667 |
| Mode M0 | |||
|---|---|---|---|
| Quadrant | BADHDUFLAG | Total packets | Discarded packets |
| A | 0 | 27279 | 0 |
| B | 0 | 25518 | 0 |
| C | 0 | 25224 | 0 |
| D | 0 | 35891 | 0 |
| Mode M9 | |||
|---|---|---|---|
| Quadrant | BADHDUFLAG | Total packets | Discarded packets |
| A | 0 | 12 | 0 |
| B | 0 | 12 | 0 |
| C | 0 | 12 | 0 |
| D | 0 | 12 | 0 |
| Quadrant | Total seconds | Saturated seconds | Saturation percentage |
|---|---|---|---|
| A | 12426 | 442 | 3.557058% |
| B | 12426 | 134 | 1.078384% |
| C | 12426 | 140 | 1.126670% |
| D | 12426 | 493 | 3.967488% |
Noise dominated data is calculated using 1-second bins in cleaned event files. If a bin has >2000 counts, and if more than 50% of those come from <1% of pixels, then it is considered to be noise-dominated and hence unusable.
| Quadrant | # 1 sec bins | Bins with >0 counts | Bins with >2000 counts | High rate bins dominated by noise | Noise dominated (total time) | Noise dominated (detector-on time) | Marked lightcurve |
|---|---|---|---|---|---|---|---|
| A | 13676 | 12426 | 164 | 164 | 1.20% | 1.32% | 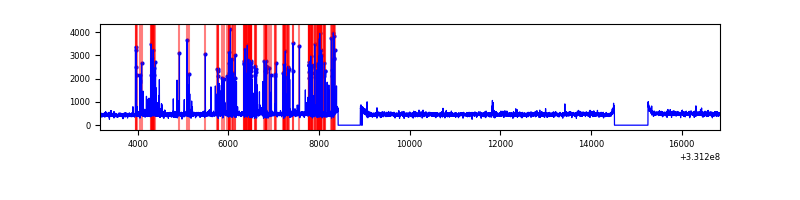 |
| B | 13676 | 12428 | 5 | 5 | 0.04% | 0.04% | 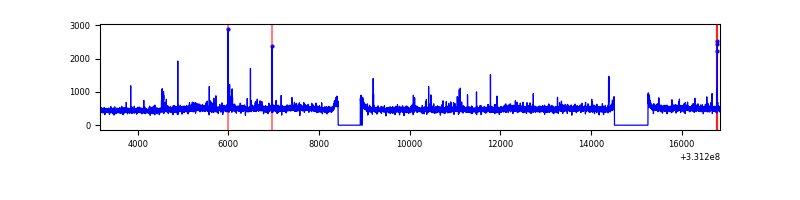 |
| C | 13676 | 12428 | 0 | 0 | 0.00% | 0.00% | 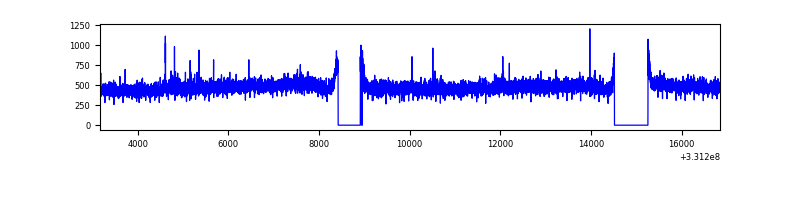 |
| D | 13676 | 12428 | 365 | 365 | 2.67% | 2.94% | 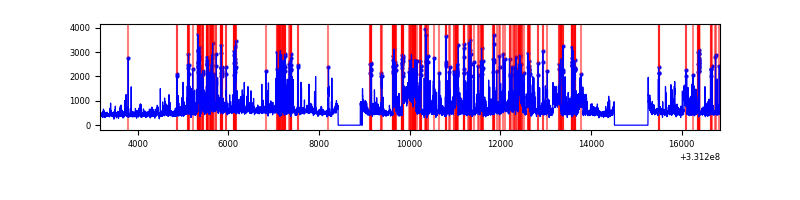 |
Top three noisy pixels from each quadrant. If the there are fewer than three noisy pixels in the level2.evt file, extra rows are filled as -1
| Pixel properties | Quadrant properties | ||||||
|---|---|---|---|---|---|---|---|
| Quadrant | DetID | PixID | Counts | Sigma | Mean | Median | Sigma |
| A | 0 | 13 | 815549 | 2725.83 | 1479 | 1447 | 298.7 |
| A | 13 | 254 | 18774 | 58.01 | 1479 | 1447 | 298.7 |
| A | 3 | 137 | 13804 | 41.37 | 1479 | 1447 | 298.7 |
| B | 0 | 219 | 75426 | 257.81 | 1498 | 1460 | 286.9 |
| B | 0 | 245 | 48420 | 163.68 | 1498 | 1460 | 286.9 |
| B | 0 | 190 | 39676 | 133.2 | 1498 | 1460 | 286.9 |
| C | 14 | 238 | 227714 | 675.63 | 1433 | 1440 | 334.9 |
| C | 3 | 233 | 57296 | 166.78 | 1433 | 1440 | 334.9 |
| C | 13 | 61 | 9914 | 25.3 | 1433 | 1440 | 334.9 |
| D | 1 | 52 | 2806676 | 7991.7 | 1444 | 1403 | 351.0 |
| D | 7 | 80 | 745530 | 2119.88 | 1444 | 1403 | 351.0 |
| D | 8 | 195 | 114881 | 323.28 | 1444 | 1403 | 351.0 |
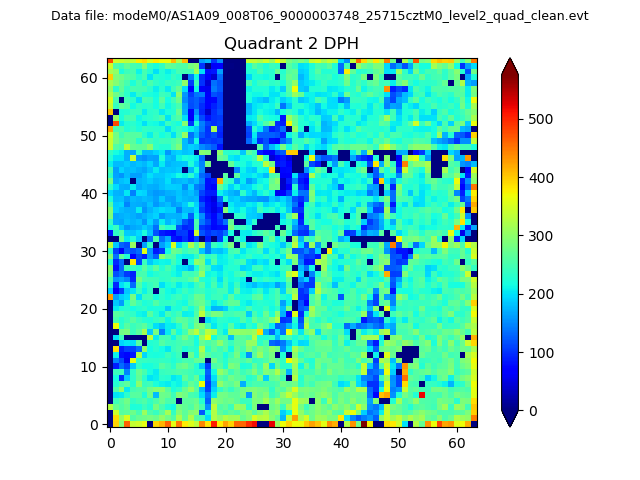
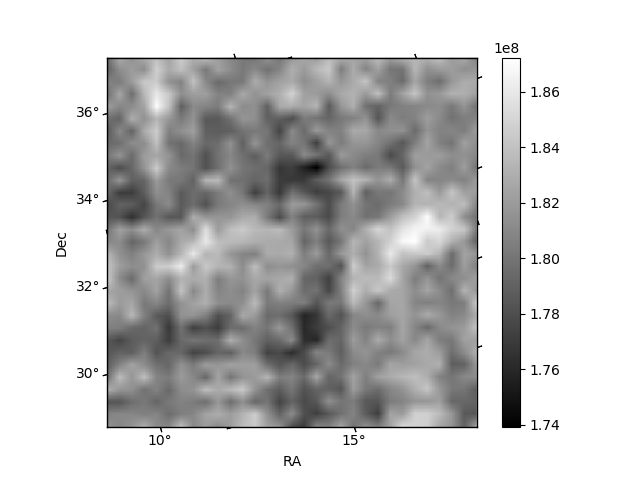
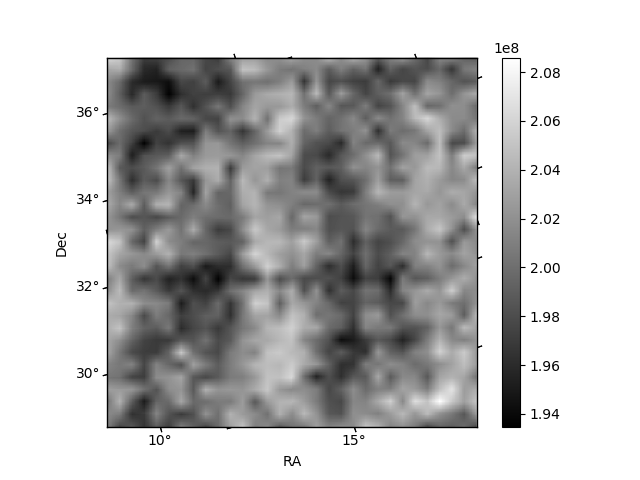
Histogram calculated using DETX and DETY for each event in the final _common_clean file
| Quadrant A | 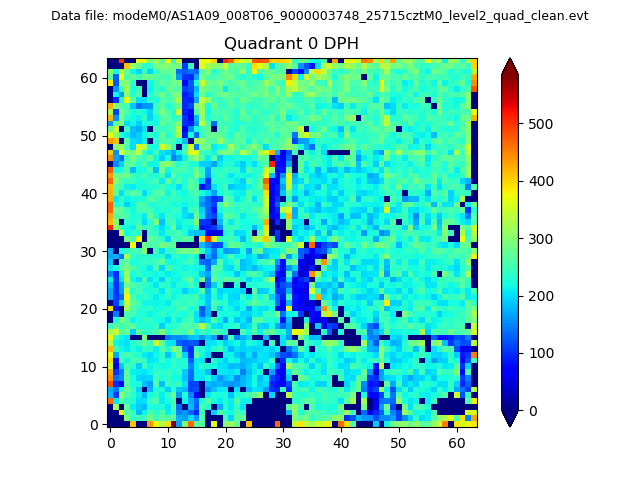 |
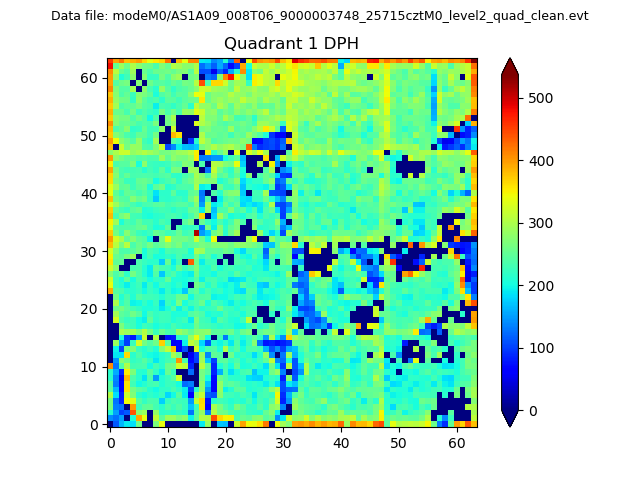 |
Quadrant B |
|---|---|---|---|
| Quadrant D | 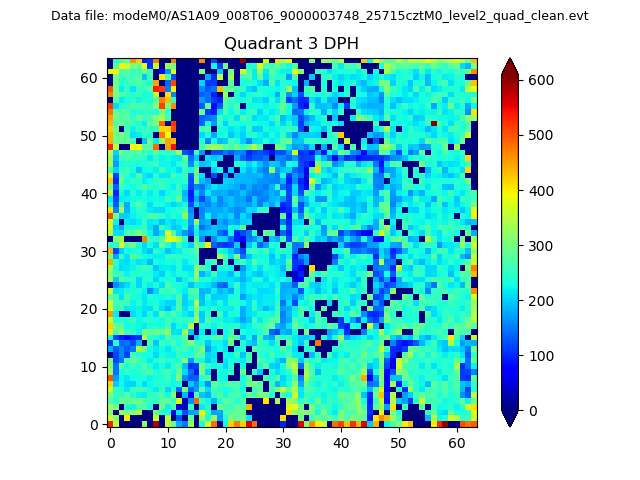 |
 |
Quadrant C |
| Plot type | Count rate plots | Images |
|---|---|---|
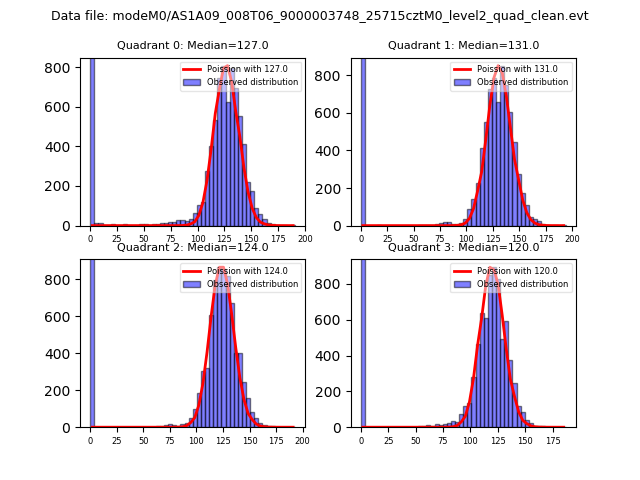
| Comparison with Poisson distribution Blue bars denote a histogram of data divided into 1 sec bins. Red curve is a Poisson curve with rate = median count rate of data. |
 |
 |
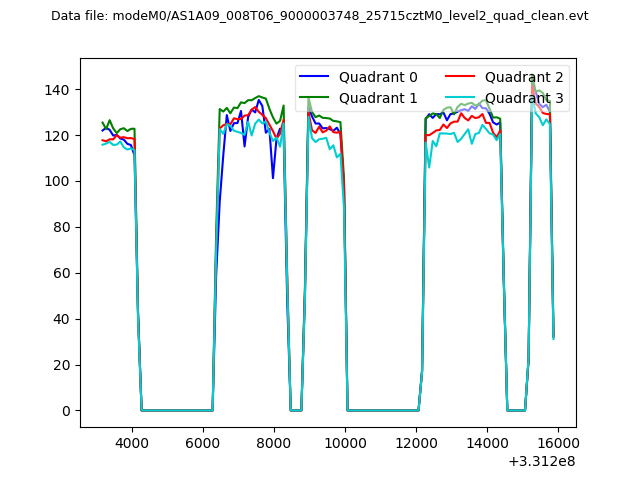
| Quadrant-wise count rates Data is divided into 100 sec bins |
 |
|
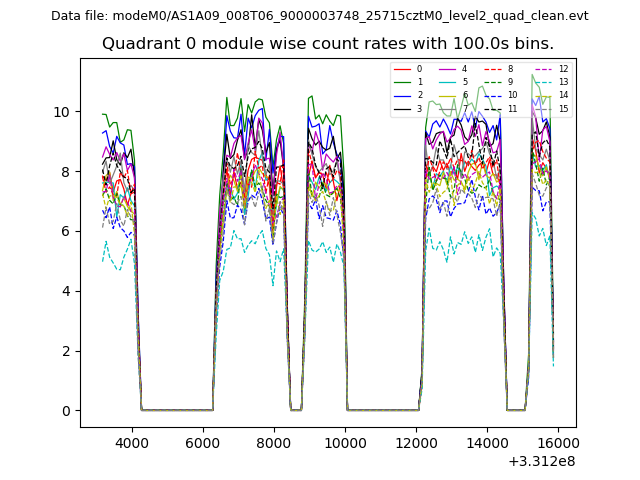
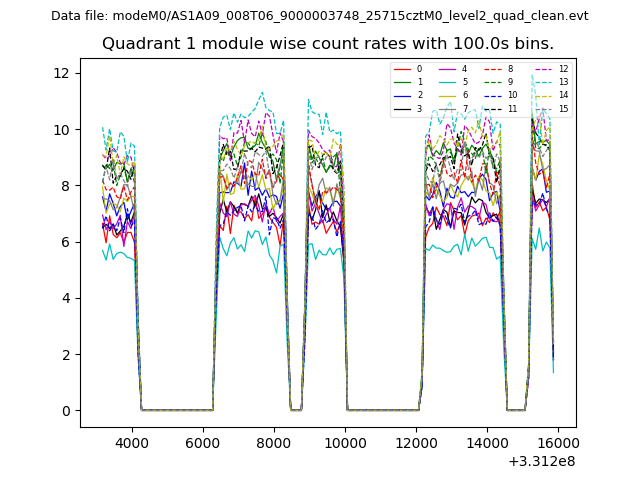
| Module-wise count rates for Quadrant A Data is divided into 100 sec bins |
 |
 |
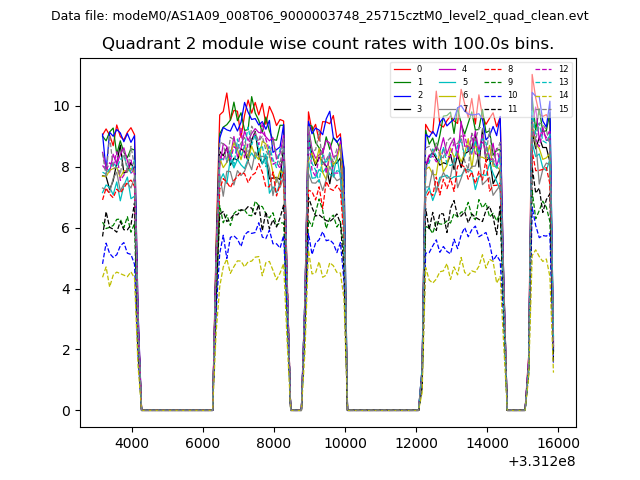
| Module-wise count rates for Quadrant B Data is divided into 100 sec bins |
 |
 |
| Module-wise count rates for Quadrant C Data is divided into 100 sec bins |
 |
 |
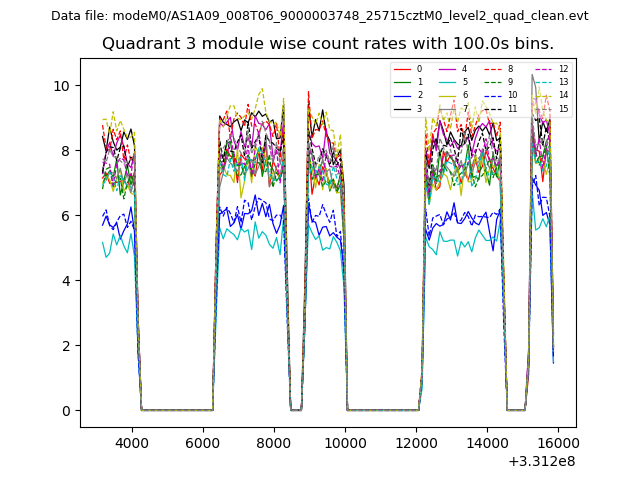
| Module-wise count rates for Quadrant D Data is divided into 100 sec bins |
 |
 |
| Parameter | Plot |
|---|---|
| CZT HV Monitor | 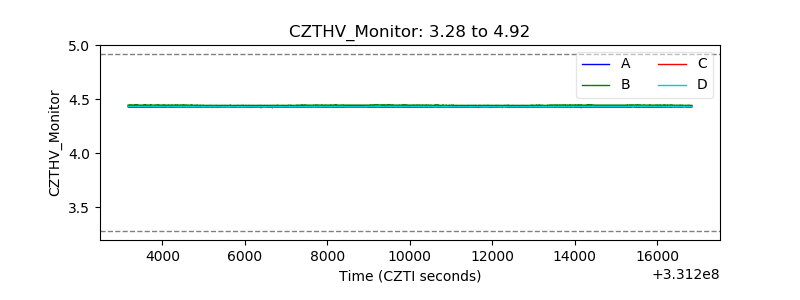 |
| D_VDD | 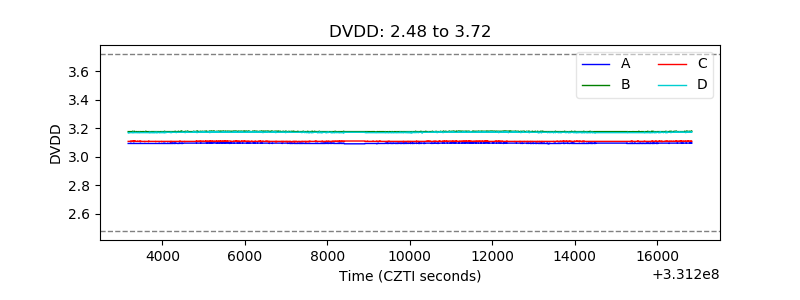 |
| Temperature 1 | 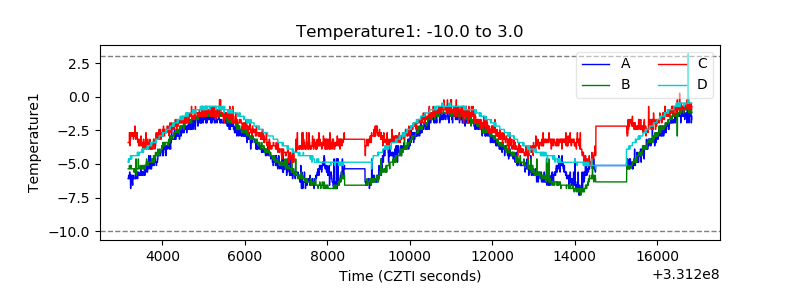 |
| Veto HV Monitor | 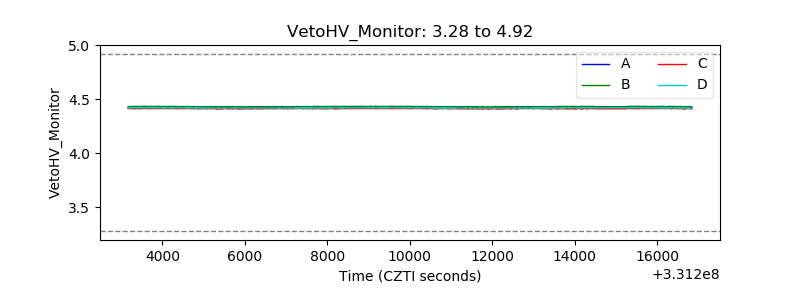 |
| Veto LLD |  |
| Alpha Counter | 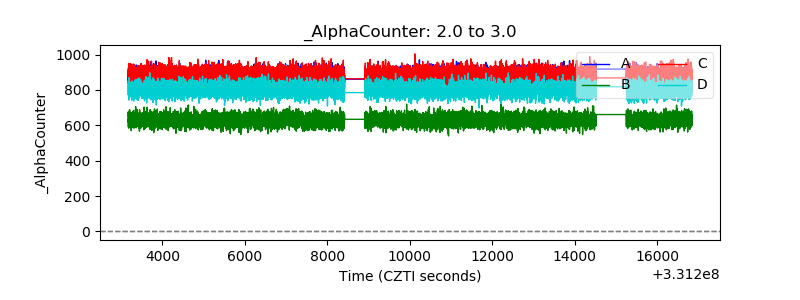 |
| _CPM_Rate | 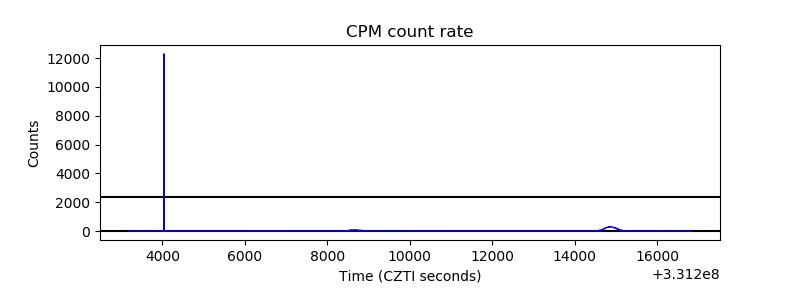 |
| CZT Counter | 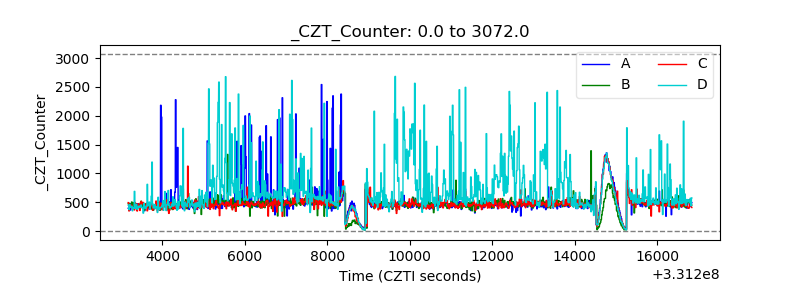 |
| +2.5 Volts monitor | 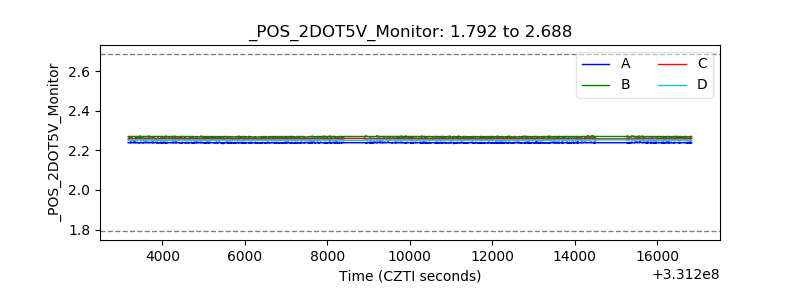 |
| +5 Volts monitor |  |
| _ROLL_ROT | 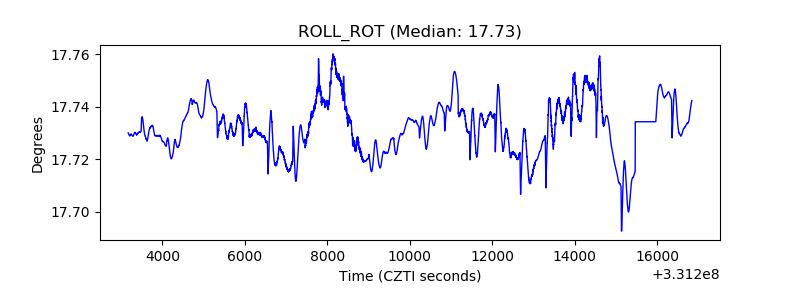 |
| _Roll_DEC | 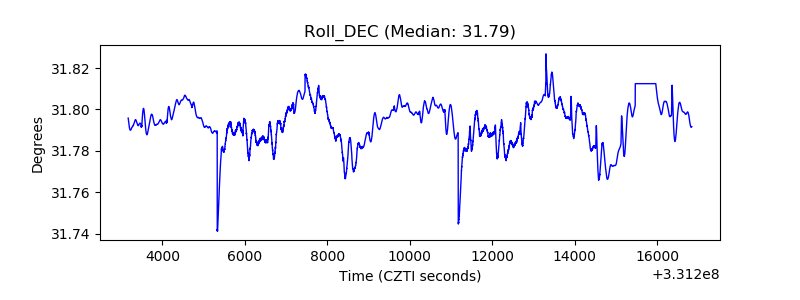 |
| _Roll_RA | 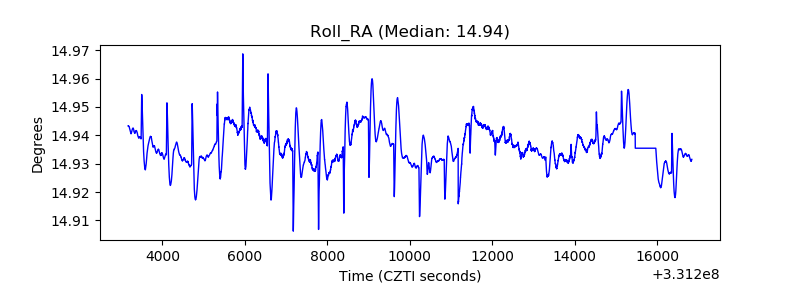 |
| Veto Counter | 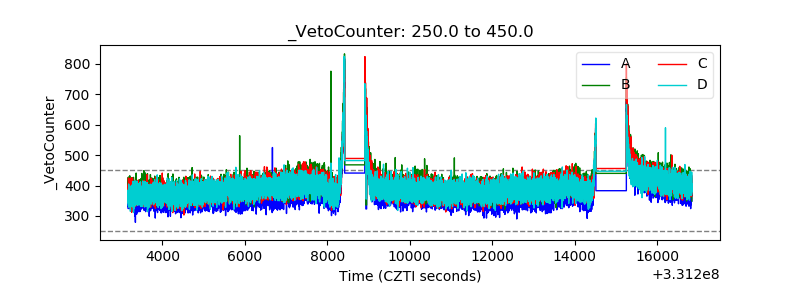 |