| Param | Original file | Final file |
|---|---|---|
| Filename | modeM0/AS1A09_008T06_9000003748_25716cztM0_level2.evt | modeM0/AS1A09_008T06_9000003748_25716cztM0_level2_quad_clean.evt |
| Size (bytes) | 507,185,280 | 71,876,160 |
| Size | 483.7 MB | 68.5 MB |
| Events in quadrant A | 3,339,006 | 433,985 |
| Events in quadrant B | 3,468,170 | 440,026 |
| Events in quadrant C | 3,405,410 | 417,304 |
| Events in quadrant D | 4,681,694 | 406,702 |
| Mode M0 | |||
|---|---|---|---|
| Quadrant | BADHDUFLAG | Total packets | Discarded packets |
| A | 0 | 14120 | 0 |
| B | 0 | 14315 | 0 |
| C | 0 | 14300 | 0 |
| D | 0 | 18298 | 0 |
| Mode M9 | |||
|---|---|---|---|
| Quadrant | BADHDUFLAG | Total packets | Discarded packets |
| A | 0 | 9 | 0 |
| B | 0 | 9 | 0 |
| C | 0 | 9 | 0 |
| D | 0 | 9 | 0 |
| Quadrant | Total seconds | Saturated seconds | Saturation percentage |
|---|---|---|---|
| A | 6861 | 50 | 0.728757% |
| B | 6862 | 57 | 0.830662% |
| C | 6862 | 86 | 1.253279% |
| D | 6861 | 222 | 3.235680% |
Noise dominated data is calculated using 1-second bins in cleaned event files. If a bin has >2000 counts, and if more than 50% of those come from <1% of pixels, then it is considered to be noise-dominated and hence unusable.
| Quadrant | # 1 sec bins | Bins with >0 counts | Bins with >2000 counts | High rate bins dominated by noise | Noise dominated (total time) | Noise dominated (detector-on time) | Marked lightcurve |
|---|---|---|---|---|---|---|---|
| A | 7761 | 6861 | 0 | 0 | 0.00% | 0.00% | 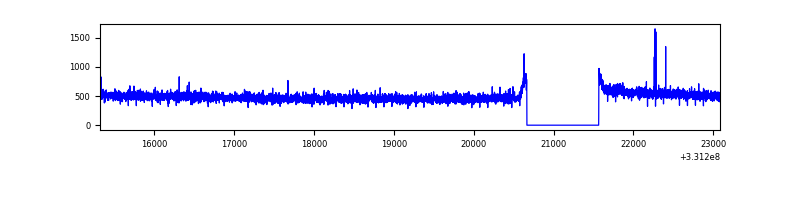 |
| B | 7762 | 6862 | 3 | 3 | 0.04% | 0.04% | 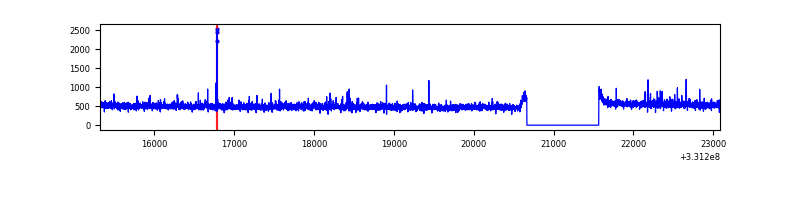 |
| C | 7762 | 6862 | 3 | 3 | 0.04% | 0.04% | 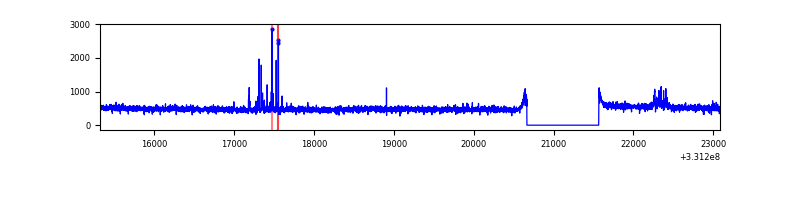 |
| D | 7761 | 6861 | 151 | 151 | 1.95% | 2.20% | 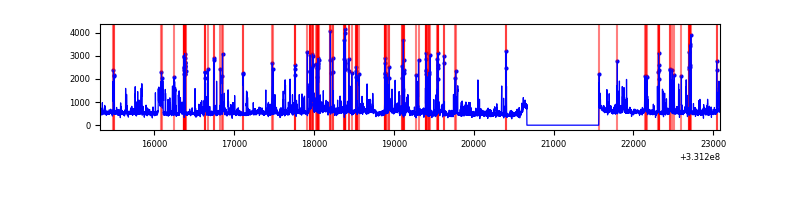 |
Top three noisy pixels from each quadrant. If the there are fewer than three noisy pixels in the level2.evt file, extra rows are filled as -1
| Pixel properties | Quadrant properties | ||||||
|---|---|---|---|---|---|---|---|
| Quadrant | DetID | PixID | Counts | Sigma | Mean | Median | Sigma |
| A | 0 | 13 | 18835 | 104.19 | 860 | 839 | 172.7 |
| A | 13 | 254 | 11454 | 61.46 | 860 | 839 | 172.7 |
| A | 3 | 137 | 7853 | 40.61 | 860 | 839 | 172.7 |
| B | 0 | 219 | 43410 | 261.03 | 852 | 830 | 163.1 |
| B | 0 | 190 | 34745 | 207.91 | 852 | 830 | 163.1 |
| B | 12 | 111 | 19859 | 116.65 | 852 | 830 | 163.1 |
| C | 14 | 238 | 130436 | 675.07 | 815 | 820 | 192.0 |
| C | 3 | 233 | 63662 | 327.3 | 815 | 820 | 192.0 |
| C | 0 | 207 | 37565 | 191.38 | 815 | 820 | 192.0 |
| D | 1 | 52 | 1038716 | 5093.6 | 825 | 799 | 203.8 |
| D | 7 | 80 | 167991 | 820.5 | 825 | 799 | 203.8 |
| D | 8 | 195 | 155495 | 759.17 | 825 | 799 | 203.8 |
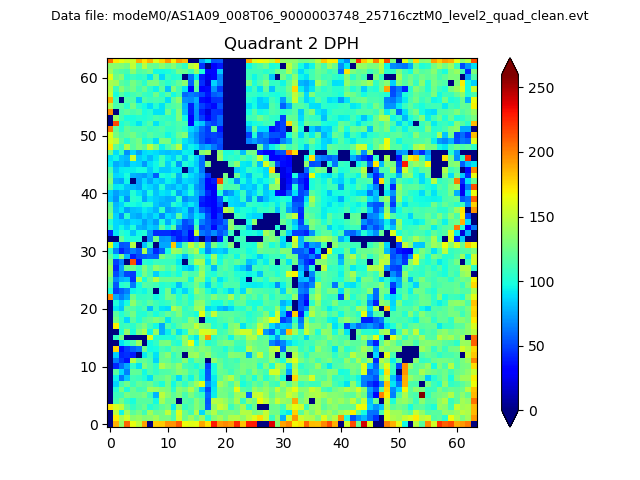
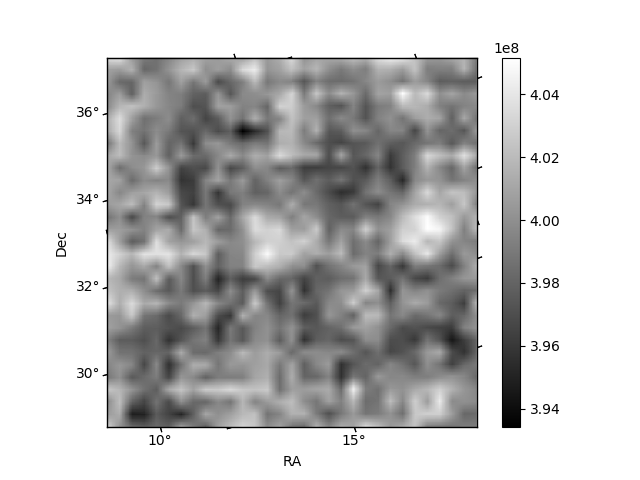
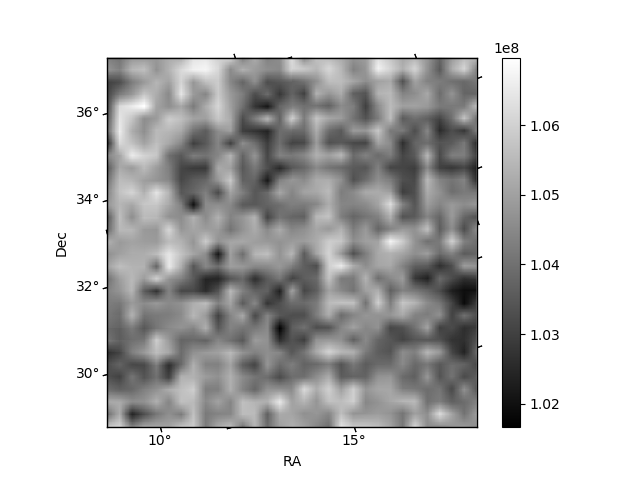
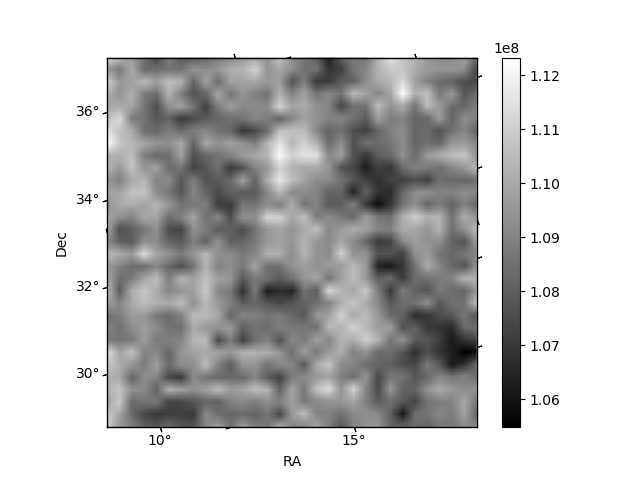
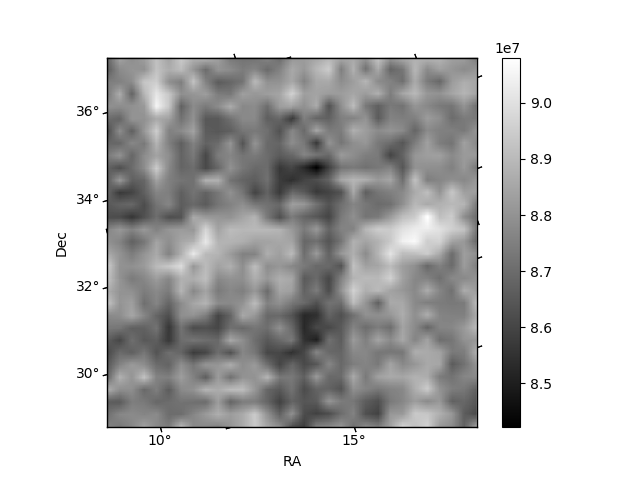
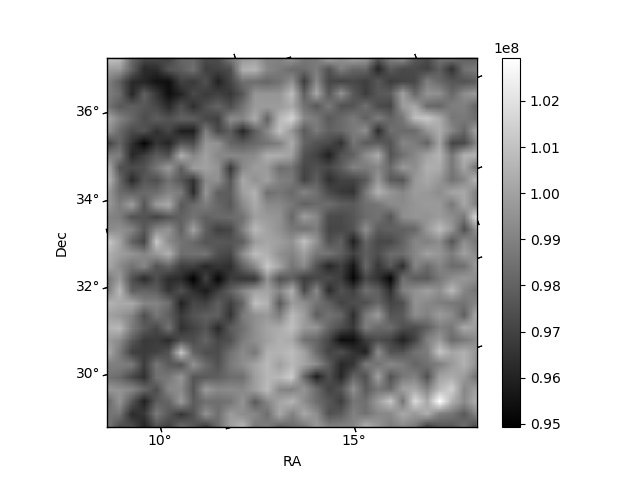
Histogram calculated using DETX and DETY for each event in the final _common_clean file
| Quadrant A | 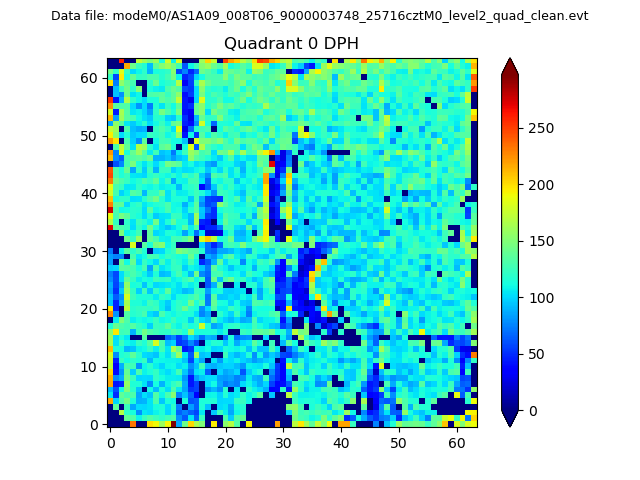 |
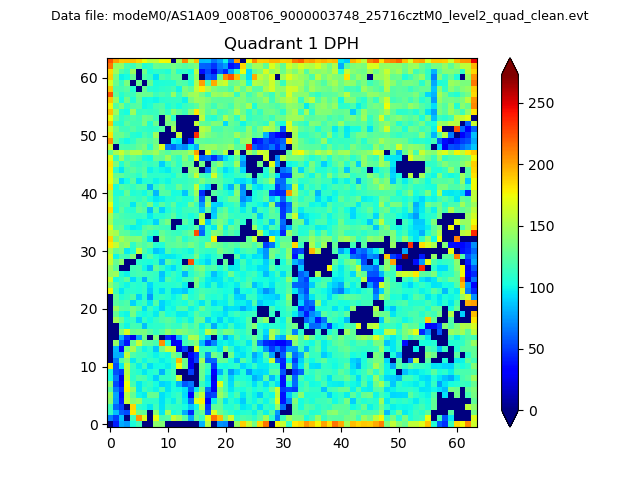 |
Quadrant B |
|---|---|---|---|
| Quadrant D | 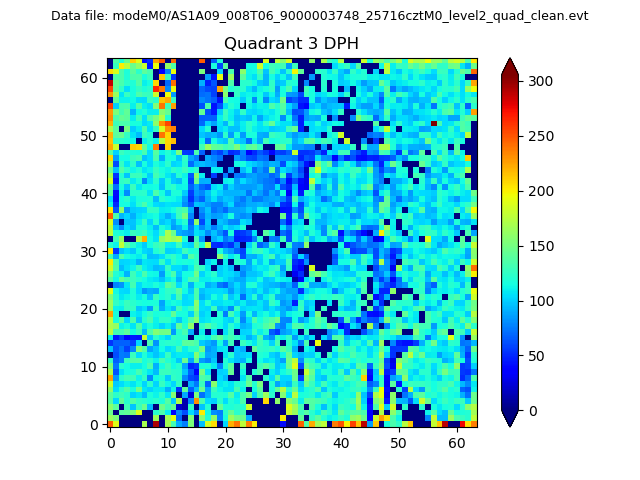 |
 |
Quadrant C |
| Plot type | Count rate plots | Images |
|---|---|---|
| Comparison with Poisson distribution Blue bars denote a histogram of data divided into 1 sec bins. Red curve is a Poisson curve with rate = median count rate of data. |
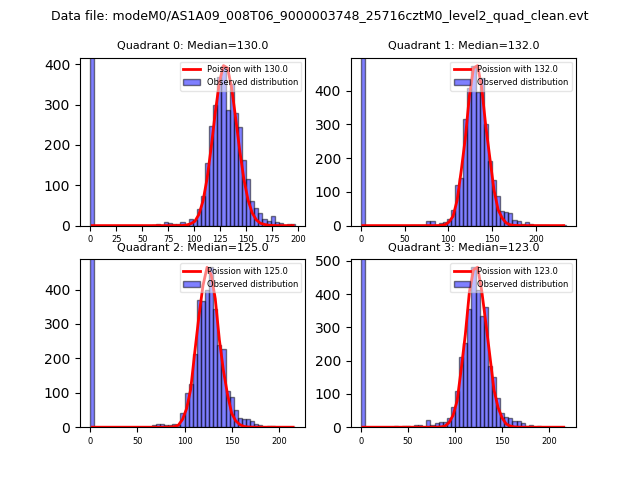 |
 |
| Quadrant-wise count rates Data is divided into 100 sec bins |
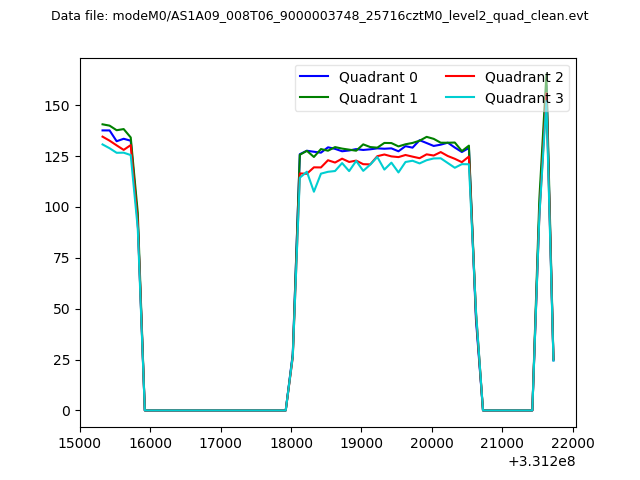 |
|
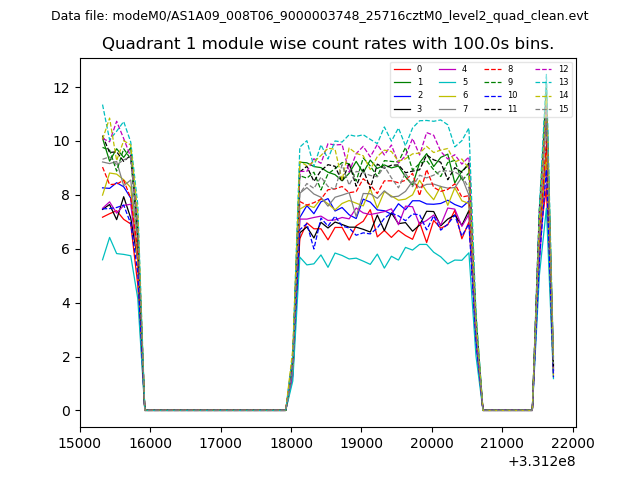
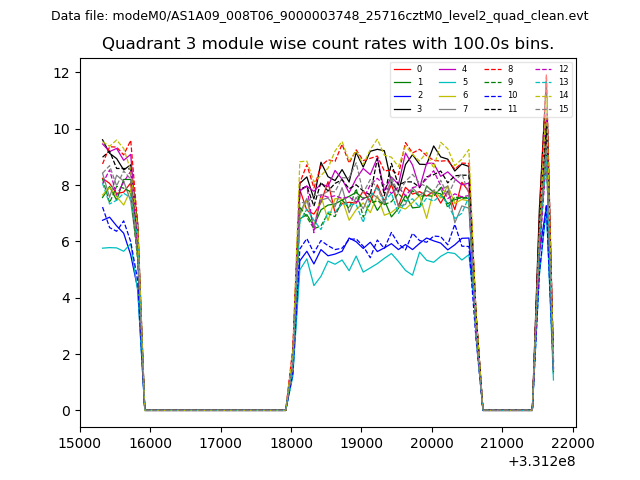
| Module-wise count rates for Quadrant A Data is divided into 100 sec bins |
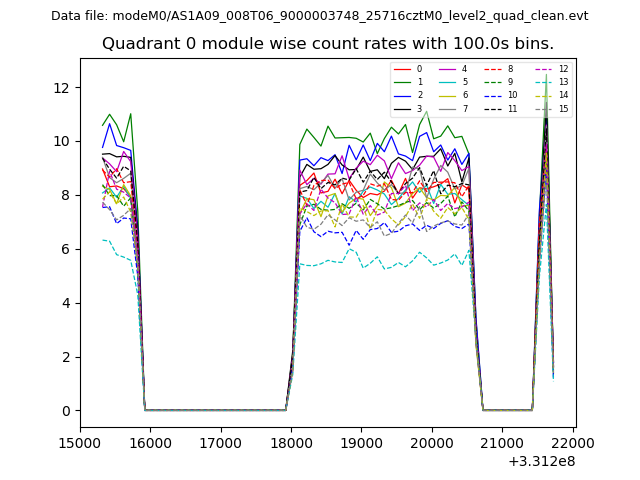 |
 |
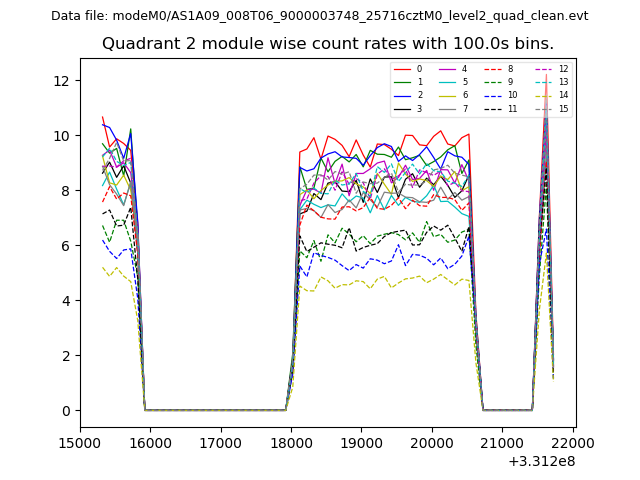
| Module-wise count rates for Quadrant B Data is divided into 100 sec bins |
 |
 |
| Module-wise count rates for Quadrant C Data is divided into 100 sec bins |
 |
 |
| Module-wise count rates for Quadrant D Data is divided into 100 sec bins |
 |
 |
| Parameter | Plot |
|---|---|
| CZT HV Monitor | 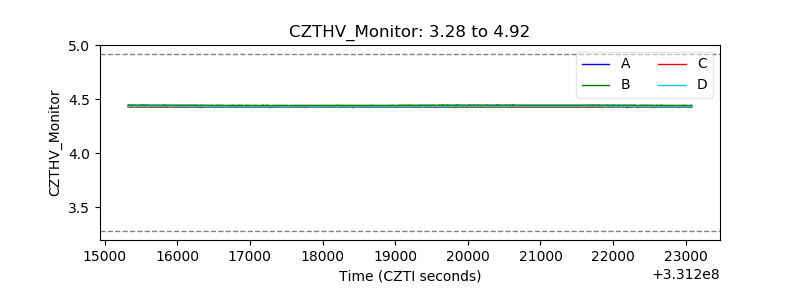 |
| D_VDD | 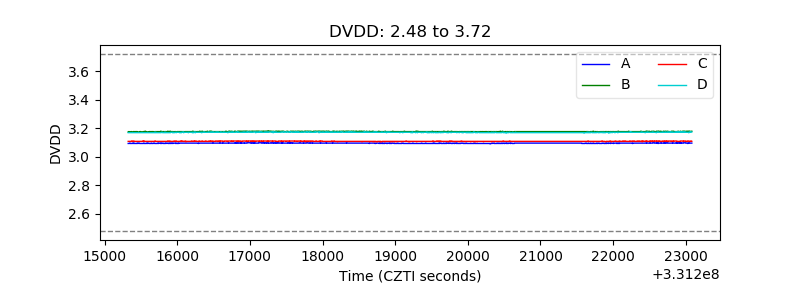 |
| Temperature 1 | 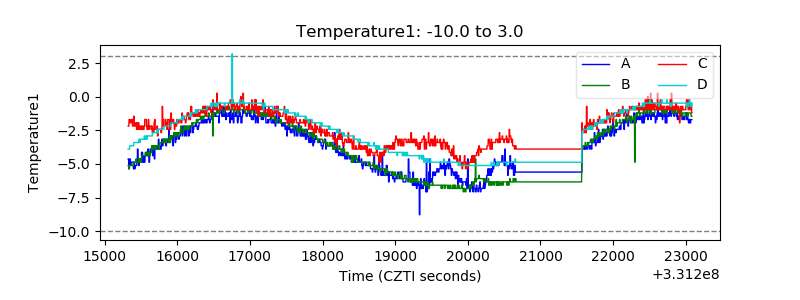 |
| Veto HV Monitor |  |
| Veto LLD | 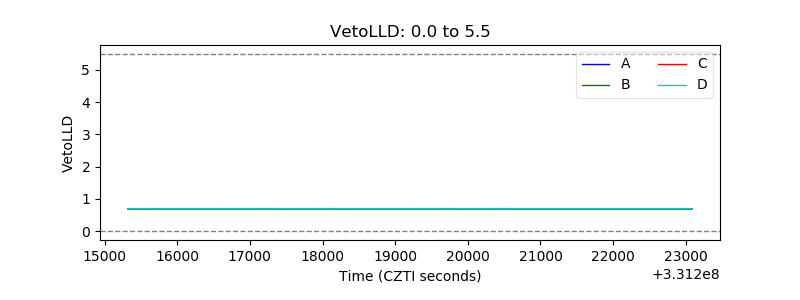 |
| Alpha Counter | 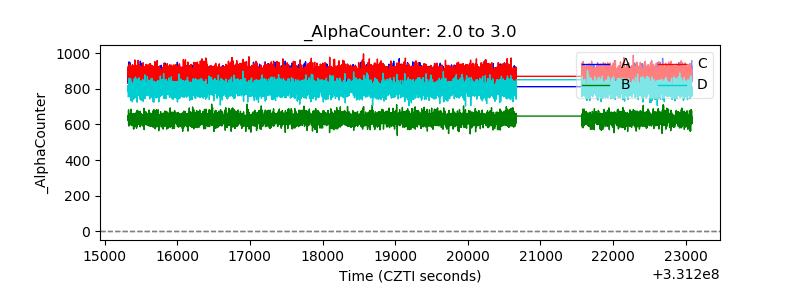 |
| _CPM_Rate | 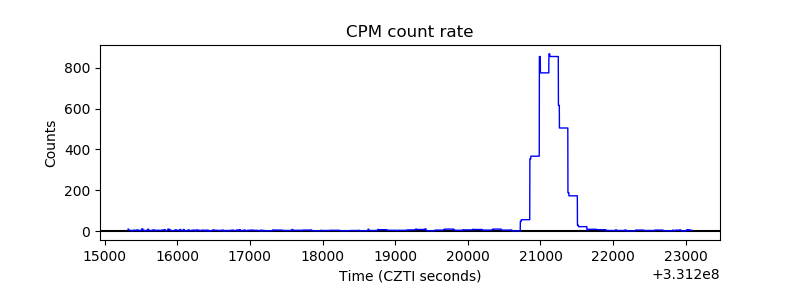 |
| CZT Counter | 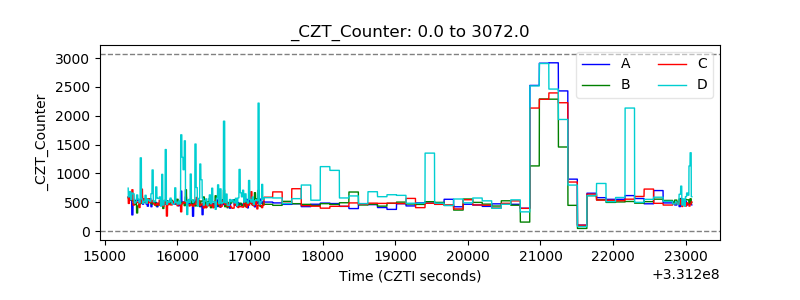 |
| +2.5 Volts monitor | 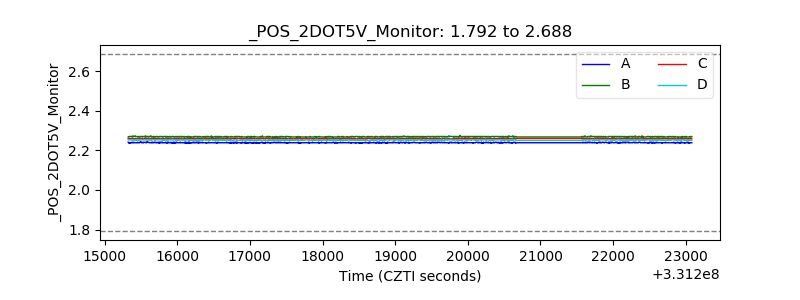 |
| +5 Volts monitor |  |
| _ROLL_ROT | 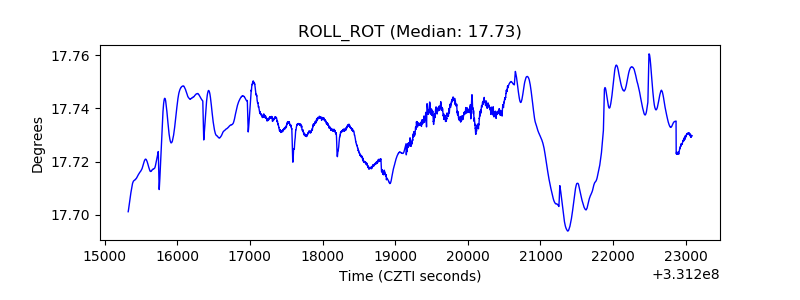 |
| _Roll_DEC | 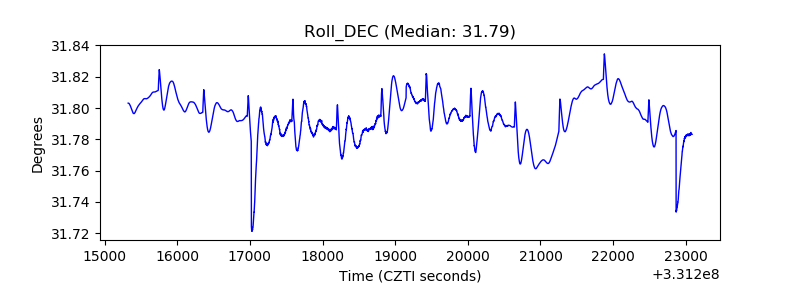 |
| _Roll_RA | 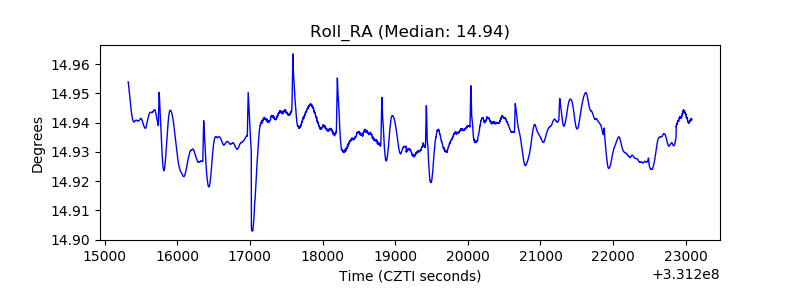 |
| Veto Counter | 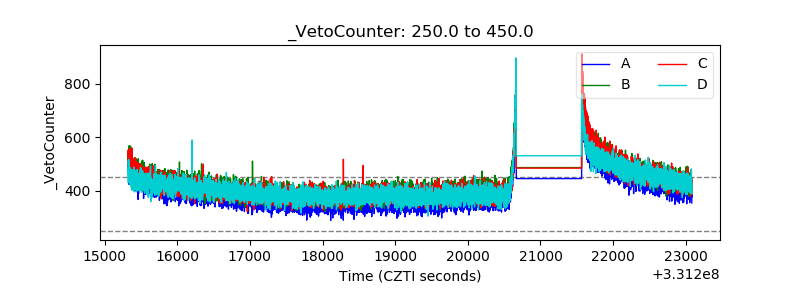 |