| Param | Original file | Final file |
|---|---|---|
| Filename | modeM0/AS1A09_008T06_9000003748_25717cztM0_level2.evt | modeM0/AS1A09_008T06_9000003748_25717cztM0_level2_quad_clean.evt |
| Size (bytes) | 515,433,600 | 67,037,760 |
| Size | 491.6 MB | 63.9 MB |
| Events in quadrant A | 3,396,943 | 399,931 |
| Events in quadrant B | 3,587,679 | 405,063 |
| Events in quadrant C | 3,456,350 | 384,375 |
| Events in quadrant D | 4,716,634 | 375,313 |
| Mode M0 | |||
|---|---|---|---|
| Quadrant | BADHDUFLAG | Total packets | Discarded packets |
| A | 0 | 14361 | 0 |
| B | 0 | 14878 | 0 |
| C | 0 | 14422 | 0 |
| D | 0 | 18396 | 0 |
| Mode M9 | |||
|---|---|---|---|
| Quadrant | BADHDUFLAG | Total packets | Discarded packets |
| A | 0 | 10 | 0 |
| B | 0 | 11 | 0 |
| C | 0 | 11 | 0 |
| D | 0 | 11 | 0 |
| Quadrant | Total seconds | Saturated seconds | Saturation percentage |
|---|---|---|---|
| A | 6661 | 58 | 0.870740% |
| B | 6661 | 98 | 1.471251% |
| C | 6660 | 108 | 1.621622% |
| D | 6660 | 279 | 4.189189% |
Noise dominated data is calculated using 1-second bins in cleaned event files. If a bin has >2000 counts, and if more than 50% of those come from <1% of pixels, then it is considered to be noise-dominated and hence unusable.
| Quadrant | # 1 sec bins | Bins with >0 counts | Bins with >2000 counts | High rate bins dominated by noise | Noise dominated (total time) | Noise dominated (detector-on time) | Marked lightcurve |
|---|---|---|---|---|---|---|---|
| A | 7721 | 6661 | 0 | 0 | 0.00% | 0.00% | 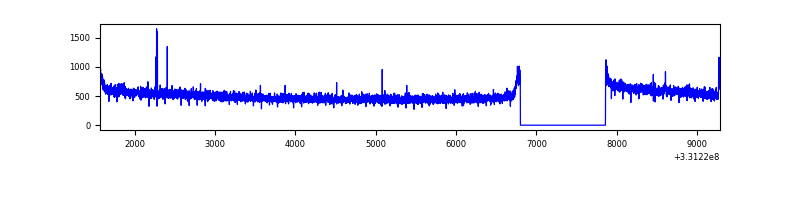 |
| B | 7721 | 6661 | 22 | 22 | 0.28% | 0.33% | 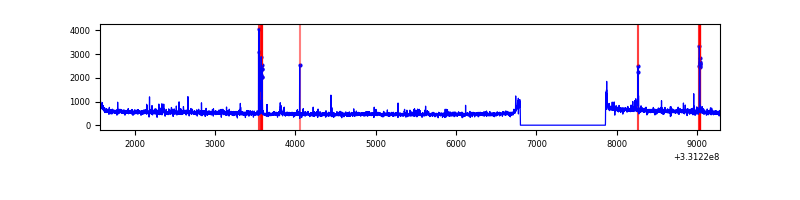 |
| C | 7720 | 6660 | 0 | 0 | 0.00% | 0.00% | 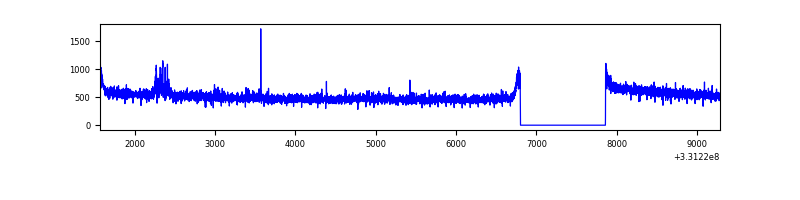 |
| D | 7720 | 6660 | 198 | 198 | 2.56% | 2.97% | 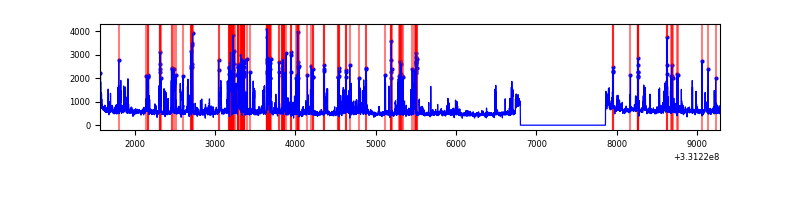 |
Top three noisy pixels from each quadrant. If the there are fewer than three noisy pixels in the level2.evt file, extra rows are filled as -1
| Pixel properties | Quadrant properties | ||||||
|---|---|---|---|---|---|---|---|
| Quadrant | DetID | PixID | Counts | Sigma | Mean | Median | Sigma |
| A | 0 | 13 | 19799 | 107.96 | 875 | 857 | 175.4 |
| A | 13 | 254 | 10942 | 57.48 | 875 | 857 | 175.4 |
| A | 3 | 137 | 7657 | 38.76 | 875 | 857 | 175.4 |
| B | 5 | 172 | 76692 | 464.67 | 865 | 845 | 163.2 |
| B | 0 | 190 | 37519 | 224.68 | 865 | 845 | 163.2 |
| B | 0 | 219 | 32288 | 192.63 | 865 | 845 | 163.2 |
| C | 14 | 238 | 133079 | 674.99 | 833 | 838 | 195.9 |
| C | 3 | 233 | 69628 | 351.12 | 833 | 838 | 195.9 |
| C | 13 | 61 | 5767 | 25.16 | 833 | 838 | 195.9 |
| D | 1 | 52 | 1029449 | 5044.01 | 841 | 819 | 203.9 |
| D | 8 | 195 | 205004 | 1001.24 | 841 | 819 | 203.9 |
| D | 2 | 244 | 82828 | 402.14 | 841 | 819 | 203.9 |
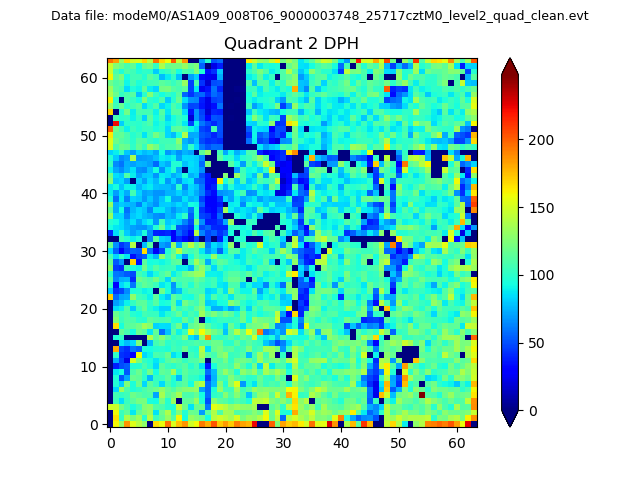
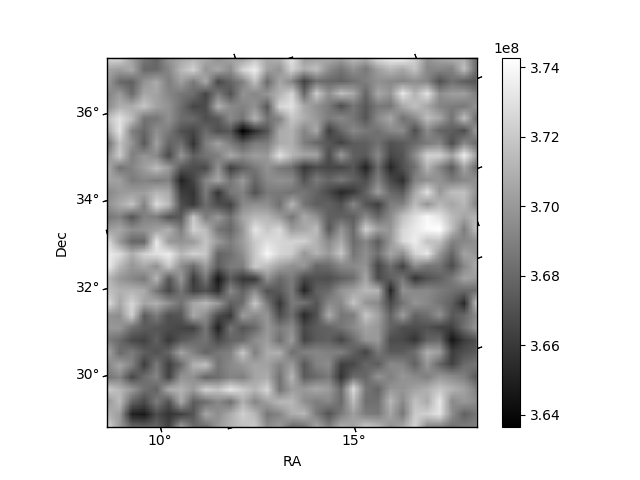
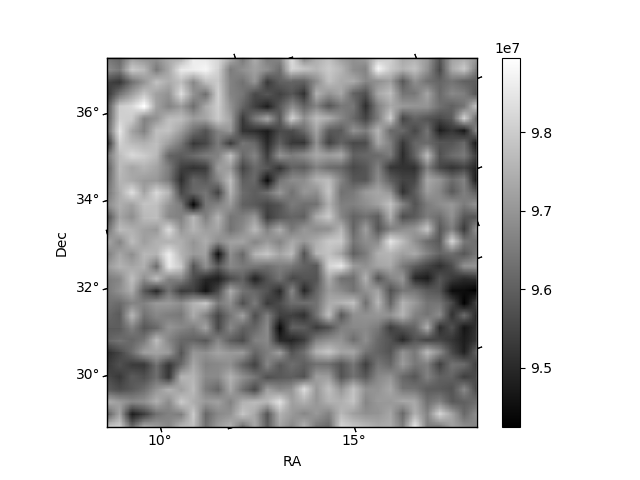
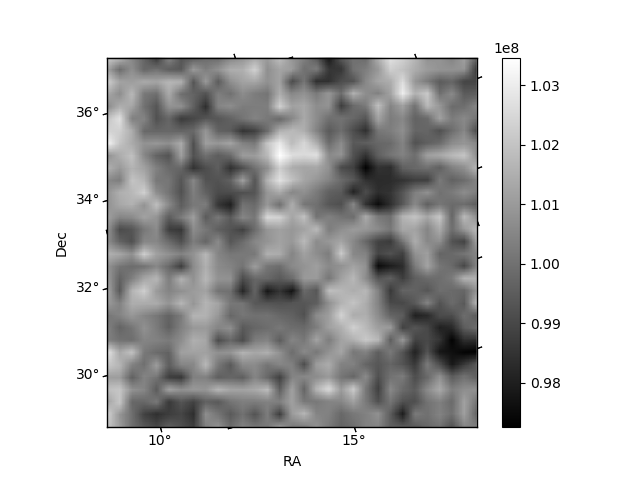
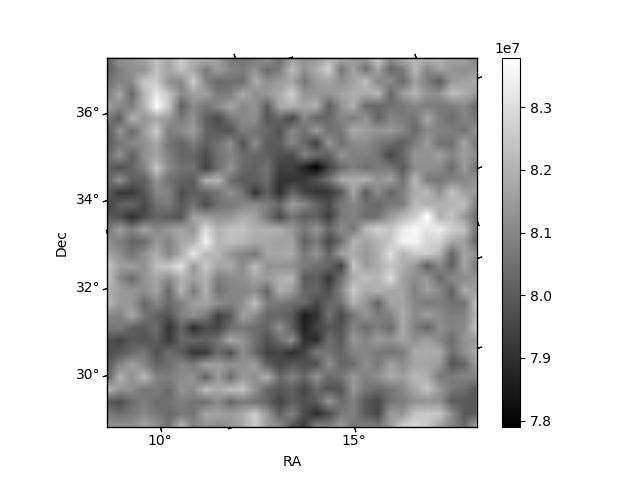
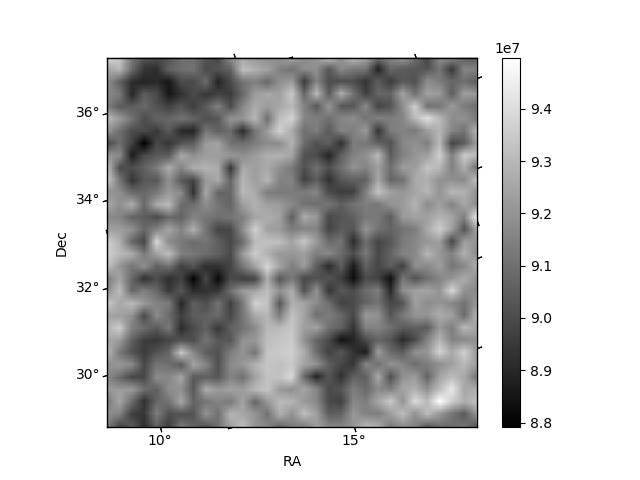
Histogram calculated using DETX and DETY for each event in the final _common_clean file
| Quadrant A | 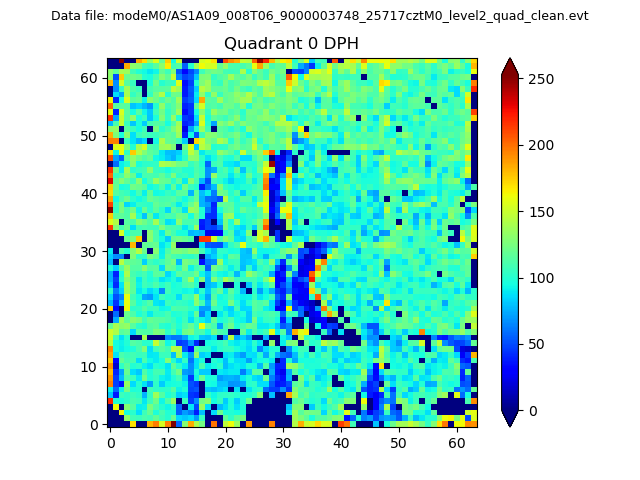 |
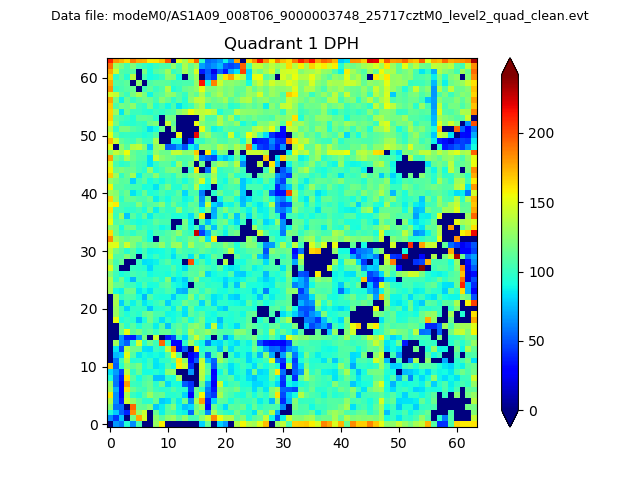 |
Quadrant B |
|---|---|---|---|
| Quadrant D | 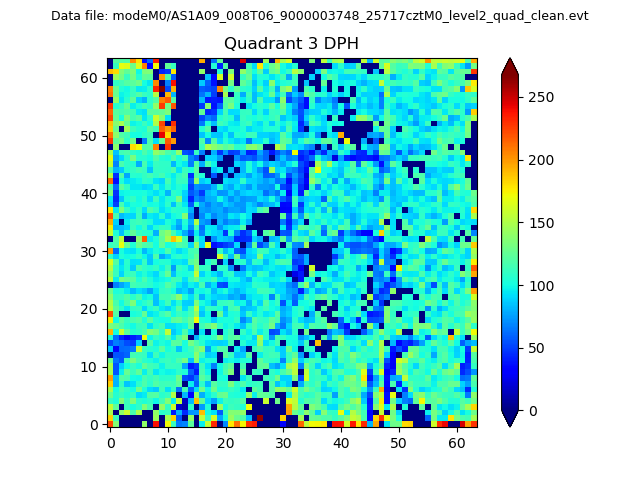 |
 |
Quadrant C |
| Plot type | Count rate plots | Images |
|---|---|---|
| Comparison with Poisson distribution Blue bars denote a histogram of data divided into 1 sec bins. Red curve is a Poisson curve with rate = median count rate of data. |
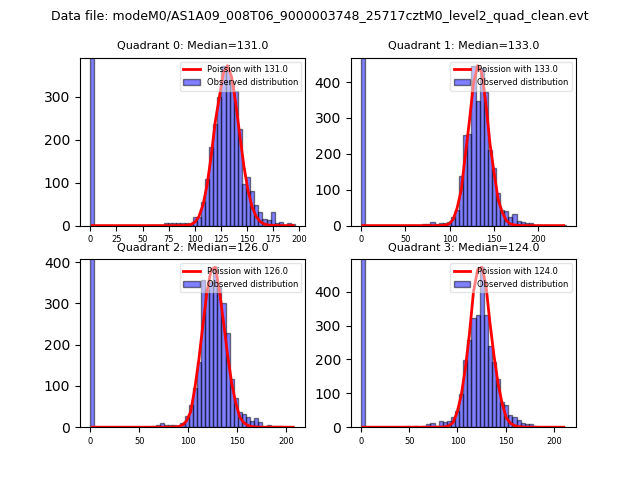 |
 |
| Quadrant-wise count rates Data is divided into 100 sec bins |
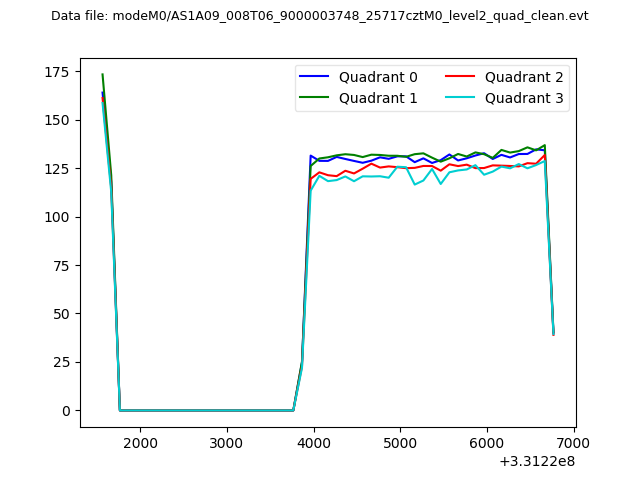 |
|
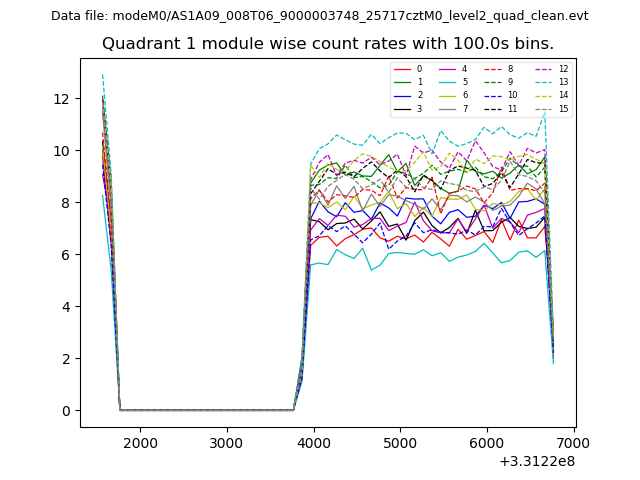
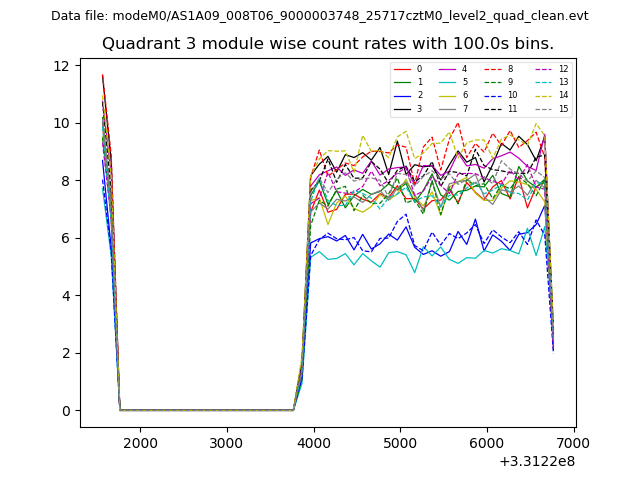
| Module-wise count rates for Quadrant A Data is divided into 100 sec bins |
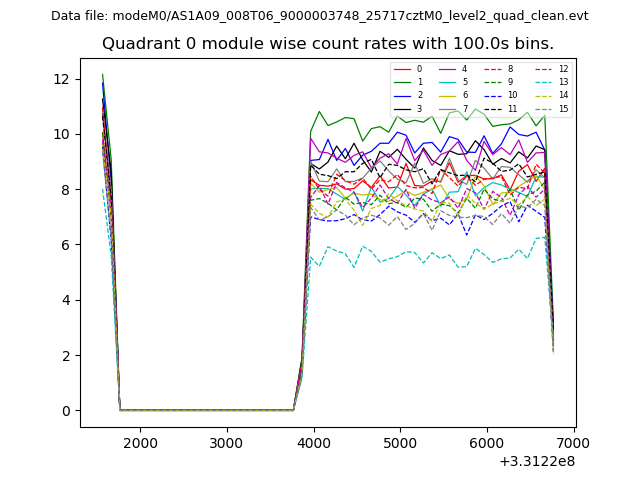 |
 |
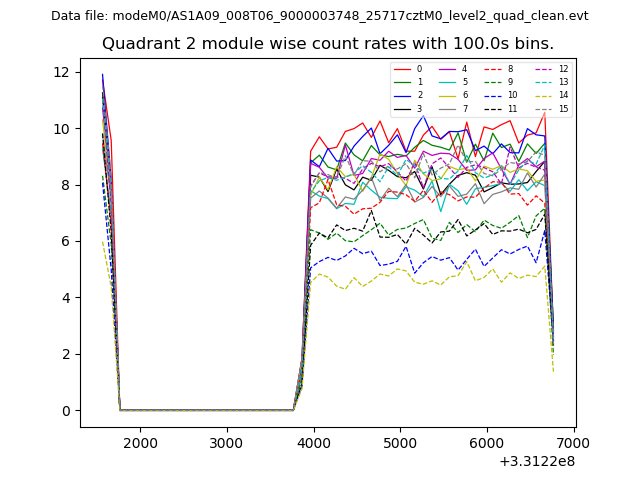
| Module-wise count rates for Quadrant B Data is divided into 100 sec bins |
 |
 |
| Module-wise count rates for Quadrant C Data is divided into 100 sec bins |
 |
 |
| Module-wise count rates for Quadrant D Data is divided into 100 sec bins |
 |
 |
| Parameter | Plot |
|---|---|
| CZT HV Monitor | 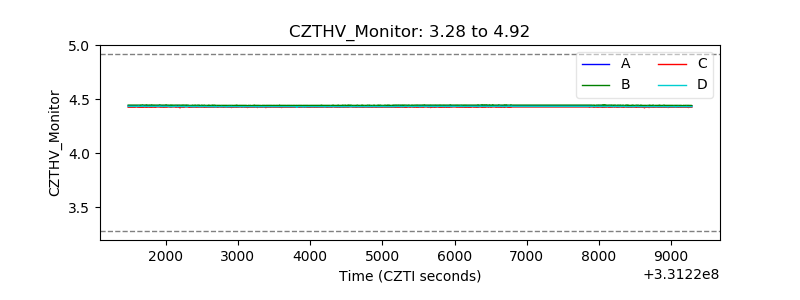 |
| D_VDD | 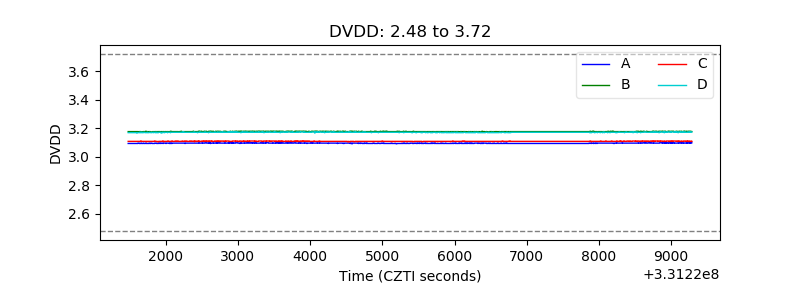 |
| Temperature 1 | 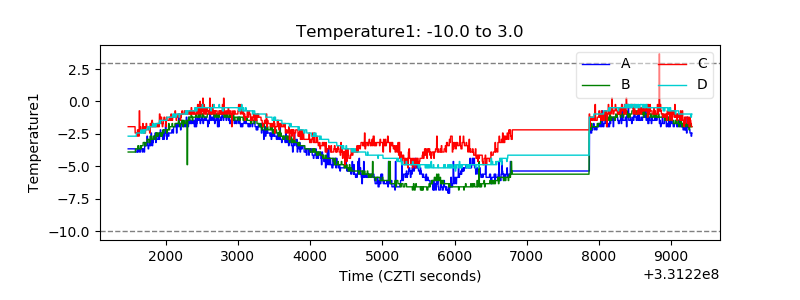 |
| Veto HV Monitor | 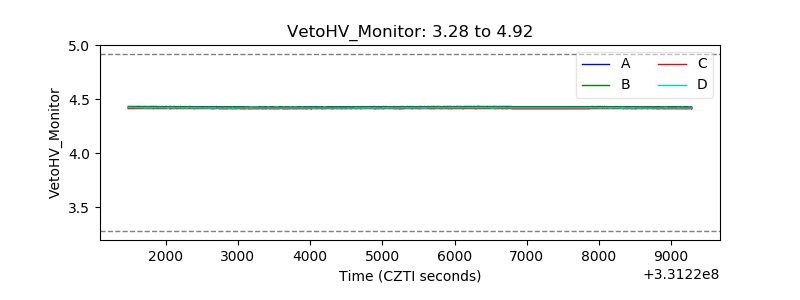 |
| Veto LLD | 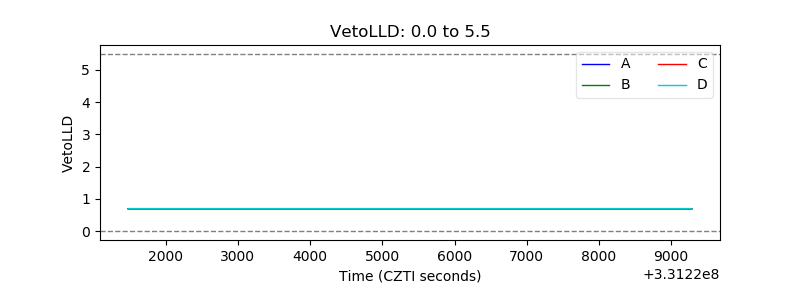 |
| Alpha Counter | 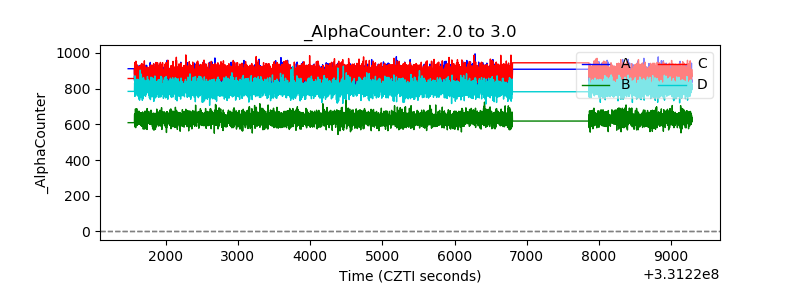 |
| _CPM_Rate | 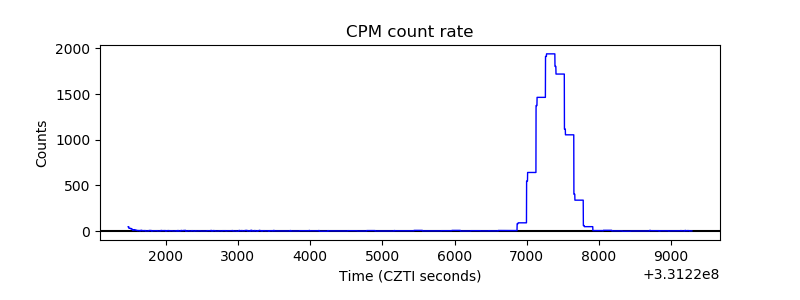 |
| CZT Counter | 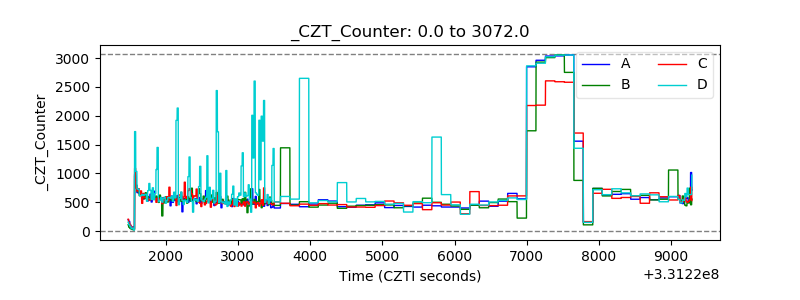 |
| +2.5 Volts monitor |  |
| +5 Volts monitor | 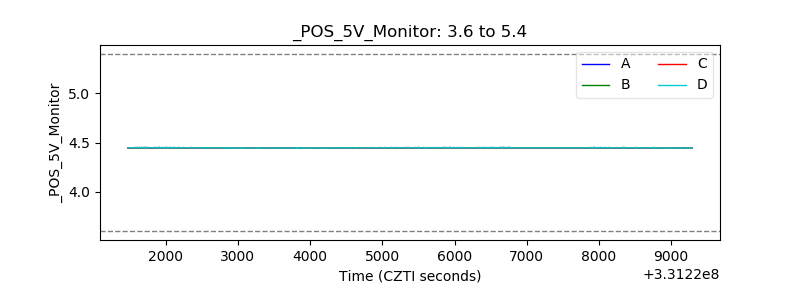 |
| _ROLL_ROT | 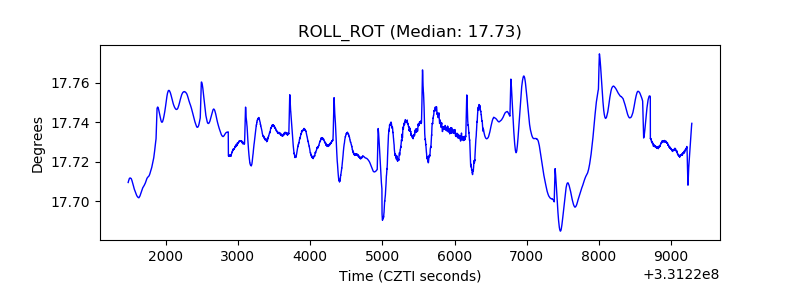 |
| _Roll_DEC | 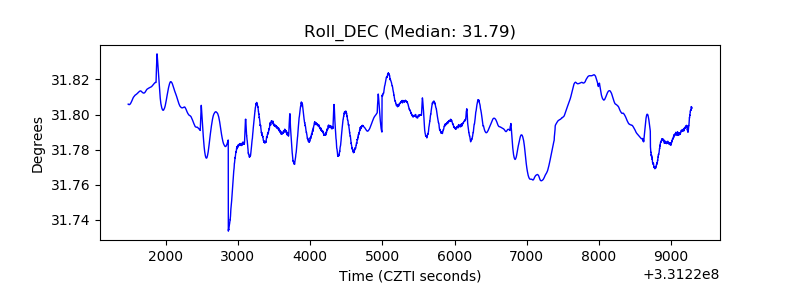 |
| _Roll_RA | 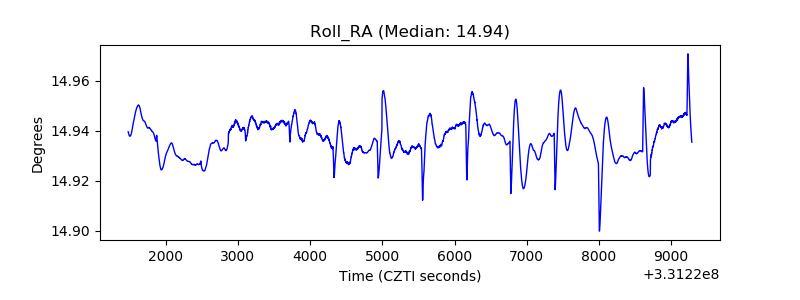 |
| Veto Counter | 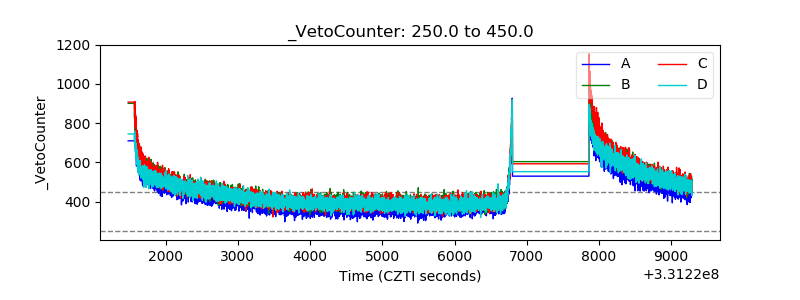 |