| Param | Original file | Final file |
|---|---|---|
| Filename | modeM0/AS1A09_008T06_9000003748_25719cztM0_level2.evt | modeM0/AS1A09_008T06_9000003748_25719cztM0_level2_quad_clean.evt |
| Size (bytes) | 525,752,640 | 70,355,520 |
| Size | 501.4 MB | 67.1 MB |
| Events in quadrant A | 3,448,345 | 430,171 |
| Events in quadrant B | 3,570,906 | 436,579 |
| Events in quadrant C | 3,474,651 | 415,802 |
| Events in quadrant D | 4,995,522 | 401,849 |
| Mode M0 | |||
|---|---|---|---|
| Quadrant | BADHDUFLAG | Total packets | Discarded packets |
| A | 0 | 14569 | 0 |
| B | 0 | 14908 | 0 |
| C | 0 | 14524 | 0 |
| D | 0 | 19570 | 0 |
| Mode M9 | |||
|---|---|---|---|
| Quadrant | BADHDUFLAG | Total packets | Discarded packets |
| A | 0 | 12 | 0 |
| B | 0 | 12 | 0 |
| C | 0 | 12 | 0 |
| D | 0 | 12 | 0 |
| Quadrant | Total seconds | Saturated seconds | Saturation percentage |
|---|---|---|---|
| A | 6389 | 71 | 1.111285% |
| B | 6388 | 94 | 1.471509% |
| C | 6388 | 117 | 1.831559% |
| D | 6389 | 206 | 3.224292% |
Noise dominated data is calculated using 1-second bins in cleaned event files. If a bin has >2000 counts, and if more than 50% of those come from <1% of pixels, then it is considered to be noise-dominated and hence unusable.
| Quadrant | # 1 sec bins | Bins with >0 counts | Bins with >2000 counts | High rate bins dominated by noise | Noise dominated (total time) | Noise dominated (detector-on time) | Marked lightcurve |
|---|---|---|---|---|---|---|---|
| A | 7589 | 6389 | 0 | 0 | 0.00% | 0.00% | 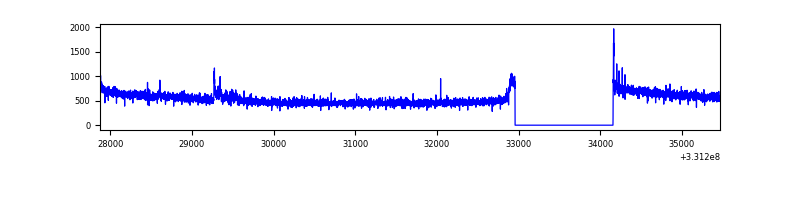 |
| B | 7588 | 6388 | 13 | 13 | 0.17% | 0.20% | 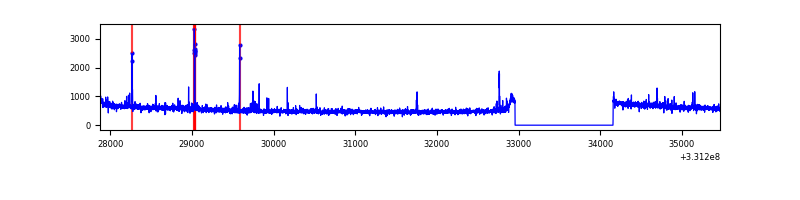 |
| C | 7588 | 6388 | 0 | 0 | 0.00% | 0.00% | 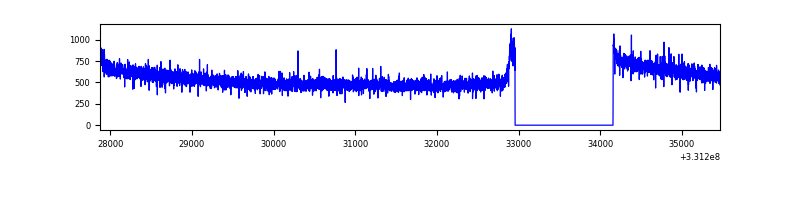 |
| D | 7589 | 6389 | 110 | 110 | 1.45% | 1.72% | 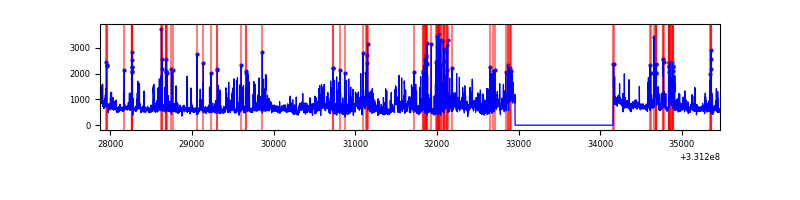 |
Top three noisy pixels from each quadrant. If the there are fewer than three noisy pixels in the level2.evt file, extra rows are filled as -1
| Pixel properties | Quadrant properties | ||||||
|---|---|---|---|---|---|---|---|
| Quadrant | DetID | PixID | Counts | Sigma | Mean | Median | Sigma |
| A | 0 | 13 | 49932 | 279.27 | 882 | 866 | 175.7 |
| A | 13 | 254 | 10247 | 53.39 | 882 | 866 | 175.7 |
| A | 0 | 226 | 7504 | 37.78 | 882 | 866 | 175.7 |
| B | 5 | 172 | 52702 | 318.26 | 876 | 857 | 162.9 |
| B | 0 | 190 | 28507 | 169.73 | 876 | 857 | 162.9 |
| B | 0 | 219 | 26364 | 156.58 | 876 | 857 | 162.9 |
| C | 14 | 238 | 136058 | 689.16 | 848 | 856 | 196.2 |
| C | 3 | 233 | 25693 | 126.6 | 848 | 856 | 196.2 |
| C | 1 | 16 | 6792 | 30.26 | 848 | 856 | 196.2 |
| D | 1 | 52 | 992010 | 4775.18 | 856 | 832 | 207.6 |
| D | 2 | 244 | 418225 | 2010.87 | 856 | 832 | 207.6 |
| D | 8 | 195 | 204588 | 981.63 | 856 | 832 | 207.6 |
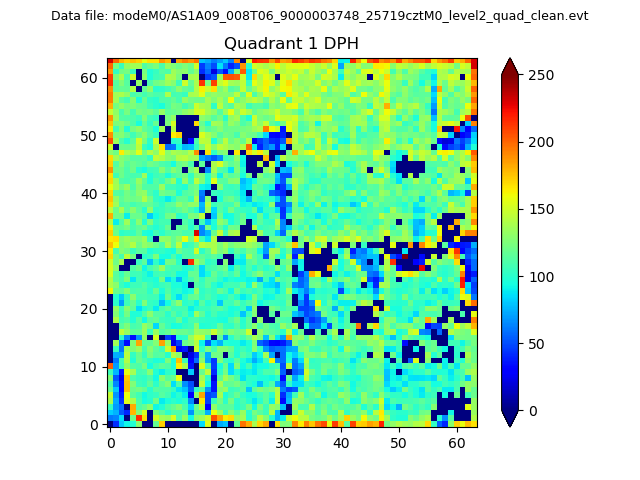
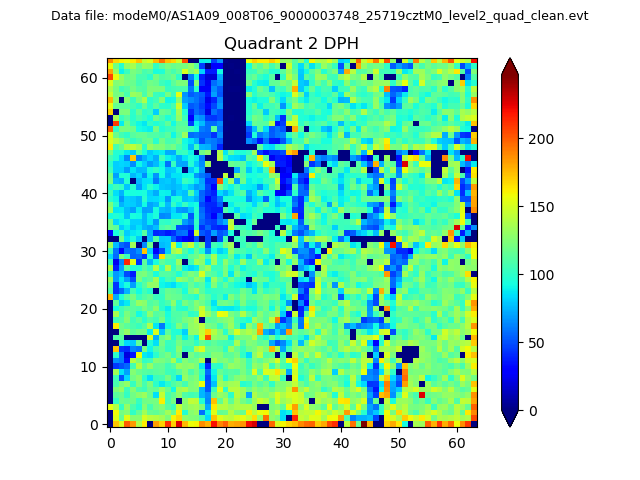
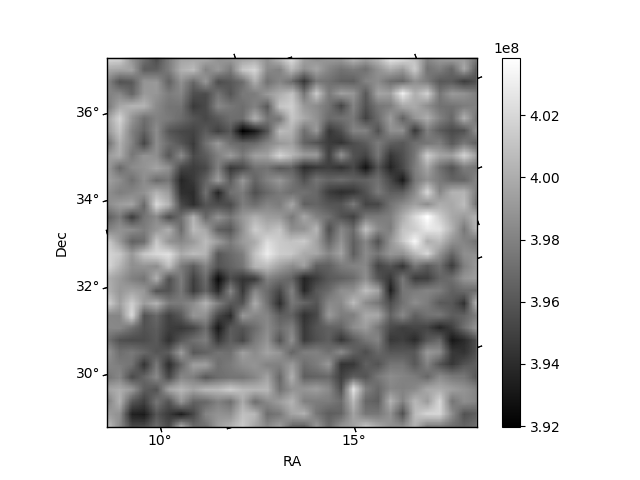
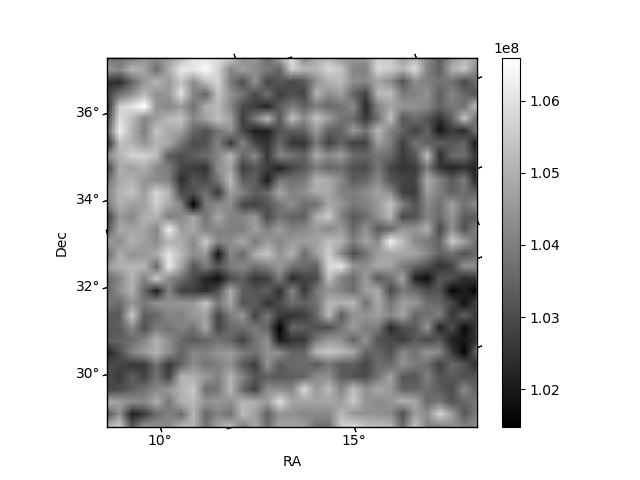
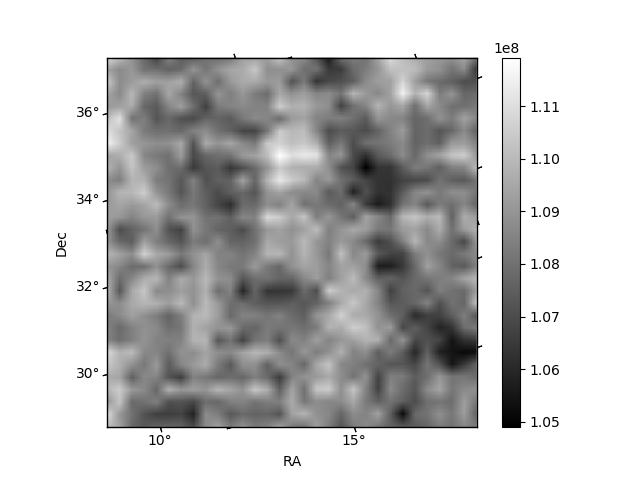
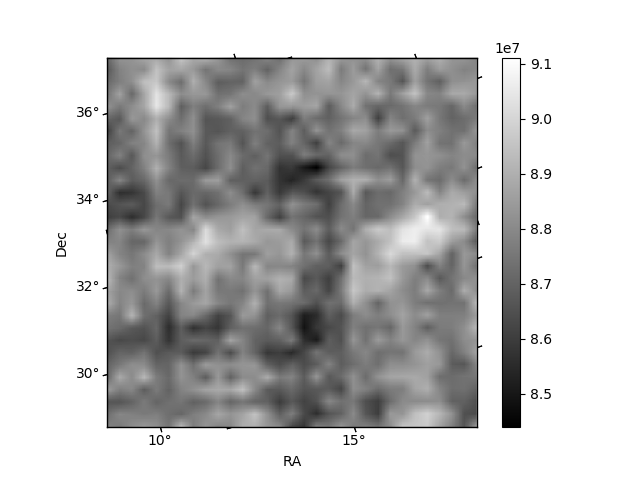
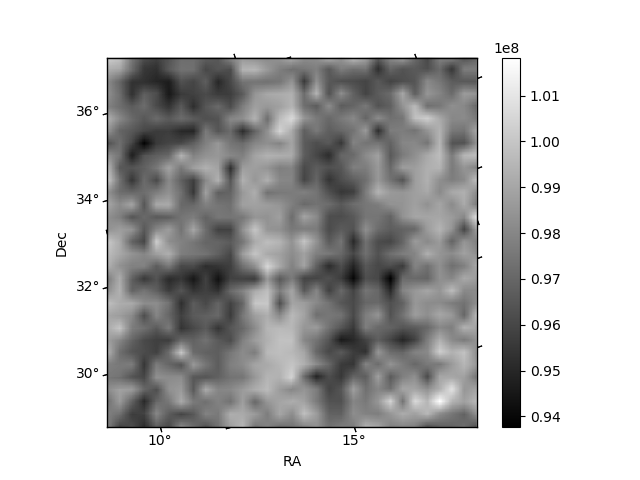
Histogram calculated using DETX and DETY for each event in the final _common_clean file
| Quadrant A |  |
 |
Quadrant B |
|---|---|---|---|
| Quadrant D | 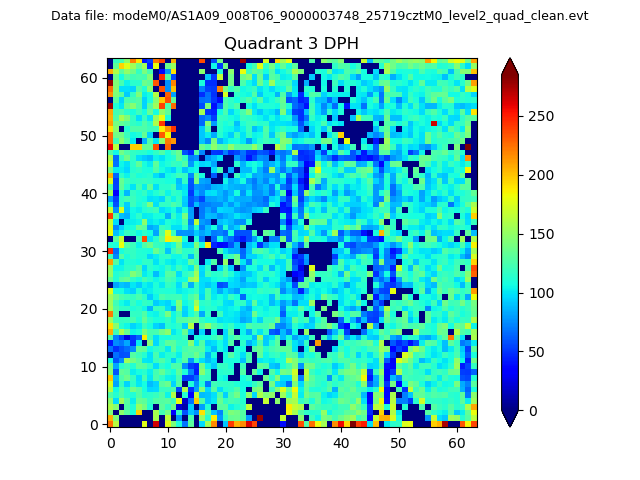 |
 |
Quadrant C |
| Plot type | Count rate plots | Images |
|---|---|---|
| Comparison with Poisson distribution Blue bars denote a histogram of data divided into 1 sec bins. Red curve is a Poisson curve with rate = median count rate of data. |
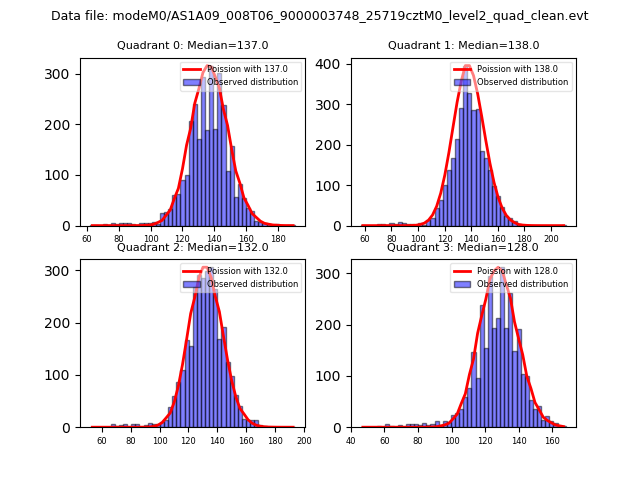 |
 |
| Quadrant-wise count rates Data is divided into 100 sec bins |
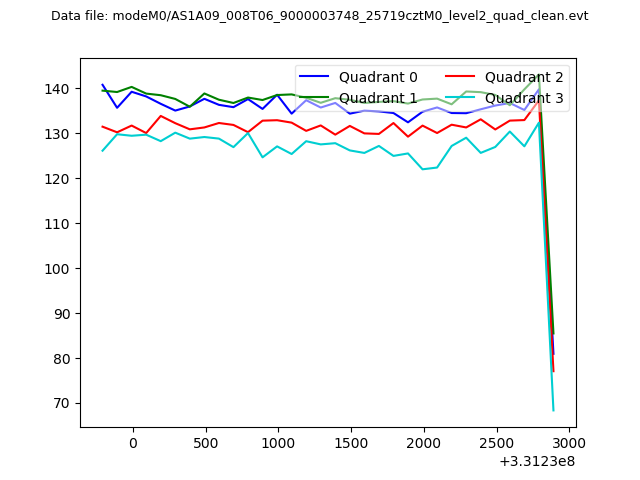 |
|
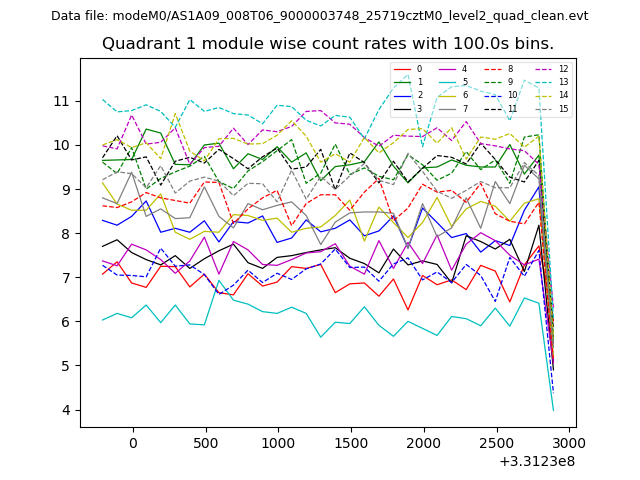
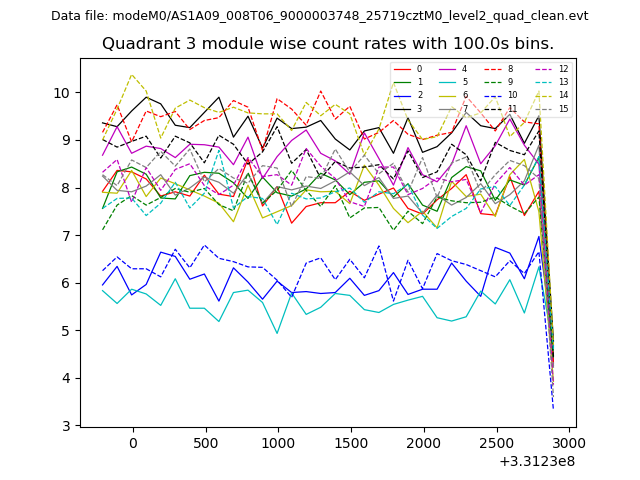
| Module-wise count rates for Quadrant A Data is divided into 100 sec bins |
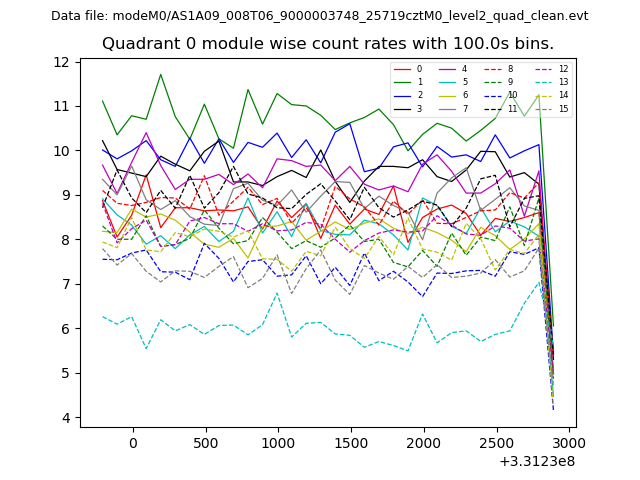 |
 |
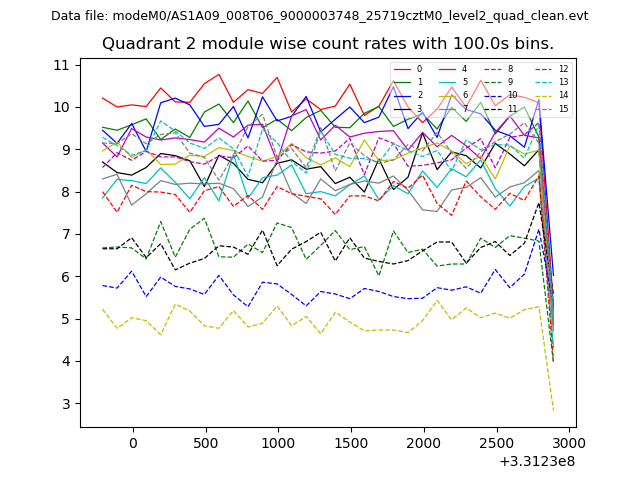
| Module-wise count rates for Quadrant B Data is divided into 100 sec bins |
 |
 |
| Module-wise count rates for Quadrant C Data is divided into 100 sec bins |
 |
 |
| Module-wise count rates for Quadrant D Data is divided into 100 sec bins |
 |
 |
| Parameter | Plot |
|---|---|
| CZT HV Monitor | 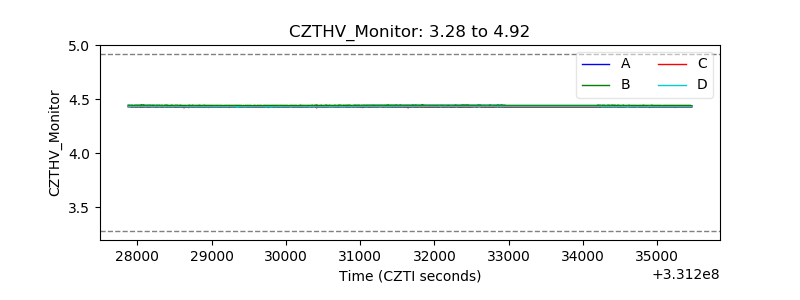 |
| D_VDD | 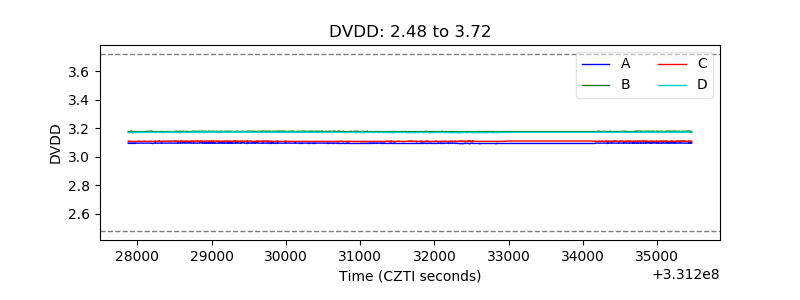 |
| Temperature 1 | 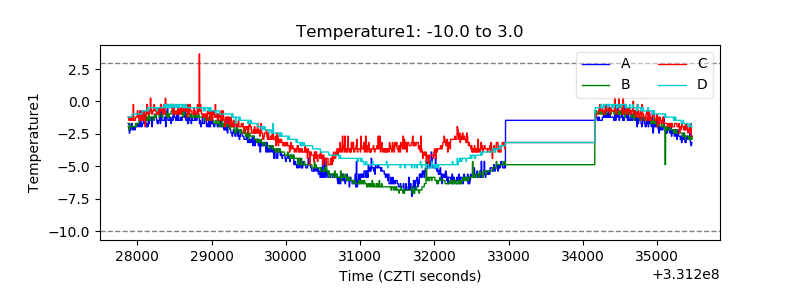 |
| Veto HV Monitor | 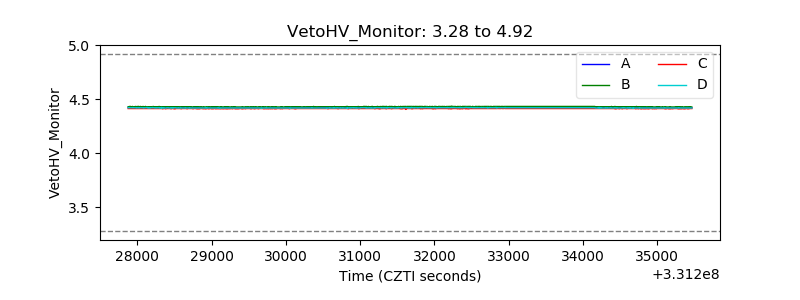 |
| Veto LLD | 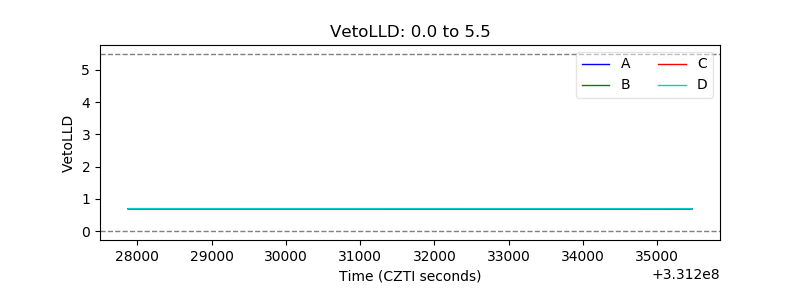 |
| Alpha Counter | 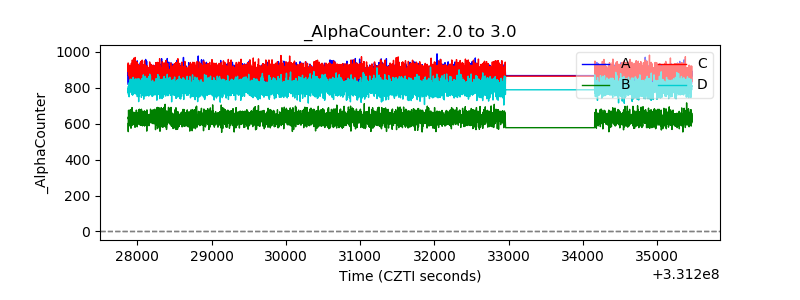 |
| _CPM_Rate |  |
| CZT Counter | 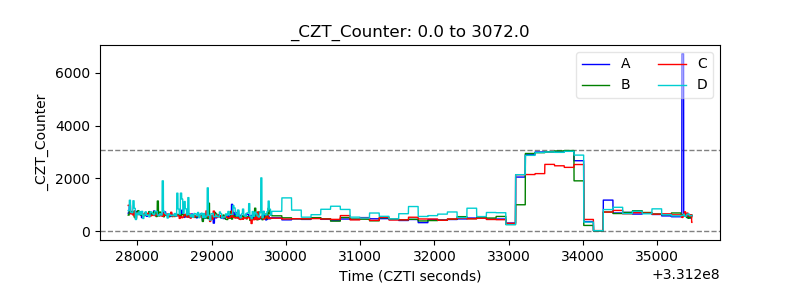 |
| +2.5 Volts monitor | 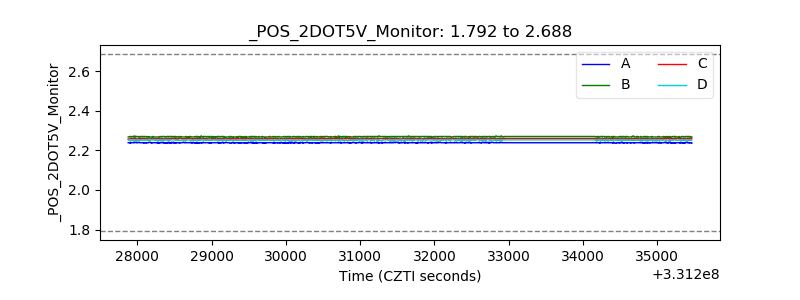 |
| +5 Volts monitor | 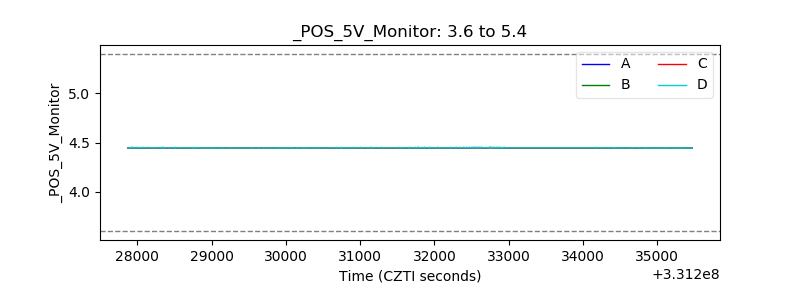 |
| _ROLL_ROT | 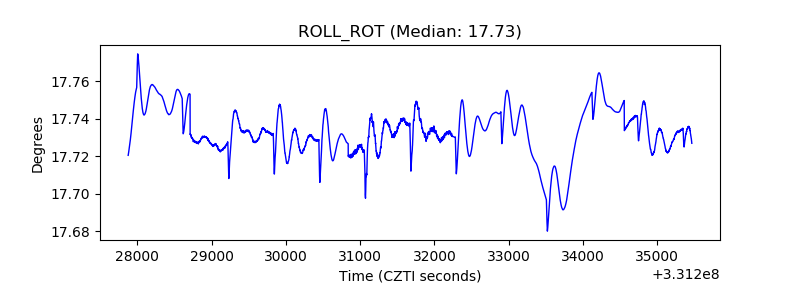 |
| _Roll_DEC |  |
| _Roll_RA | 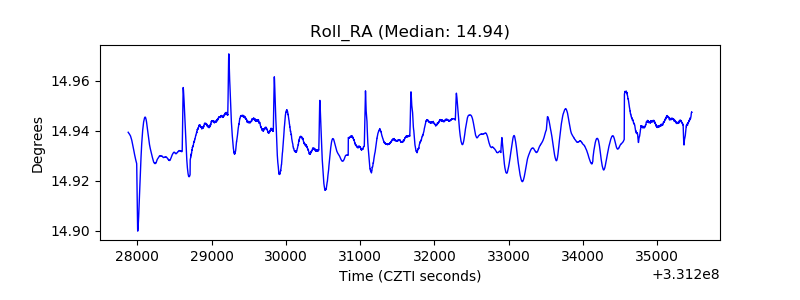 |
| Veto Counter | 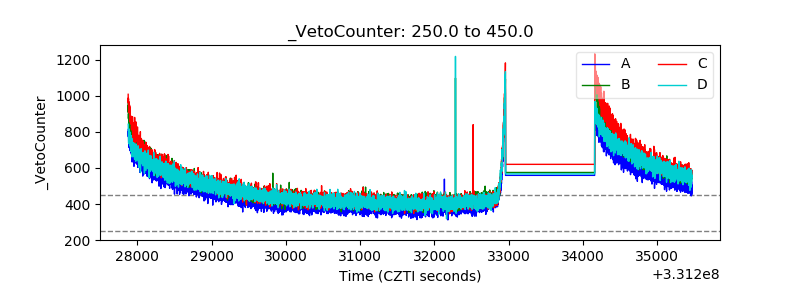 |