| Param | Original file | Final file |
|---|---|---|
| Filename | modeM0/AS1A09_008T06_9000003748_25720cztM0_level2.evt | modeM0/AS1A09_008T06_9000003748_25720cztM0_level2_quad_clean.evt |
| Size (bytes) | 472,343,040 | 82,123,200 |
| Size | 450.5 MB | 78.3 MB |
| Events in quadrant A | 3,240,888 | 524,415 |
| Events in quadrant B | 3,325,618 | 535,277 |
| Events in quadrant C | 3,342,974 | 513,753 |
| Events in quadrant D | 3,996,573 | 502,665 |
| Mode M0 | |||
|---|---|---|---|
| Quadrant | BADHDUFLAG | Total packets | Discarded packets |
| A | 0 | 13560 | 0 |
| B | 0 | 13797 | 0 |
| C | 0 | 13859 | 0 |
| D | 0 | 15874 | 0 |
| Mode M9 | |||
|---|---|---|---|
| Quadrant | BADHDUFLAG | Total packets | Discarded packets |
| A | 0 | 13 | 0 |
| B | 0 | 13 | 0 |
| C | 0 | 13 | 0 |
| D | 0 | 13 | 0 |
| Quadrant | Total seconds | Saturated seconds | Saturation percentage |
|---|---|---|---|
| A | 5877 | 59 | 1.003914% |
| B | 5878 | 75 | 1.275944% |
| C | 5878 | 118 | 2.007486% |
| D | 5878 | 164 | 2.790065% |
Noise dominated data is calculated using 1-second bins in cleaned event files. If a bin has >2000 counts, and if more than 50% of those come from <1% of pixels, then it is considered to be noise-dominated and hence unusable.
| Quadrant | # 1 sec bins | Bins with >0 counts | Bins with >2000 counts | High rate bins dominated by noise | Noise dominated (total time) | Noise dominated (detector-on time) | Marked lightcurve |
|---|---|---|---|---|---|---|---|
| A | 7187 | 5877 | 1 | 1 | 0.01% | 0.02% | 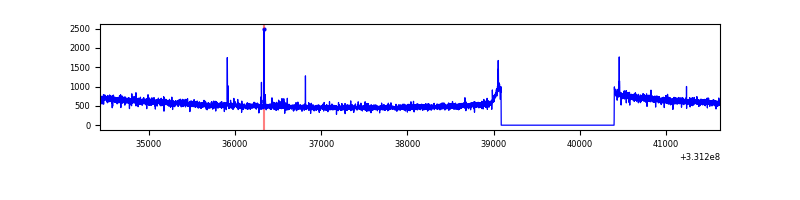 |
| B | 7188 | 5878 | 4 | 4 | 0.06% | 0.07% | 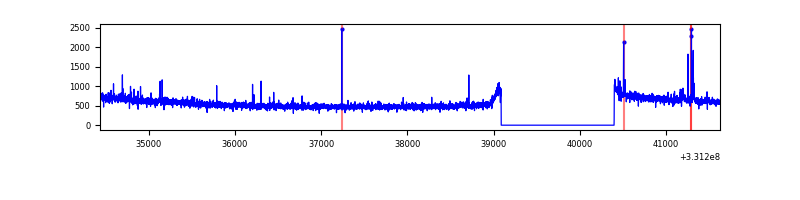 |
| C | 7188 | 5878 | 0 | 0 | 0.00% | 0.00% | 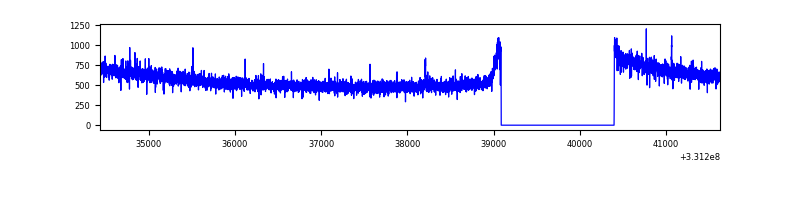 |
| D | 7188 | 5878 | 102 | 102 | 1.42% | 1.74% | 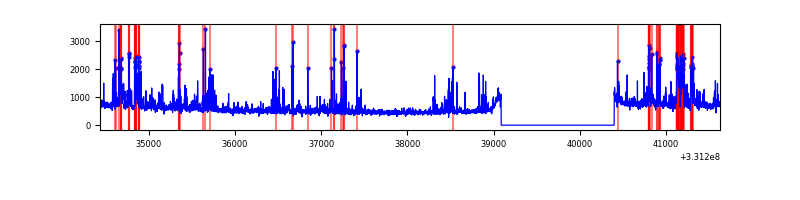 |
Top three noisy pixels from each quadrant. If the there are fewer than three noisy pixels in the level2.evt file, extra rows are filled as -1
| Pixel properties | Quadrant properties | ||||||
|---|---|---|---|---|---|---|---|
| Quadrant | DetID | PixID | Counts | Sigma | Mean | Median | Sigma |
| A | 0 | 13 | 39664 | 236.21 | 830 | 819 | 164.4 |
| A | 13 | 254 | 9997 | 55.81 | 830 | 819 | 164.4 |
| A | 0 | 226 | 7329 | 39.59 | 830 | 819 | 164.4 |
| B | 5 | 172 | 28987 | 183.34 | 830 | 813 | 153.7 |
| B | 0 | 190 | 23014 | 144.47 | 830 | 813 | 153.7 |
| B | 12 | 111 | 17074 | 105.82 | 830 | 813 | 153.7 |
| C | 14 | 238 | 130439 | 693.71 | 810 | 819 | 186.8 |
| C | 3 | 233 | 39585 | 207.47 | 810 | 819 | 186.8 |
| C | 1 | 16 | 9485 | 46.38 | 810 | 819 | 186.8 |
| D | 1 | 52 | 591760 | 3008.45 | 816 | 796 | 196.4 |
| D | 2 | 244 | 107227 | 541.81 | 816 | 796 | 196.4 |
| D | 8 | 195 | 91890 | 463.74 | 816 | 796 | 196.4 |
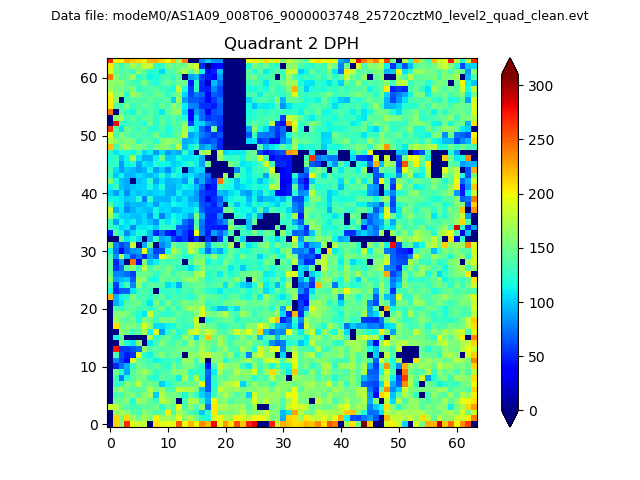
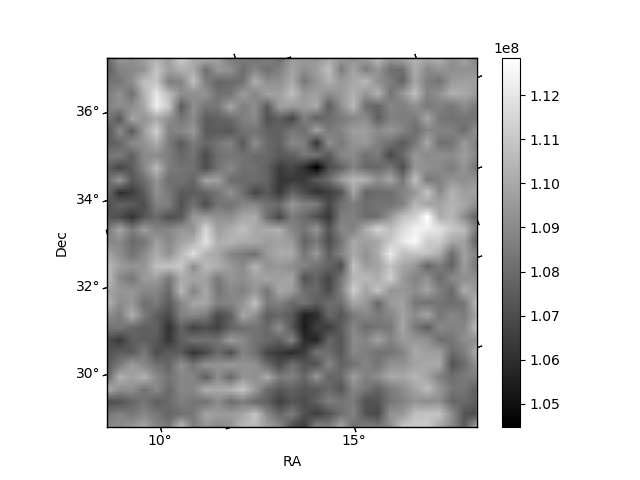
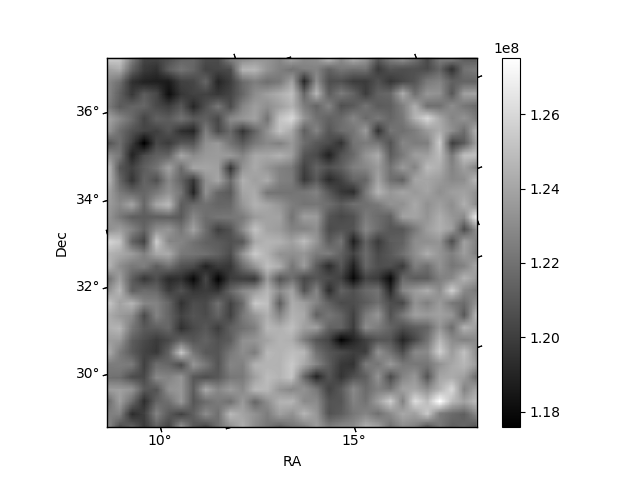
Histogram calculated using DETX and DETY for each event in the final _common_clean file
| Quadrant A | 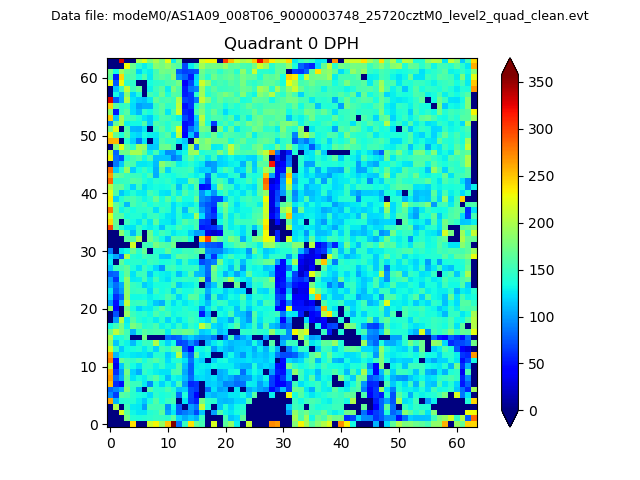 |
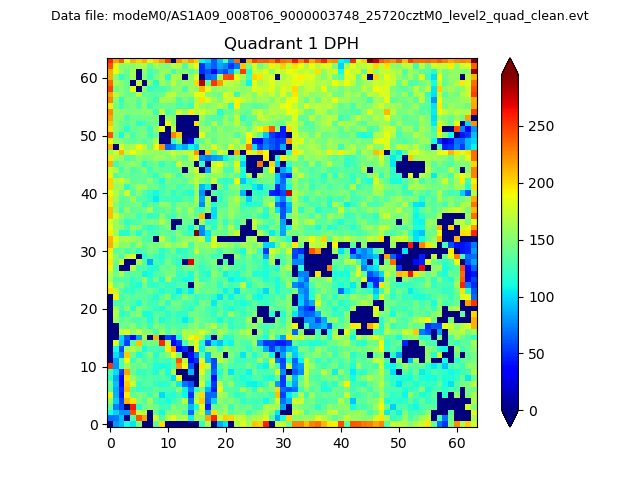 |
Quadrant B |
|---|---|---|---|
| Quadrant D | 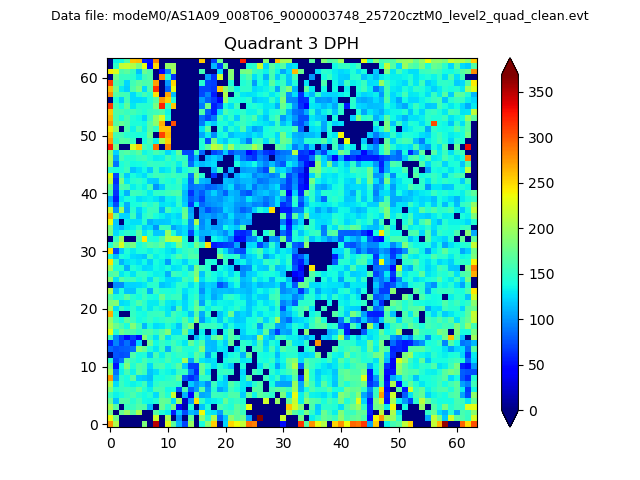 |
 |
Quadrant C |
| Plot type | Count rate plots | Images |
|---|---|---|
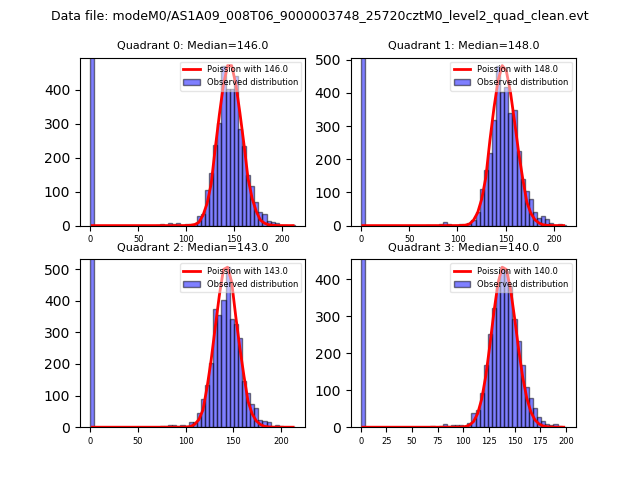
| Comparison with Poisson distribution Blue bars denote a histogram of data divided into 1 sec bins. Red curve is a Poisson curve with rate = median count rate of data. |
 |
 |
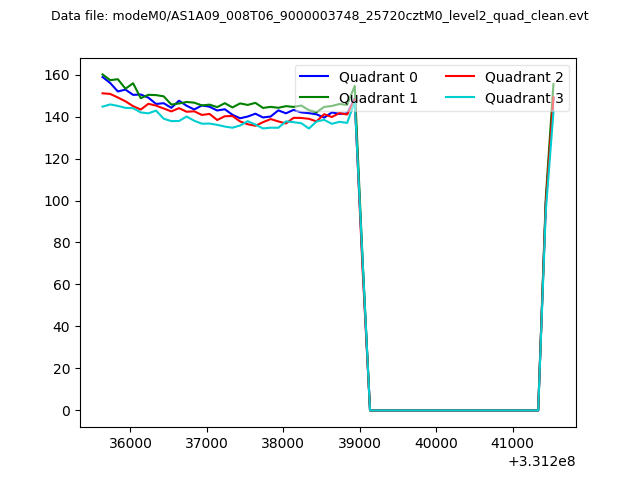
| Quadrant-wise count rates Data is divided into 100 sec bins |
 |
|
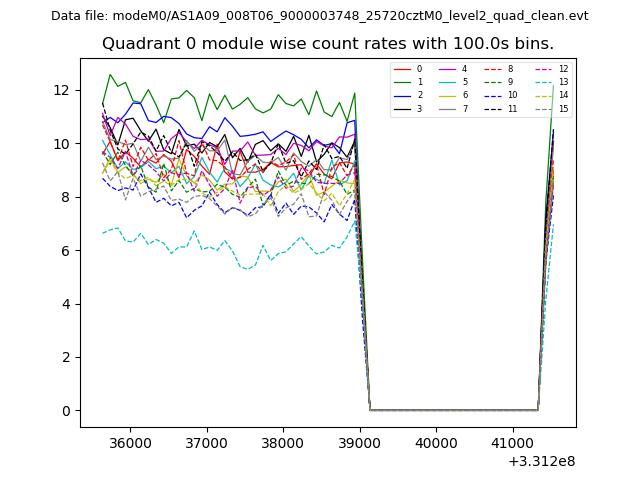
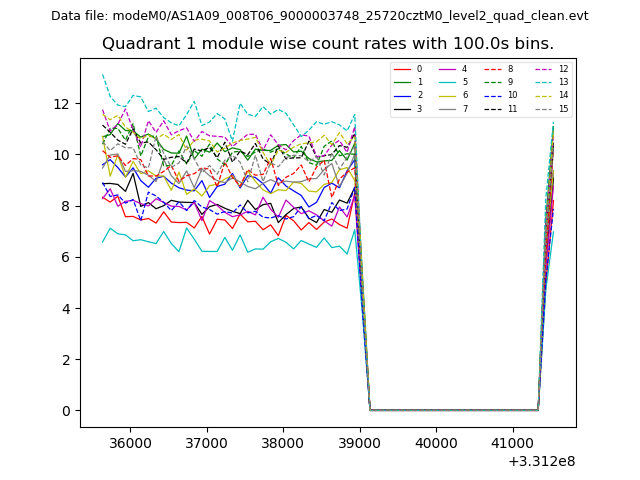
| Module-wise count rates for Quadrant A Data is divided into 100 sec bins |
 |
 |
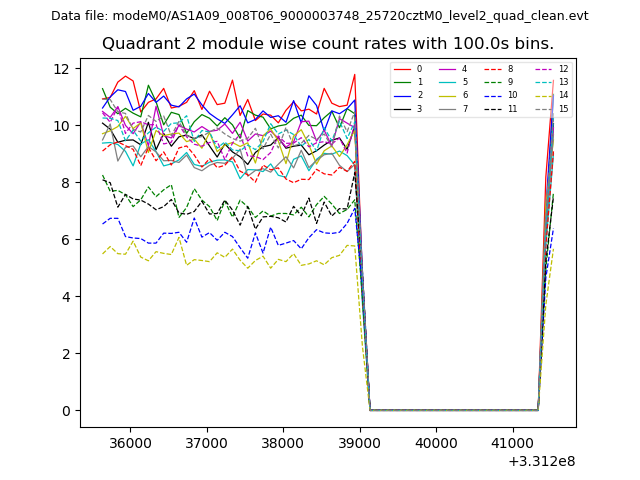
| Module-wise count rates for Quadrant B Data is divided into 100 sec bins |
 |
 |
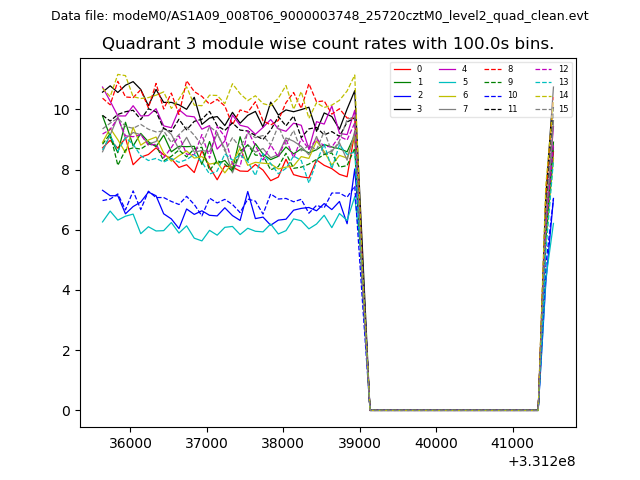
| Module-wise count rates for Quadrant C Data is divided into 100 sec bins |
 |
 |
| Module-wise count rates for Quadrant D Data is divided into 100 sec bins |
 |
 |
| Parameter | Plot |
|---|---|
| CZT HV Monitor | 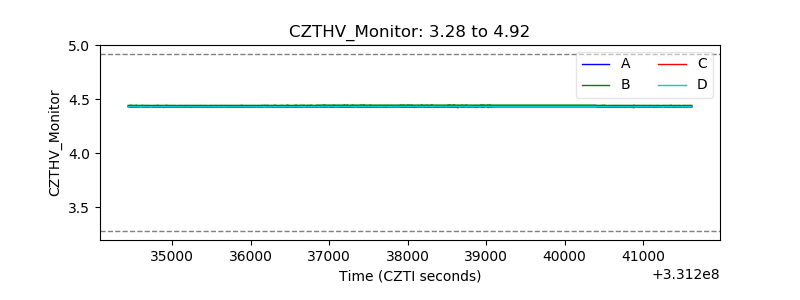 |
| D_VDD | 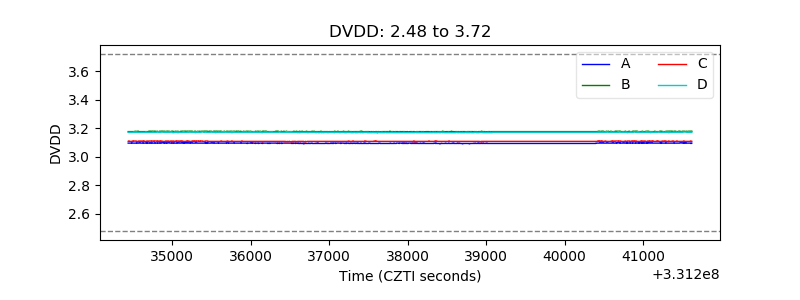 |
| Temperature 1 | 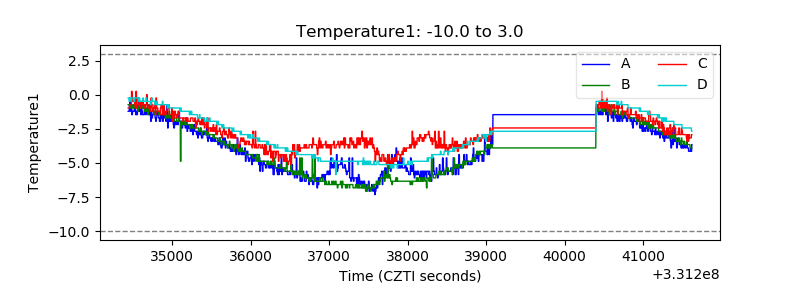 |
| Veto HV Monitor | 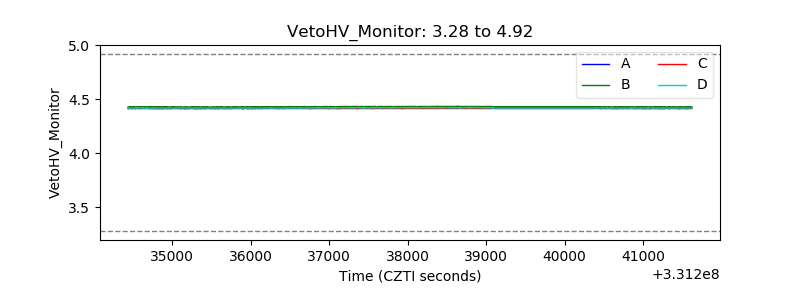 |
| Veto LLD | 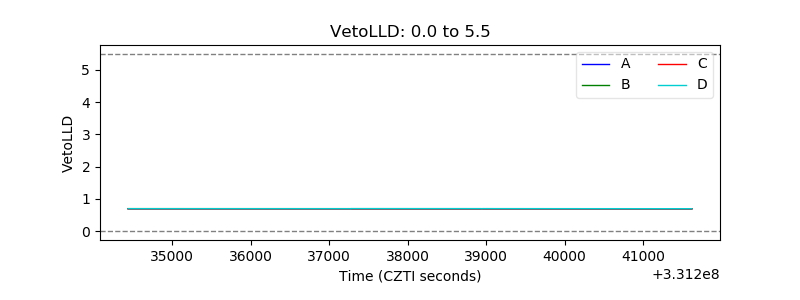 |
| Alpha Counter | 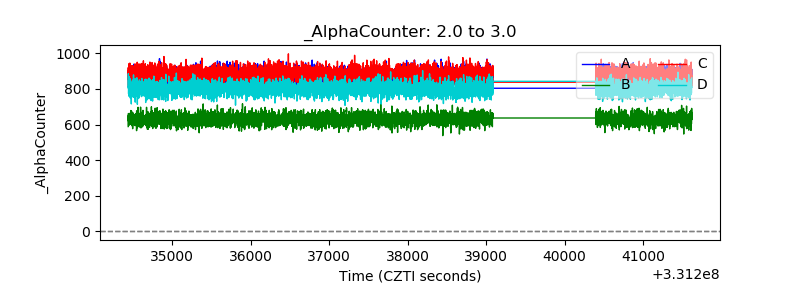 |
| _CPM_Rate | 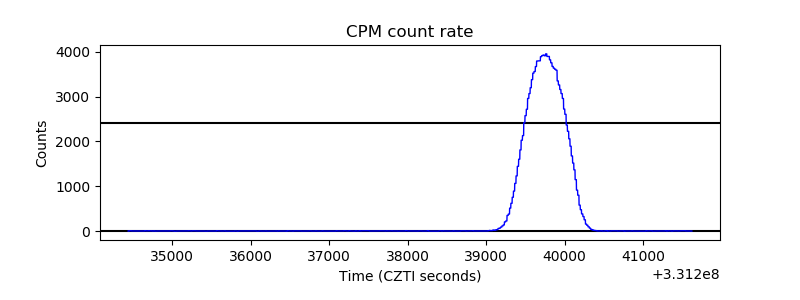 |
| CZT Counter | 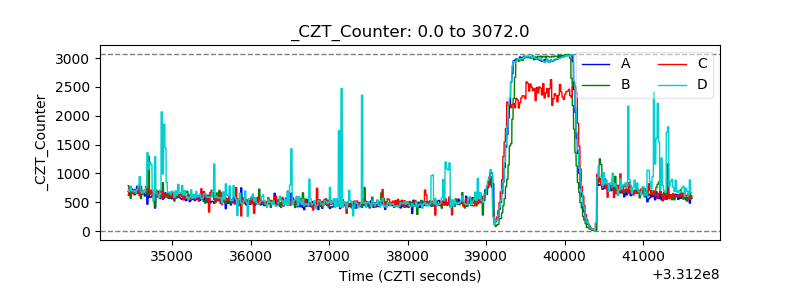 |
| +2.5 Volts monitor |  |
| +5 Volts monitor |  |
| _ROLL_ROT | 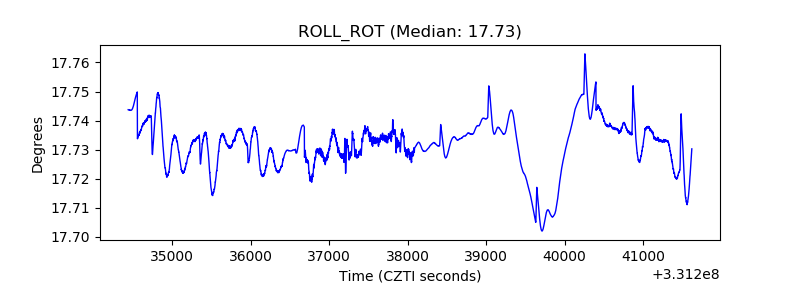 |
| _Roll_DEC | 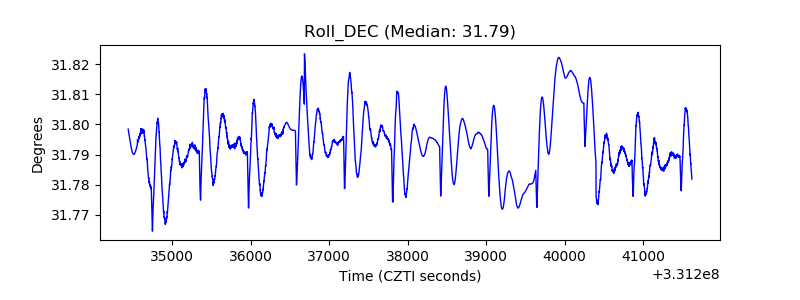 |
| _Roll_RA | 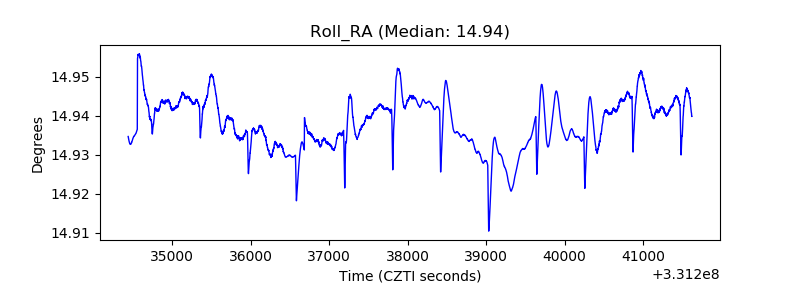 |
| Veto Counter | 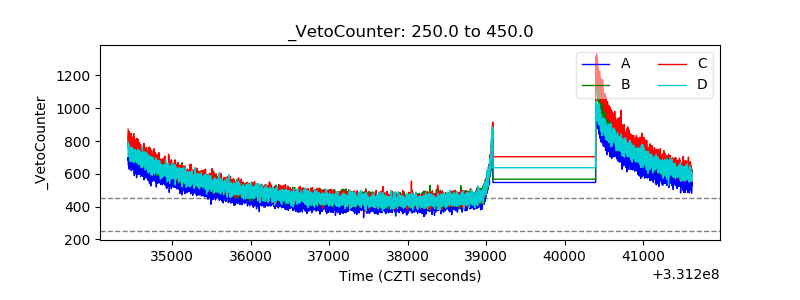 |