| Param | Original file | Final file |
|---|---|---|
| Filename | modeM0/AS1A09_008T06_9000003748_25721cztM0_level2.evt | modeM0/AS1A09_008T06_9000003748_25721cztM0_level2_quad_clean.evt |
| Size (bytes) | 476,110,080 | 97,850,880 |
| Size | 454.1 MB | 93.3 MB |
| Events in quadrant A | 3,218,947 | 643,988 |
| Events in quadrant B | 3,354,379 | 660,931 |
| Events in quadrant C | 3,344,038 | 637,085 |
| Events in quadrant D | 4,108,782 | 616,413 |
| Mode M0 | |||
|---|---|---|---|
| Quadrant | BADHDUFLAG | Total packets | Discarded packets |
| A | 0 | 13344 | 0 |
| B | 0 | 13842 | 0 |
| C | 0 | 13835 | 0 |
| D | 0 | 16155 | 0 |
| Mode M9 | |||
|---|---|---|---|
| Quadrant | BADHDUFLAG | Total packets | Discarded packets |
| A | 0 | 14 | 0 |
| B | 0 | 14 | 0 |
| C | 0 | 14 | 0 |
| D | 0 | 14 | 0 |
| Quadrant | Total seconds | Saturated seconds | Saturation percentage |
|---|---|---|---|
| A | 5793 | 40 | 0.690489% |
| B | 5793 | 58 | 1.001208% |
| C | 5794 | 106 | 1.829479% |
| D | 5794 | 151 | 2.606144% |
Noise dominated data is calculated using 1-second bins in cleaned event files. If a bin has >2000 counts, and if more than 50% of those come from <1% of pixels, then it is considered to be noise-dominated and hence unusable.
| Quadrant | # 1 sec bins | Bins with >0 counts | Bins with >2000 counts | High rate bins dominated by noise | Noise dominated (total time) | Noise dominated (detector-on time) | Marked lightcurve |
|---|---|---|---|---|---|---|---|
| A | 7223 | 5793 | 0 | 0 | 0.00% | 0.00% | 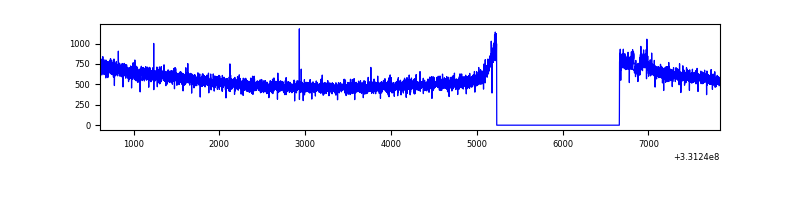 |
| B | 7223 | 5794 | 8 | 8 | 0.11% | 0.14% | 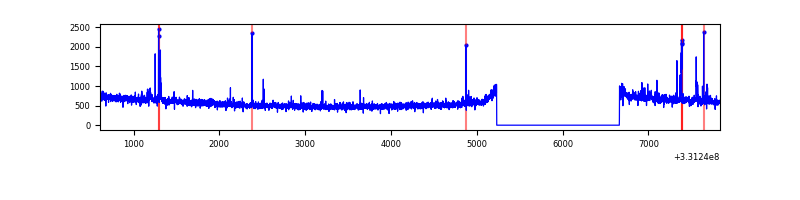 |
| C | 7224 | 5794 | 0 | 0 | 0.00% | 0.00% | 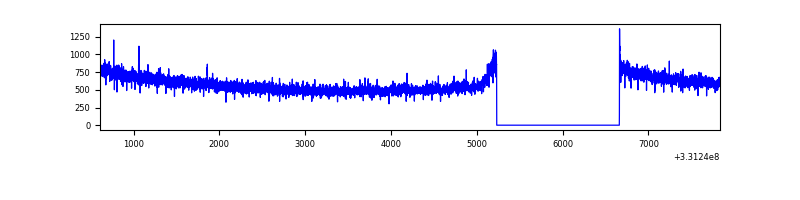 |
| D | 7224 | 5795 | 108 | 108 | 1.50% | 1.86% | 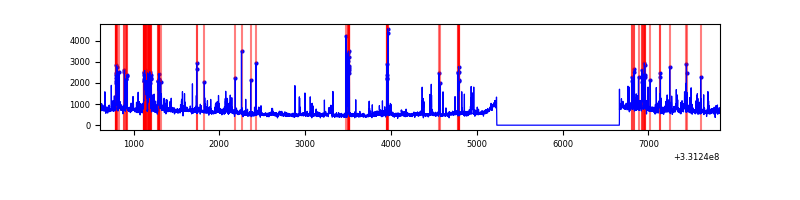 |
Top three noisy pixels from each quadrant. If the there are fewer than three noisy pixels in the level2.evt file, extra rows are filled as -1
| Pixel properties | Quadrant properties | ||||||
|---|---|---|---|---|---|---|---|
| Quadrant | DetID | PixID | Counts | Sigma | Mean | Median | Sigma |
| A | 9 | 130 | 26098 | 154.97 | 827 | 813 | 163.2 |
| A | 13 | 254 | 9809 | 55.14 | 827 | 813 | 163.2 |
| A | 0 | 226 | 7013 | 38.0 | 827 | 813 | 163.2 |
| B | 5 | 172 | 43670 | 282.09 | 830 | 816 | 151.9 |
| B | 0 | 190 | 26039 | 166.03 | 830 | 816 | 151.9 |
| B | 3 | 112 | 22544 | 143.03 | 830 | 816 | 151.9 |
| C | 14 | 238 | 131983 | 699.24 | 814 | 822 | 187.6 |
| C | 3 | 233 | 31059 | 161.2 | 814 | 822 | 187.6 |
| C | 1 | 16 | 6098 | 28.13 | 814 | 822 | 187.6 |
| D | 1 | 52 | 683688 | 3480.42 | 816 | 796 | 196.2 |
| D | 8 | 195 | 170079 | 862.77 | 816 | 796 | 196.2 |
| D | 12 | 233 | 61739 | 310.6 | 816 | 796 | 196.2 |
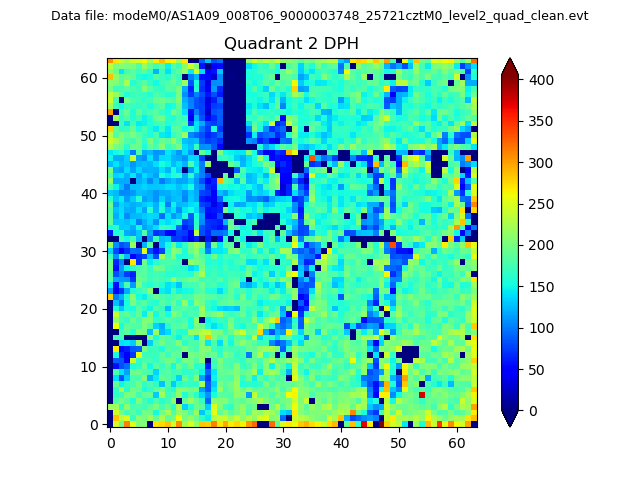
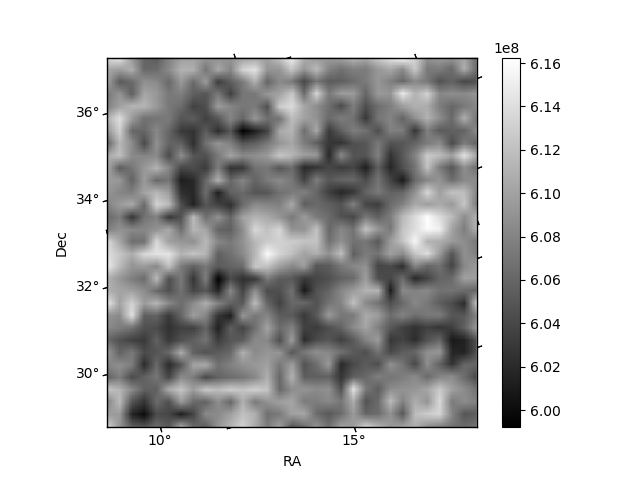
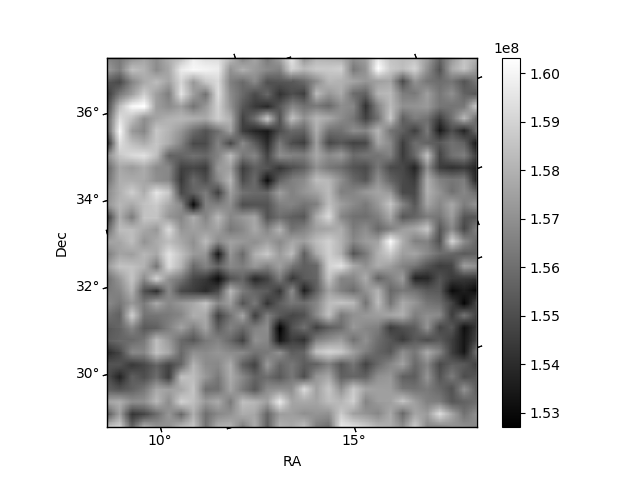
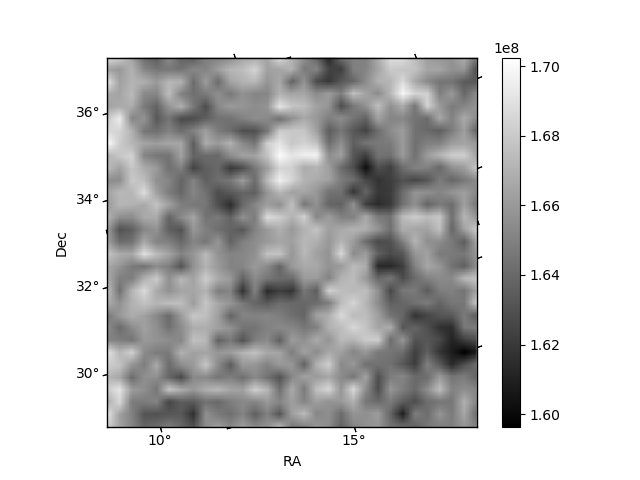
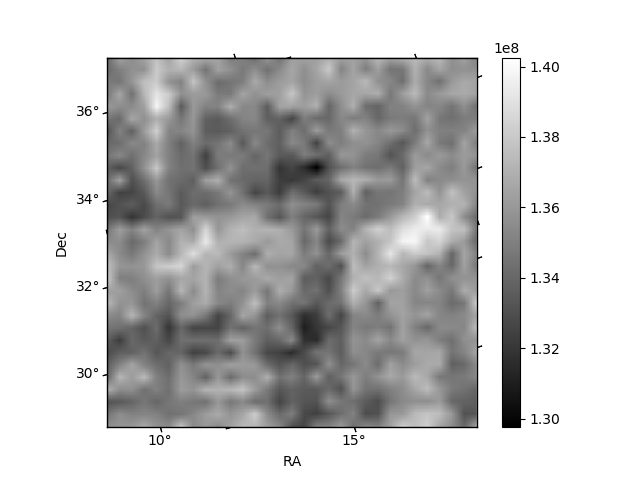
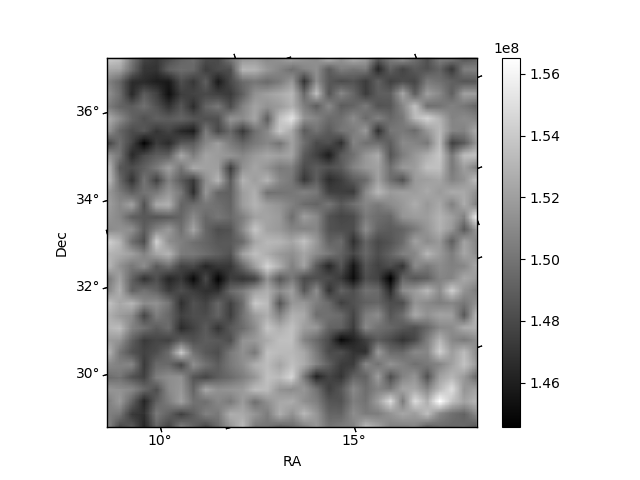
Histogram calculated using DETX and DETY for each event in the final _common_clean file
| Quadrant A | 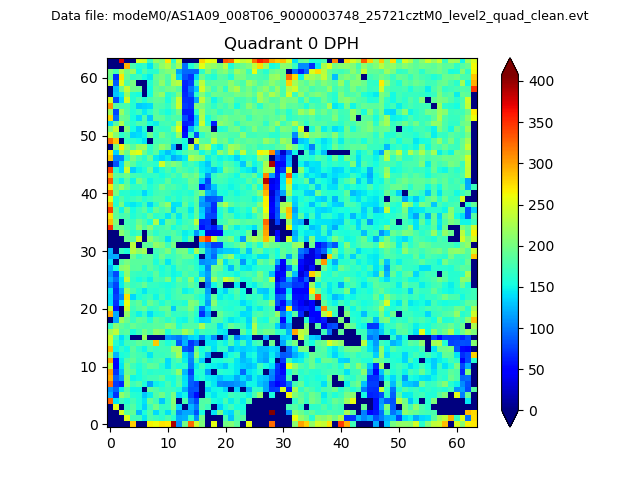 |
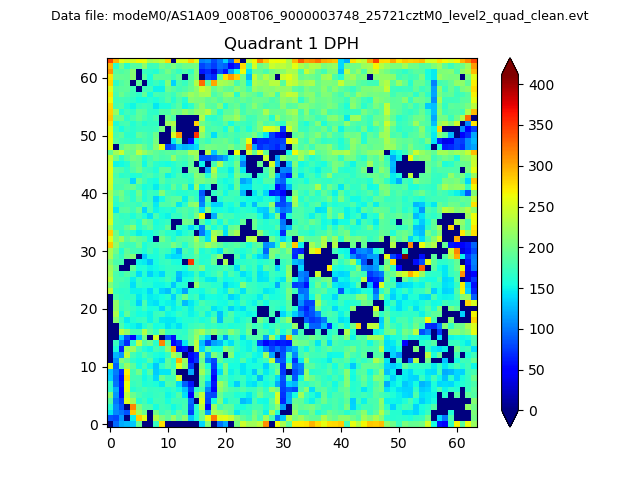 |
Quadrant B |
|---|---|---|---|
| Quadrant D | 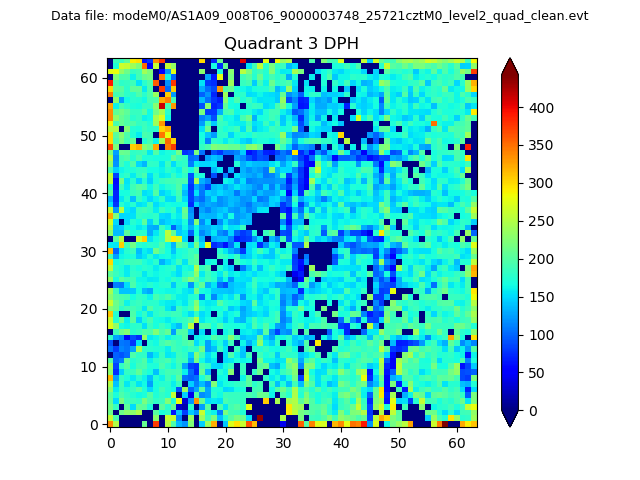 |
 |
Quadrant C |
| Plot type | Count rate plots | Images |
|---|---|---|
| Comparison with Poisson distribution Blue bars denote a histogram of data divided into 1 sec bins. Red curve is a Poisson curve with rate = median count rate of data. |
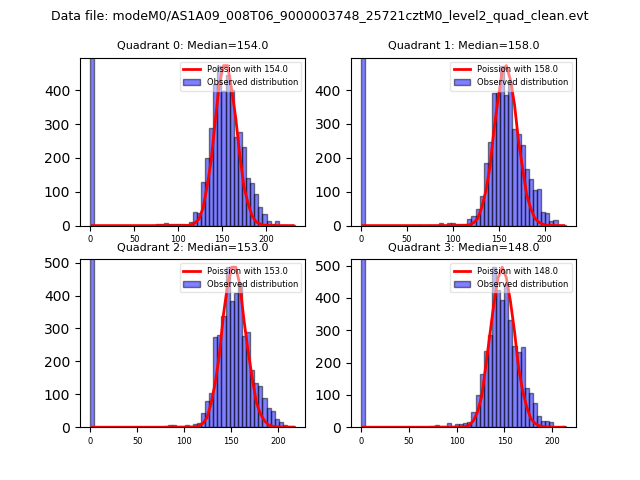 |
 |
| Quadrant-wise count rates Data is divided into 100 sec bins |
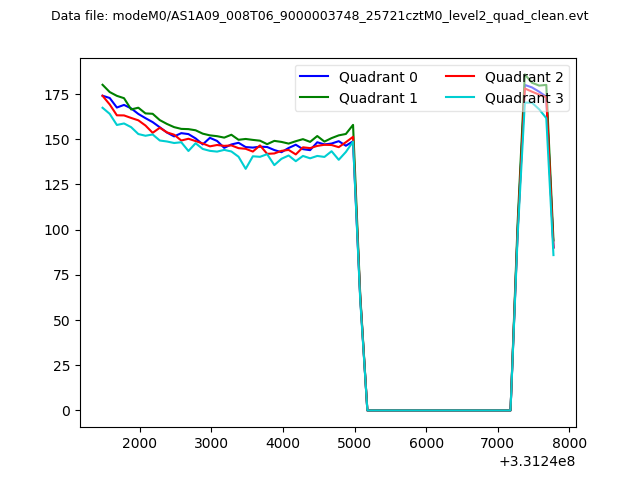 |
|
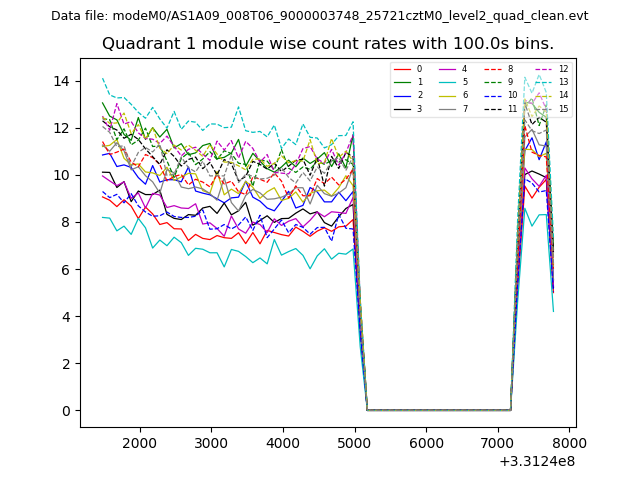
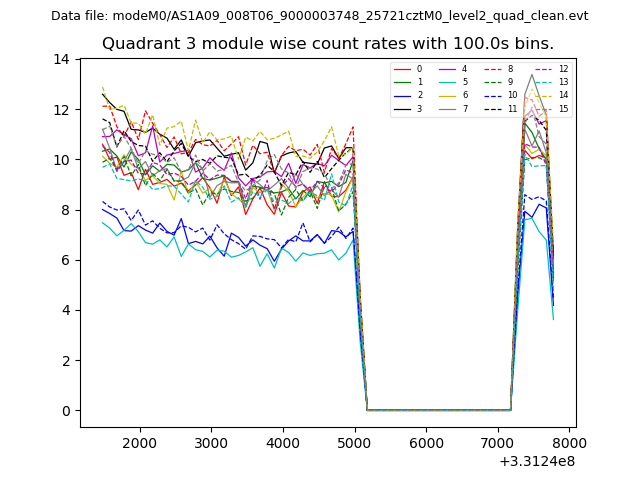
| Module-wise count rates for Quadrant A Data is divided into 100 sec bins |
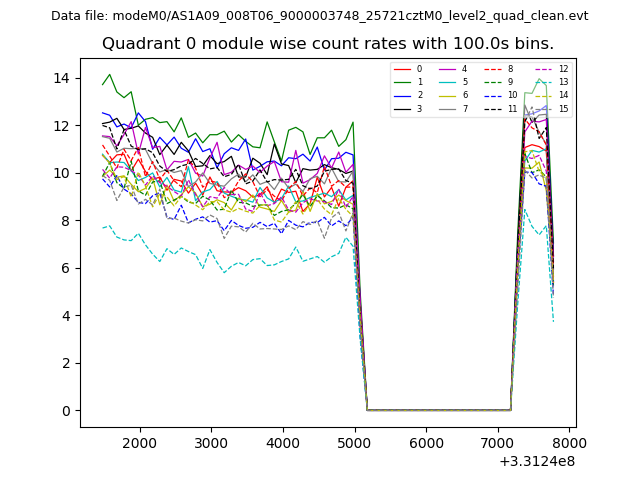 |
 |
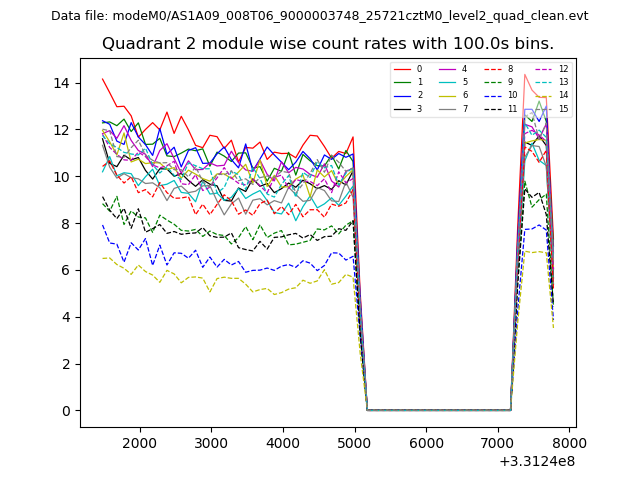
| Module-wise count rates for Quadrant B Data is divided into 100 sec bins |
 |
 |
| Module-wise count rates for Quadrant C Data is divided into 100 sec bins |
 |
 |
| Module-wise count rates for Quadrant D Data is divided into 100 sec bins |
 |
 |
| Parameter | Plot |
|---|---|
| CZT HV Monitor | 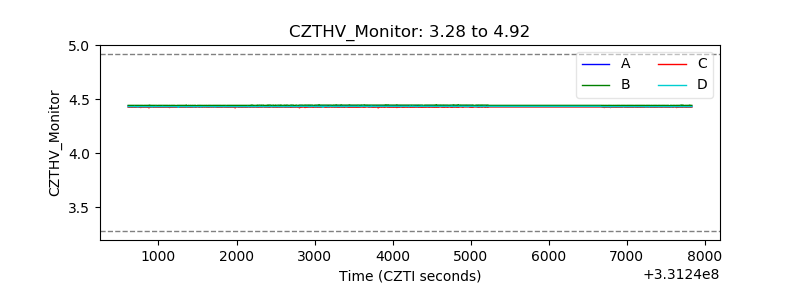 |
| D_VDD | 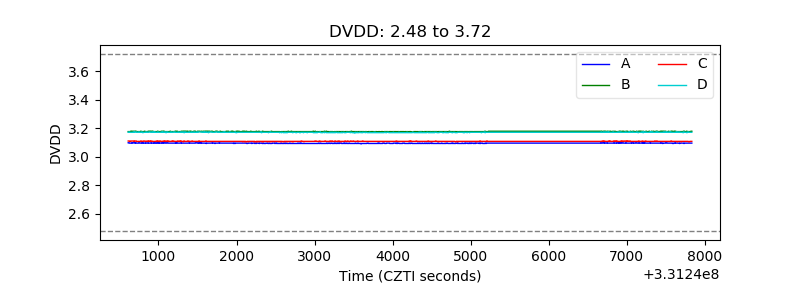 |
| Temperature 1 | 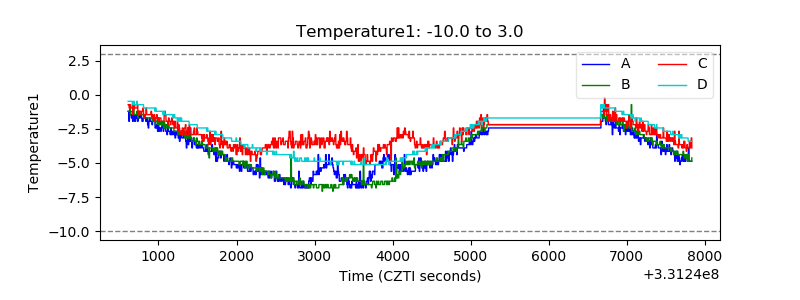 |
| Veto HV Monitor | 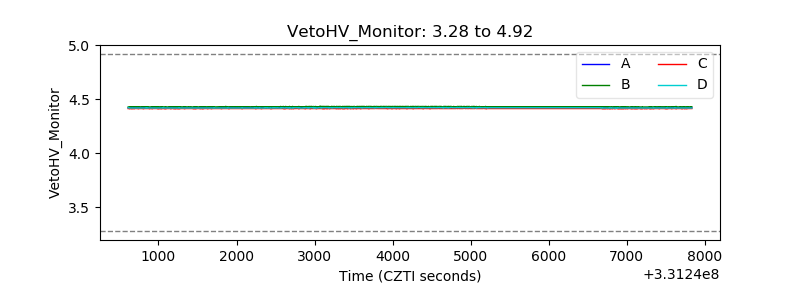 |
| Veto LLD | 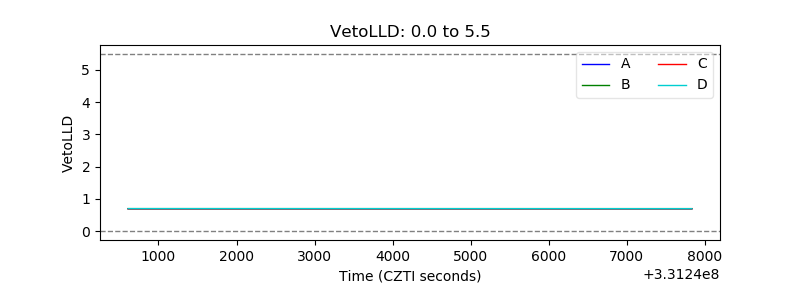 |
| Alpha Counter | 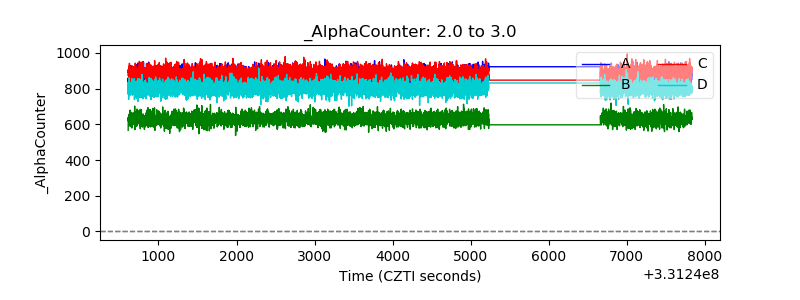 |
| _CPM_Rate | 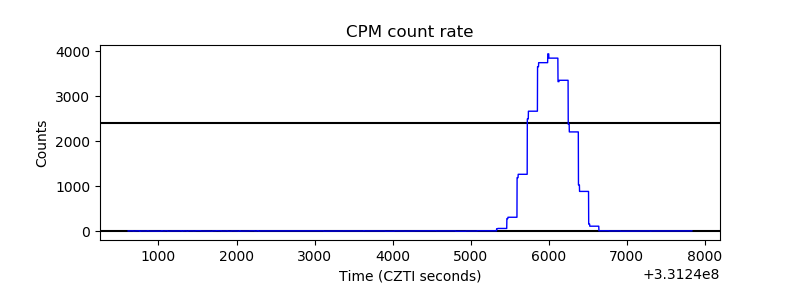 |
| CZT Counter | 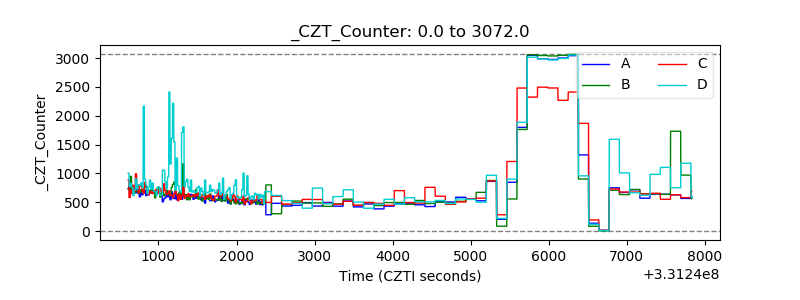 |
| +2.5 Volts monitor | 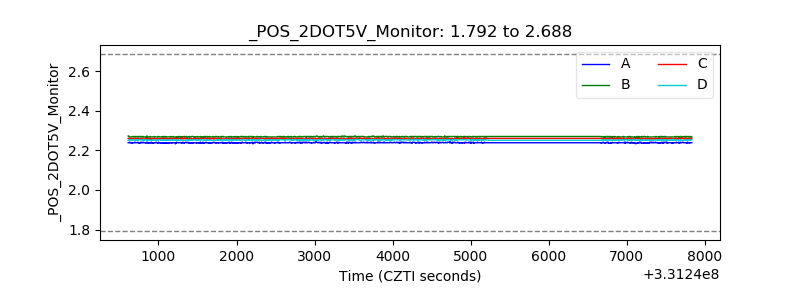 |
| +5 Volts monitor |  |
| _ROLL_ROT | 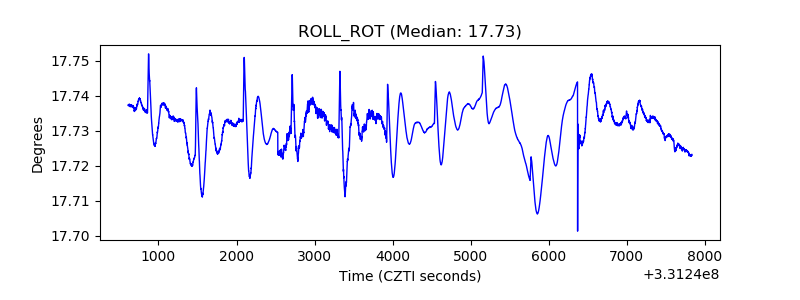 |
| _Roll_DEC | 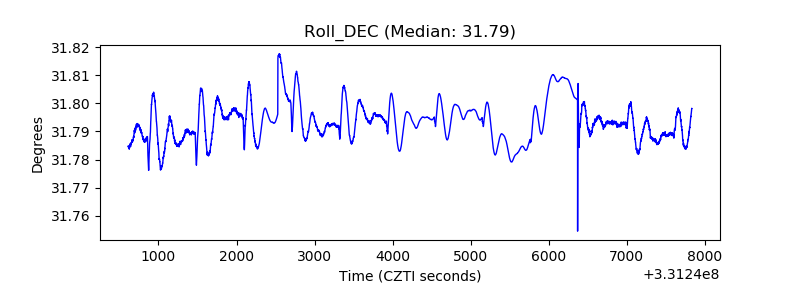 |
| _Roll_RA | 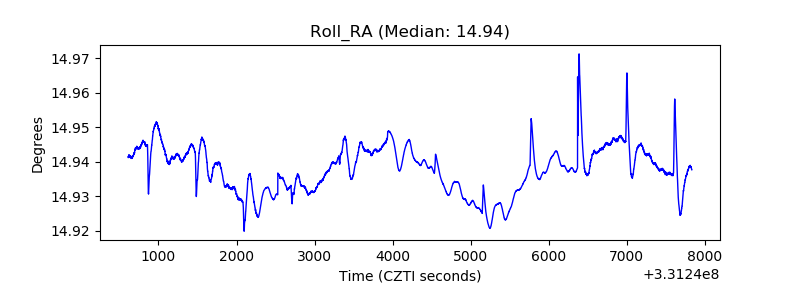 |
| Veto Counter | 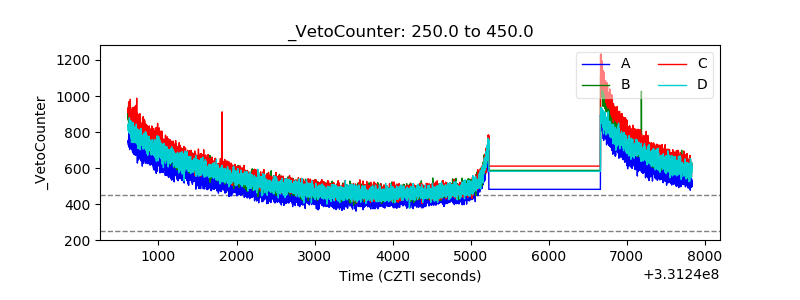 |