| Param | Original file | Final file |
|---|---|---|
| Filename | modeM0/AS1A09_008T06_9000003748_25722cztM0_level2.evt | modeM0/AS1A09_008T06_9000003748_25722cztM0_level2_quad_clean.evt |
| Size (bytes) | 507,260,160 | 109,500,480 |
| Size | 483.8 MB | 104.4 MB |
| Events in quadrant A | 3,431,558 | 720,309 |
| Events in quadrant B | 3,578,126 | 746,229 |
| Events in quadrant C | 3,555,969 | 722,237 |
| Events in quadrant D | 4,375,537 | 694,157 |
| Mode M0 | |||
|---|---|---|---|
| Quadrant | BADHDUFLAG | Total packets | Discarded packets |
| A | 0 | 14139 | 0 |
| B | 0 | 14679 | 0 |
| C | 0 | 14605 | 0 |
| D | 0 | 17280 | 0 |
| Mode M9 | |||
|---|---|---|---|
| Quadrant | BADHDUFLAG | Total packets | Discarded packets |
| A | 0 | 28 | 0 |
| B | 0 | 28 | 0 |
| C | 0 | 28 | 0 |
| D | 0 | 28 | 0 |
| Quadrant | Total seconds | Saturated seconds | Saturation percentage |
|---|---|---|---|
| A | 6212 | 88 | 1.416613% |
| B | 6213 | 127 | 2.044101% |
| C | 6213 | 185 | 2.977628% |
| D | 6213 | 221 | 3.557058% |
Noise dominated data is calculated using 1-second bins in cleaned event files. If a bin has >2000 counts, and if more than 50% of those come from <1% of pixels, then it is considered to be noise-dominated and hence unusable.
| Quadrant | # 1 sec bins | Bins with >0 counts | Bins with >2000 counts | High rate bins dominated by noise | Noise dominated (total time) | Noise dominated (detector-on time) | Marked lightcurve |
|---|---|---|---|---|---|---|---|
| A | 9037 | 6213 | 0 | 0 | 0.00% | 0.00% | 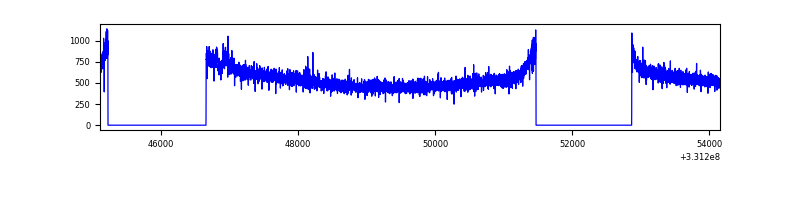 |
| B | 9038 | 6214 | 8 | 8 | 0.09% | 0.13% | 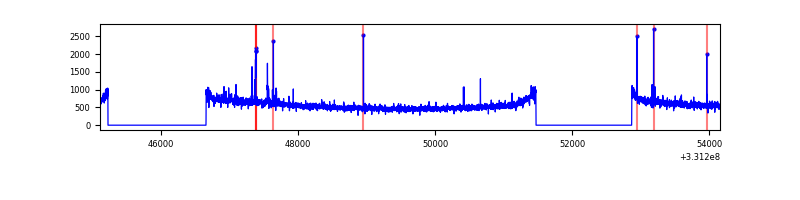 |
| C | 9038 | 6213 | 0 | 0 | 0.00% | 0.00% | 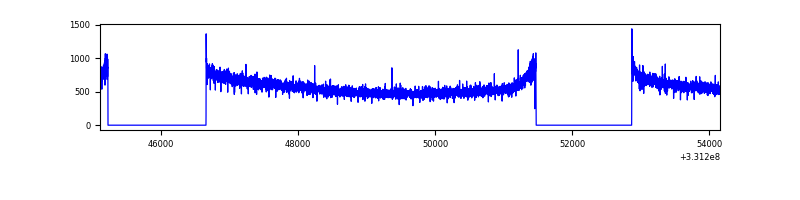 |
| D | 9038 | 6214 | 109 | 109 | 1.21% | 1.75% | 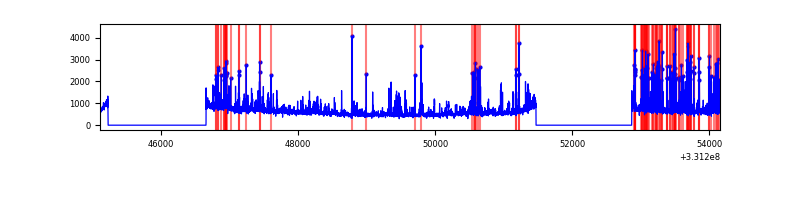 |
Top three noisy pixels from each quadrant. If the there are fewer than three noisy pixels in the level2.evt file, extra rows are filled as -1
| Pixel properties | Quadrant properties | ||||||
|---|---|---|---|---|---|---|---|
| Quadrant | DetID | PixID | Counts | Sigma | Mean | Median | Sigma |
| A | 9 | 130 | 25225 | 139.69 | 882 | 866 | 174.4 |
| A | 13 | 254 | 10426 | 54.82 | 882 | 866 | 174.4 |
| A | 0 | 226 | 7516 | 38.14 | 882 | 866 | 174.4 |
| B | 5 | 172 | 29923 | 176.31 | 889 | 871 | 164.8 |
| B | 0 | 190 | 22024 | 128.37 | 889 | 871 | 164.8 |
| B | 12 | 111 | 18619 | 107.71 | 889 | 871 | 164.8 |
| C | 14 | 238 | 139077 | 690.47 | 869 | 879 | 200.1 |
| C | 3 | 233 | 21095 | 101.0 | 869 | 879 | 200.1 |
| C | 1 | 16 | 6124 | 26.21 | 869 | 879 | 200.1 |
| D | 1 | 52 | 902912 | 4296.35 | 871 | 849 | 210.0 |
| D | 2 | 244 | 62404 | 293.17 | 871 | 849 | 210.0 |
| D | 13 | 104 | 50291 | 235.48 | 871 | 849 | 210.0 |
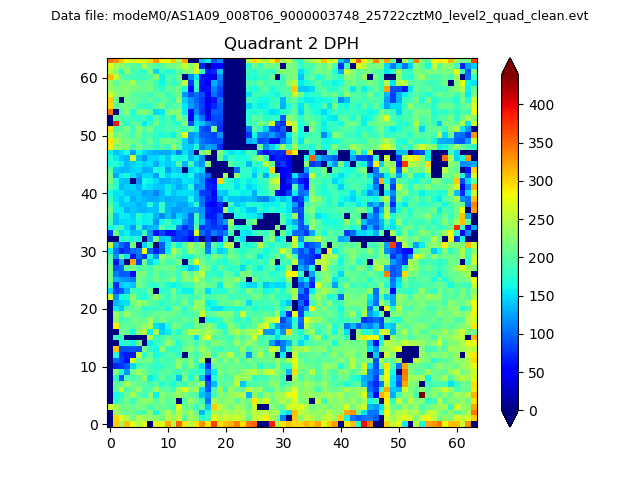
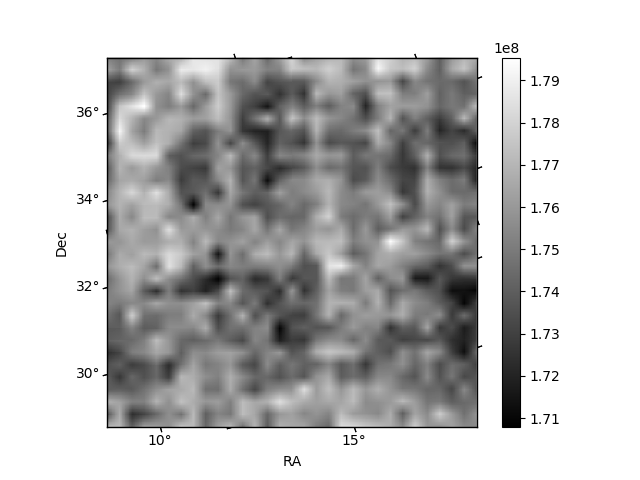
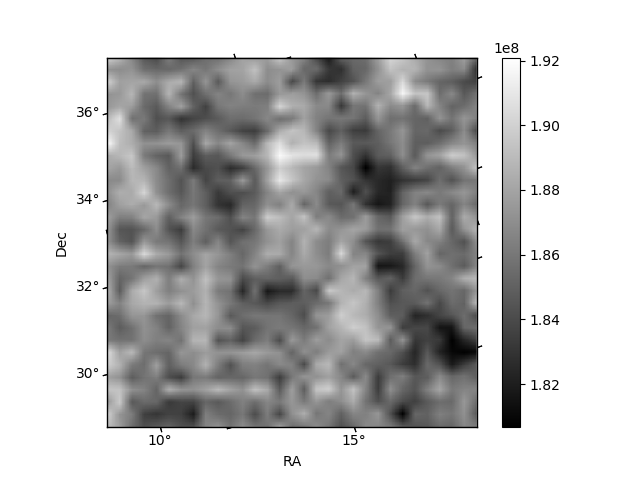
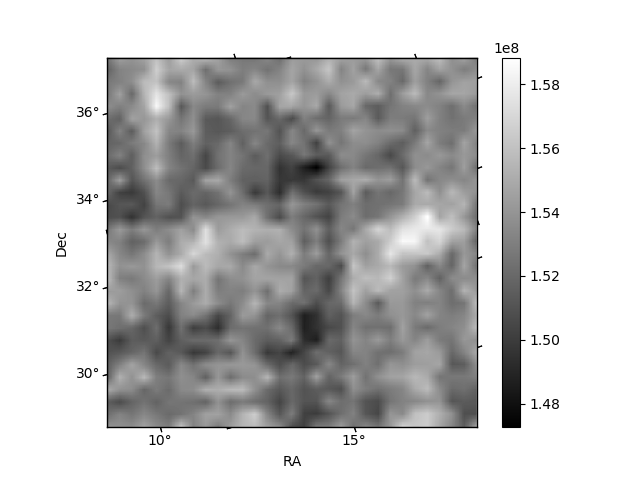
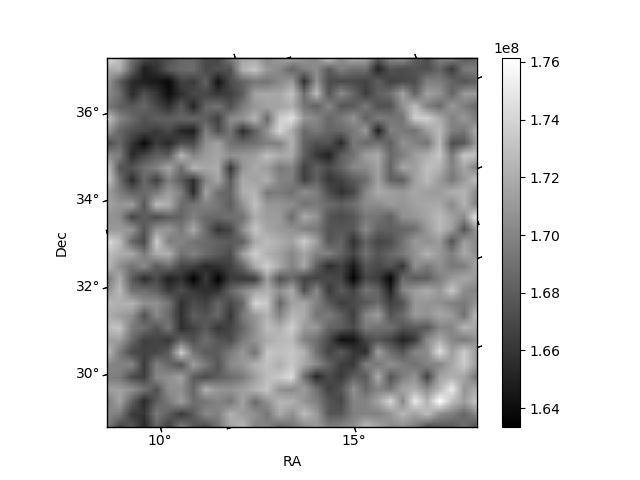
Histogram calculated using DETX and DETY for each event in the final _common_clean file
| Quadrant A | 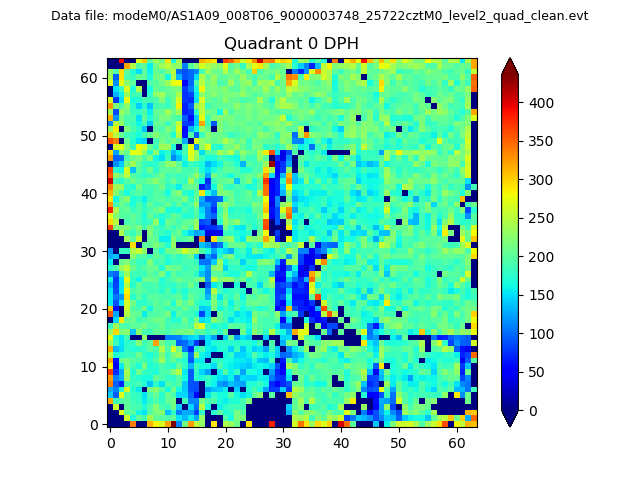 |
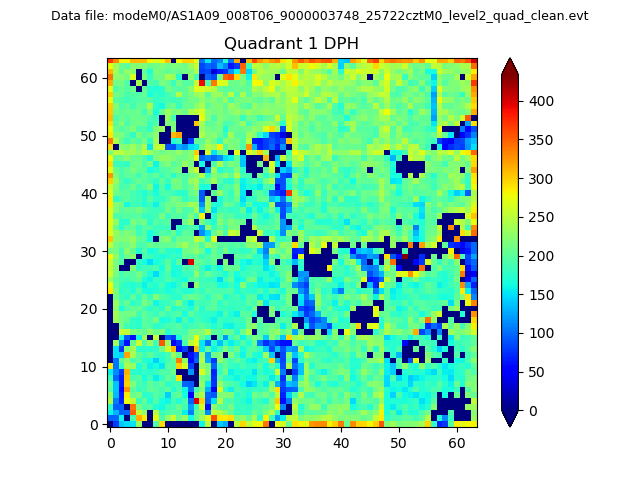 |
Quadrant B |
|---|---|---|---|
| Quadrant D | 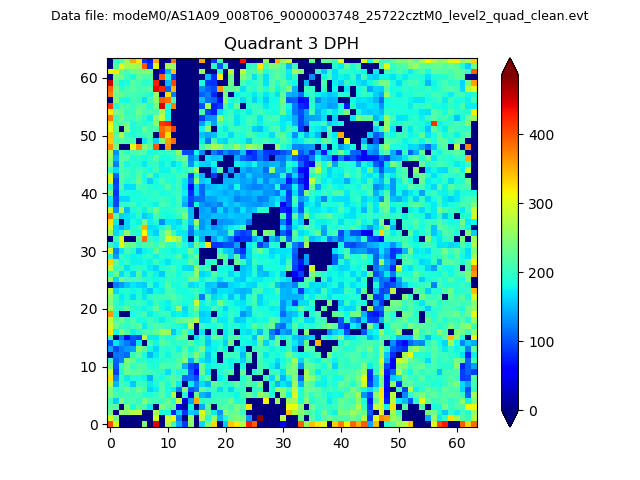 |
 |
Quadrant C |
| Plot type | Count rate plots | Images |
|---|---|---|
| Comparison with Poisson distribution Blue bars denote a histogram of data divided into 1 sec bins. Red curve is a Poisson curve with rate = median count rate of data. |
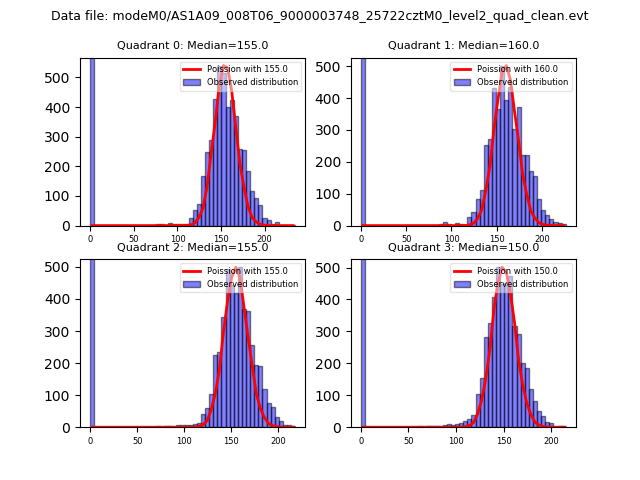 |
 |
| Quadrant-wise count rates Data is divided into 100 sec bins |
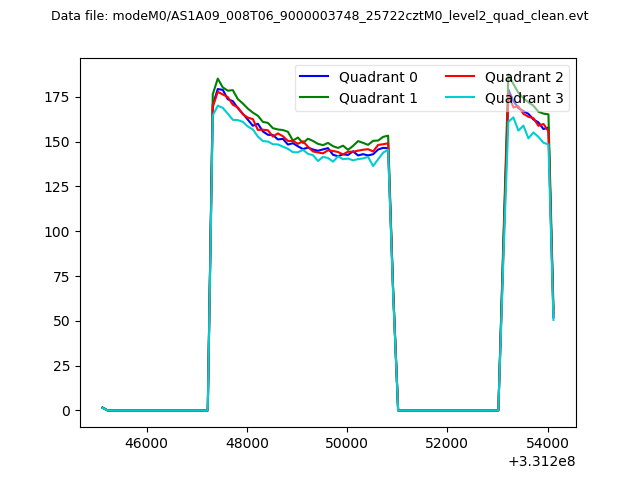 |
|
| Module-wise count rates for Quadrant A Data is divided into 100 sec bins |
 |
 |
| Module-wise count rates for Quadrant B Data is divided into 100 sec bins |
 |
 |
| Module-wise count rates for Quadrant C Data is divided into 100 sec bins |
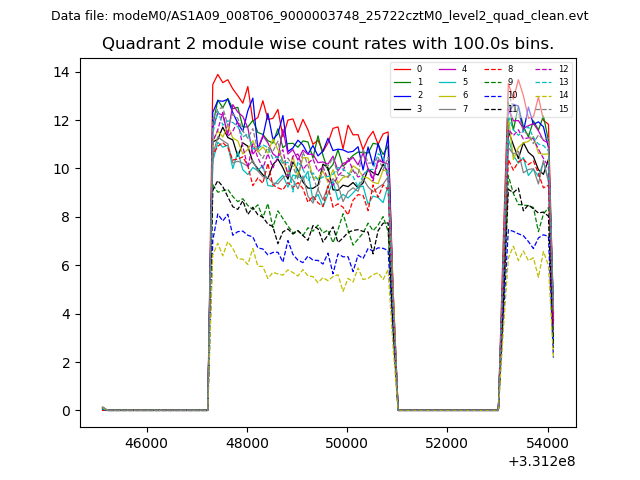 |
 |
| Module-wise count rates for Quadrant D Data is divided into 100 sec bins |
 |
 |
| Parameter | Plot |
|---|---|
| CZT HV Monitor | 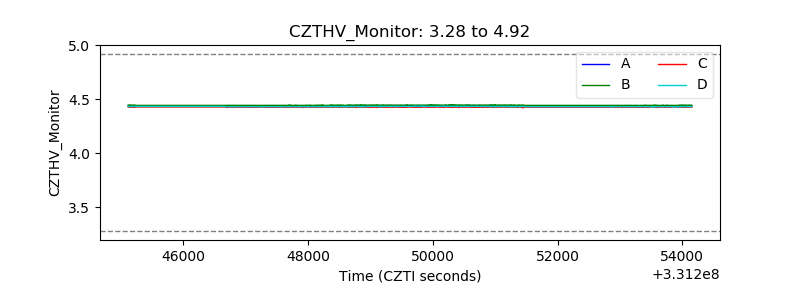 |
| D_VDD | 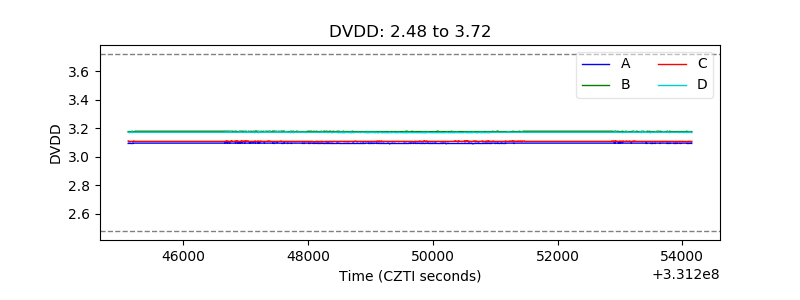 |
| Temperature 1 | 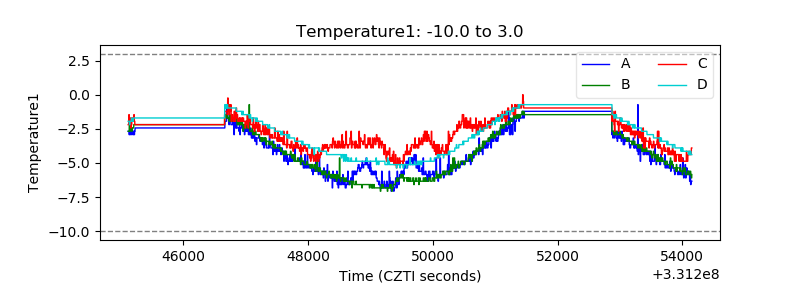 |
| Veto HV Monitor | 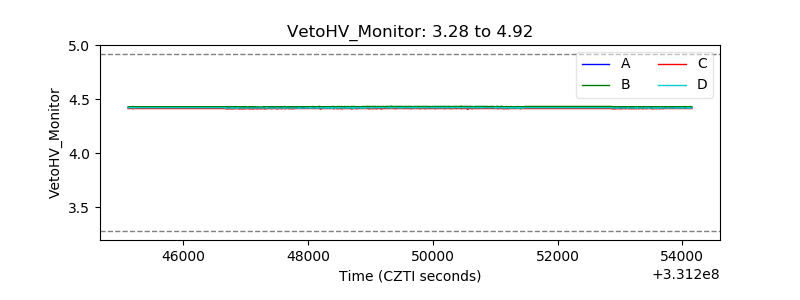 |
| Veto LLD | 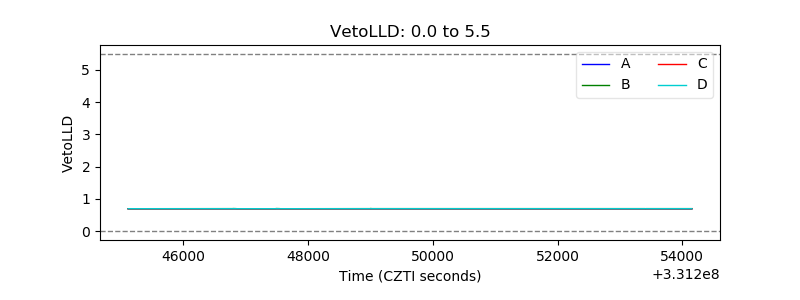 |
| Alpha Counter | 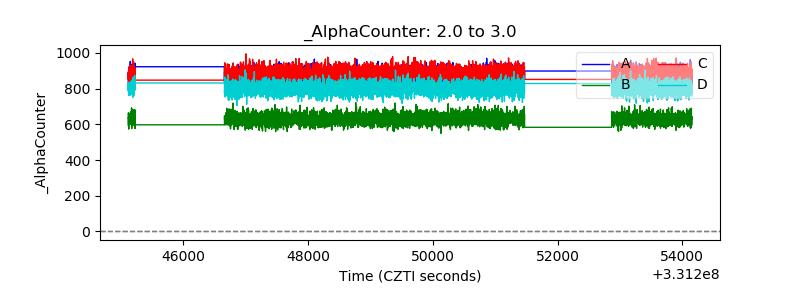 |
| _CPM_Rate | 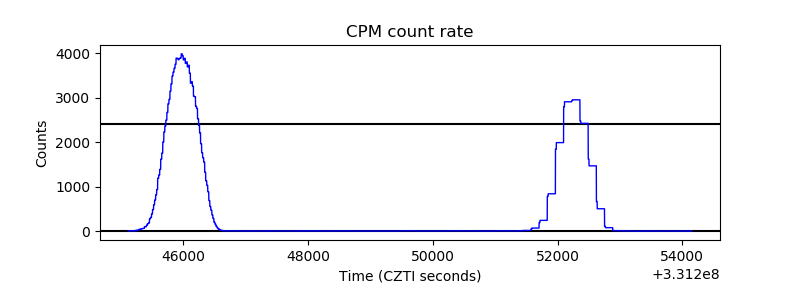 |
| CZT Counter |  |
| +2.5 Volts monitor |  |
| +5 Volts monitor |  |
| _ROLL_ROT | 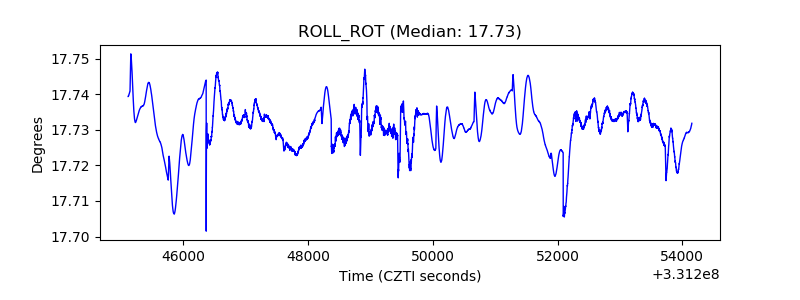 |
| _Roll_DEC |  |
| _Roll_RA |  |
| Veto Counter |  |